
GIS(Geospatital Information System)
-
공간 데이터(지리 정보 데이터)
- 데이터가 위치에 대한 정보를 갖고 있는 것
- 도시의 건축물 좌표(point)
- 도로(line)
- 시군구 법정동에 해당하는 영역(polygon)
- 데이터가 위치에 대한 정보를 갖고 있는 것
-
단순한 수치적 파악 외에도 지리적 위치에 따라 다른 시각으로 접근이 가능하므로 공간 데이터 이해가 중요함
(예) 읍면동별 각종 통계자료 → 단순 차이만 보는 것보다 지도에 mapping하여 인접한 읍면동이 어디인지(지리적 인접성), 주로 어떤 구에서 어떤 특징이 관찰되는지(시장성)를 같이 확인 ☞ 더 나은 인사이트 도출 가능 -
위치 정보를 포함하고 있는 데이터 분류
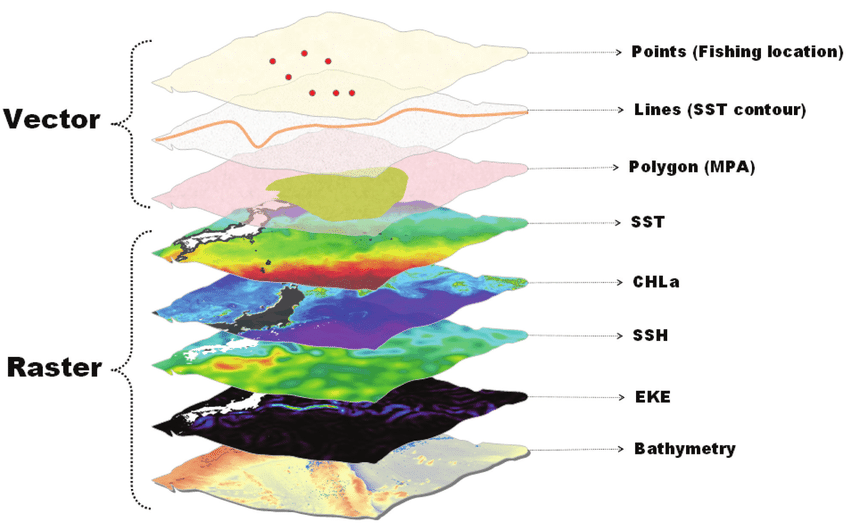
- Vector
- point: 도시기반시설, 건물, 교차로(node) 등을 나타낼 때
- line: 도로, 경로, 네트워크, 어떤 면의 중심선, 철도 등을 나타낼 때
- polygon: 어떤 지역, 군, 영역 등을 나타낼 때
- Raster
- 이미지 형태의 데이터
- Vector
Geopandas
- Pandas와 유사한 라이브러리
- Pandas와 마찬가지로
GeoSeries,GeoDataFrame의 타입으로 나눔 - function이나 attribute들도 큰 차이가 없음
- Pandas와 마찬가지로
- 공간 정보를 가진 데이터프레임을 다루는 데 유용한 패키지
공간 데이터 생성
- Geopandas는 내부적으로
shapely라는 패키지를 사용해 공간 정보를 처리 - 세 가지 vector type(point, line, polygon) + MultiPolygon + MultiLinestring 등의 타입이 존재
- 점은 1개, 선은 2개, 다각형은 3개 이상의 좌표가 필요함
import geopandas as gpd
from shapely.geometry import Polygon, LineString, Point

x1 ,y1 = 1,2
x2, y2 = 2,2
x3, y3 = 2,3
x4, y4 = 1,3

Point([x1,y1])
LineString([(x1,y1),(x3,y3)])
Polygon([(x1,y1),(x2,y2),(x3,y3),(x4,y4)])
주의 사항
- Polygon 좌표에는 순서가 존재
- 3번 좌표와 4번 좌표를 바꿀 경우 모양이 바뀜
Polygon(sorted([(x1,y1),(x2,y2),(x4,y4),(x3,y3)]))
시각화
import matplotlib.pyplot as plt

point = Point([x1,y1])
line = LineString([(x1,y1),(x3,y3)])
polygon = Polygon([(x1,y1),(x2,y2),(x3,y3),(x4,y4)])

ax = gpd.GeoSeries(polygon).plot( color='black', alpha=0.5)
gpd.GeoSeries(line).plot(ax=ax, linewidth=3, color='white')
gpd.GeoSeries(point).plot(ax=ax, color='red', markersize=100)
plt.axis('off')
plt.show()
print(point.geom_type)
print(line.geom_type)
print(polygon.geom_type)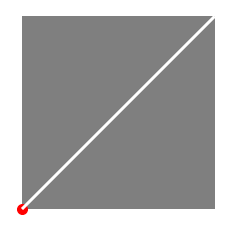
Point
LineString
Polygon
공간 데이터의 형태
- point 좌표 데이터
- 주로 csv 파일
- 경도와 위도 좌표를 가진 경우
- polygon 데이터
- polygon의 경우 GIS 데이터는 shapefile이라고 함
- 3개 이상의 확장 포맷(
dbf,prj,shp,shx)을 통틀어 부름
- 3개 이상의 확장 포맷(
- 4개의 파일은 각자의 공간 정보를 담고 있어 한 경로에 같이 보관되어야 함!
dbf: dBase 데이터베이서 파일. 데이터프레임 형태의 정보를 갖고 있음.prj: 공간 데이터의 좌표정보(좌표계)를 가지고 있음. 좌표 정의가 되어 있지 않을 경우 이 파일이 없을 수 있음.shp: vector 타입의 도형 및 정보를 담고 있음.shx: shp 파일과 마찬가지. Auto CAD에서 주로 활용.
- polygon의 경우 GIS 데이터는 shapefile이라고 함
위도와 경도 좌표 이용해 공간 데이터 만들기
- 예제 1
pt_119['경도'] = pt_119['경도'].astype(float)
pt_119['위도'] = pt_119['위도'].astype(float)
pt_119['geometry'] = pt_119.apply(lambda row : Point([row['경도'], row['위도']]), axis=1)
pt_119 = gpd.GeoDataFrame(pt_119, geometry='geometry')- 예제 2
point_1_4 = gpd.GeoDataFrame(df_1_4, geometry=gpd.points_from_xy(df_1_4['lon'], df_1_4['lat']), crs='epsg:4326')좌표정의 및 변환
-
데이터를 받아올 때 꼭 어떤 좌표계로 만들어진 데이터인지를 확인해야 그 데이터를 활용할 수 있음
- 좌표계를 모르면 못 쓰는 데이터라 해도 무방
- 서로 다른 좌표계를 통일시키거나 변환할 때는 먼저 해당 데이터가 정의된 좌표계가 어떤 것인지 알아야 함
-
대표적으로 위경도, 미터좌표계 등이 있음
- EPSG4326(WGS84)
- 위경도, 기본좌표계
- EPSG5179(TM)
- 미터 좌표계
- EPSG5174(TM)
- 미터 좌표계
- EPSG5181(TM)
- 미터 좌표계
- EPSG4326(WGS84)
-
참고
-
기본적으로 python이나 qgis에 내장된 각 좌표계를 사용해도 큰 문제는 없지만 보정좌표 등을 정확하게 정의해 주기 위해서는 직접 해당 좌표계를 정의해주는게 좋다고 함
- 좌표계 확인 및 정의:
.crs인자 - 변환:
.to_crs인자
- 좌표계 확인 및 정의:
print(seoul_area.crs)
print(pt_119.crs)
[실행 결과]
{'init': 'epsg:5179'}
Nonept_119.crs = {'init':'epsg:4326'}
print(pt_119.crs)[실행 결과]
{'init': 'epsg:4326'}- 일반적으로 미터 단위로 분석을 진행해야 하므로
epsg5179로 통일한다고 함
pt_119 = pt_119.to_crs({'init':'epsg:5179'})

# 시각화
ax = seoul_area.plot(column="SGG_NM", figsize=(8,8), alpha=0.8)
pt_119.plot(ax=ax, marker='v', color='black', label='Firestation')
ax.set_title("Seoul", fontsize=20)
ax.set_axis_off()
plt.legend()
plt.show()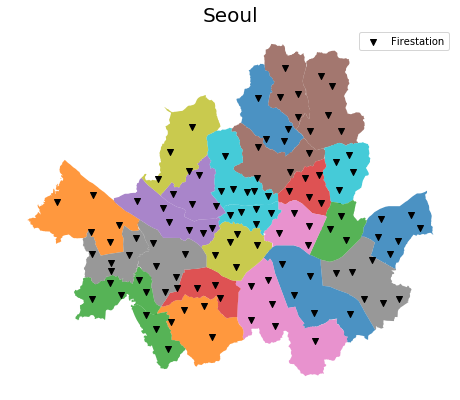
공간 정보 데이터 변형, 가공, 처리하기
import pandas as pd
import geopandas as gpd
from shapely.geometry import Point, Polygon, LineString
import matplotlib.pyplot as plt
import matplotlib
import matplotlib.font_manager as fm
font_name = fm.FontProperties(fname = 'C:/Windows/Fonts/malgun.ttf').get_name()
matplotlib.rc('font', family = font_name)

seoul_area = gpd.GeoDataFrame.from_file('data/LARD_ADM_SECT_SGG_11.shp', encoding='cp949')
pt_119 = pd.read_csv('data/서울시 안전센터관할 위치정보 (좌표계_ WGS1984).csv', encoding='cp949', dtype=str)
pt_119['경도'] = pt_119['경도'].astype(float)
pt_119['위도'] = pt_119['위도'].astype(float)
pt_119['geometry'] = pt_119.apply(lambda row : Point([row['경도'], row['위도']]), axis=1)
pt_119 = gpd.GeoDataFrame(pt_119, geometry='geometry')
pt_119.crs = {'init':'epsg:4326'}
pt_119 = pt_119.to_crs({'init':'epsg:5179'})
객체 속성
area: 면적 계산
# area
seoul_area.geometry.area.head()
[실행 결과]
0 2.453758e+07
1 3.383061e+07
2 3.946631e+07
3 4.685083e+07
4 2.954112e+07
dtype: float64length: 길이 계산- polygon의 length는 테두리의 길이(둘레)
# length
seoul_area.geometry.length.head()
[실행 결과]
0 24029.227412
1 30532.219899
2 35504.681042
3 43978.564653
4 27448.698426
dtype: float64boundary: 테두리(LineString 객체)- boundary는 polygon 객체의 테두리로 Linestring 객체를 반환함
# boundary
seoul_area.geometry[0].boundary
-
exterior: 테두리(LinearRing객체) -
centroid: 무게중심점- 다각형의 무게중심점
# centroid
seoul_area.geometry.centroid.head()
[실행 결과]
0 POINT (968820.2949617257 1950182.073942499)
1 POINT (965998.687667006 1945219.460300438)
2 POINT (961369.9946055702 1944245.952319755)
3 POINT (958548.9290023139 1941666.567629602)
4 POINT (950951.5822470621 1941050.9467013)
dtype: objectxy: 좌표 반환(array, tuple 객체)coords: 좌표 반환(shapely.coords객체)- xy와 coords는 사실 shaply의 공간 객체인 Point와 LineString의 속성이기 때문에 GeoDataFrame과 GeoSeries에 바로 적용할 수 없음
- Polygon의 좌표를 뽑기 위해선 boundary로 Line객체를 만들고 속성을 뽑아야 함
# xy와 coords
print(pt_119['geometry'][0].xy)
print(pt_119['geometry'][0].coords)
print(list(pt_119['geometry'][0].coords))
[실행 결과]
(array('d', [944285.7077635808]), array('d', [1947726.3905374545]))
<shapely.coords.CoordinateSequence object at 0x000002EDD9292BC8>
[(944285.7077635808, 1947726.3905374545)]is_valid: 도형 유효성 검사(boolean)- 도형이 유효한지를 검사할 때 사용
- 공간 데이터는 좌표나 제작 출처에 따라서 조금씩 모양이 다르기도 하고, 삐져나오거나 마감처리가 잘 안되어 있거나 한 경우가 있는데 처리하지 않으면 에러가 남
- 도형이 유효한지를 검사할 때 사용
# is_valid
seoul_area.geometry.is_valid.head()
[실행 결과]
0 True
1 False
2 True
3 True
4 True
dtype: boolgeom_type: 공간 객체 타입
공간 관계
within: 포함되는지 여부contain: 포함하고 있는지 여부- within과 contains는 어법이 반대인 것만 빼면 같은 함수라 할 수 있고 같은 결과를 반환함
- 같은 함수인데 왜 이렇게 만들어 뒀냐면, 두 함수 모두 1:1 또는 N:1관계만 입력 가능하고 1:N은 입력이 불가능하기 때문
- 경우에 따라 두 함수 모두 필요할 때가 있다!
- 서울시 119안전센터(N) 중, 강동구(1)에 포함되는 곳은? : within
- 서울시 시군구(N) 중, 고덕안전센터(1)를 포함하는 곳은? : contains
# within & contains

# 고덕119안전센터는 강동구 안에 있다.
print(pt_119.geometry[17].within(seoul_area.geometry[0]))

# 강동구 안에는 고덕119안전센터가 있다.
print(seoul_area.geometry[0].contains(pt_119.geometry[17]))
[실행 결과]
True
Trueintersects: 교차하는지 여부(경계에 닿아 있기만 해도 됨)crosses: 교차하는지 여부(내부를 지나가야 함)
# intersects & crosses

# 강동구와 송파구는 맞닿아 있다.
print(seoul_area.geometry[1].intersects(seoul_area.geometry[1]))

# 하지만 cross 되지는 않는다.
print(seoul_area.geometry[1].crosses(seoul_area.geometry[1]))
[실행 결과]
True
False# 서울시 양천구 내의 소방안전센터 정보를 인덱싱
yangcheon_ = seoul_area.loc[seoul_area['SGG_NM']=="양천구",'geometry'].iloc[0]
select_pt = pt_119[pt_119.within(yangcheon_)] #양천구 안에 위치한 소방안전센터 booleandistance: 두 공간 사이의 직선(최단)거리를 계산- 점과 다각형, 라인 등 두 공간 사이의 직선거리를 계산
# distance
dist = select_pt['geometry'].loc[0].distance(select_pt['geometry'].loc[101])
print("약 %s m" % round(dist))
[실행 결과]
약 4092 m공간 연산 및 변형
https://yganalyst.github.io/spatial_analysis/spatial_analysis_2/
https://blog.naver.com/rackhunson/222404841993
https://compas.lh.or.kr/gisinfo?pageIndex=1&pageSize=10&searchText=&searchKey=both&totalCount=20&brdArtclNo=523
https://compas.lh.or.kr/study?brdTypeCd=21&pageIndex=1&pageSize=10&searchText=&searchKey=both
https://blog.naver.com/rackhunson/222404841993
https://velog.io/@tett_77/kaggle-GeoPandas%EC%99%80-Geometry
https://rightstone032.tistory.com/11