[인공지능사관학교: 자연어분석A반] 학습 내용 보충 - plt.subplot()과 plt.subplots() 비교
Matplotlib 기본 개념
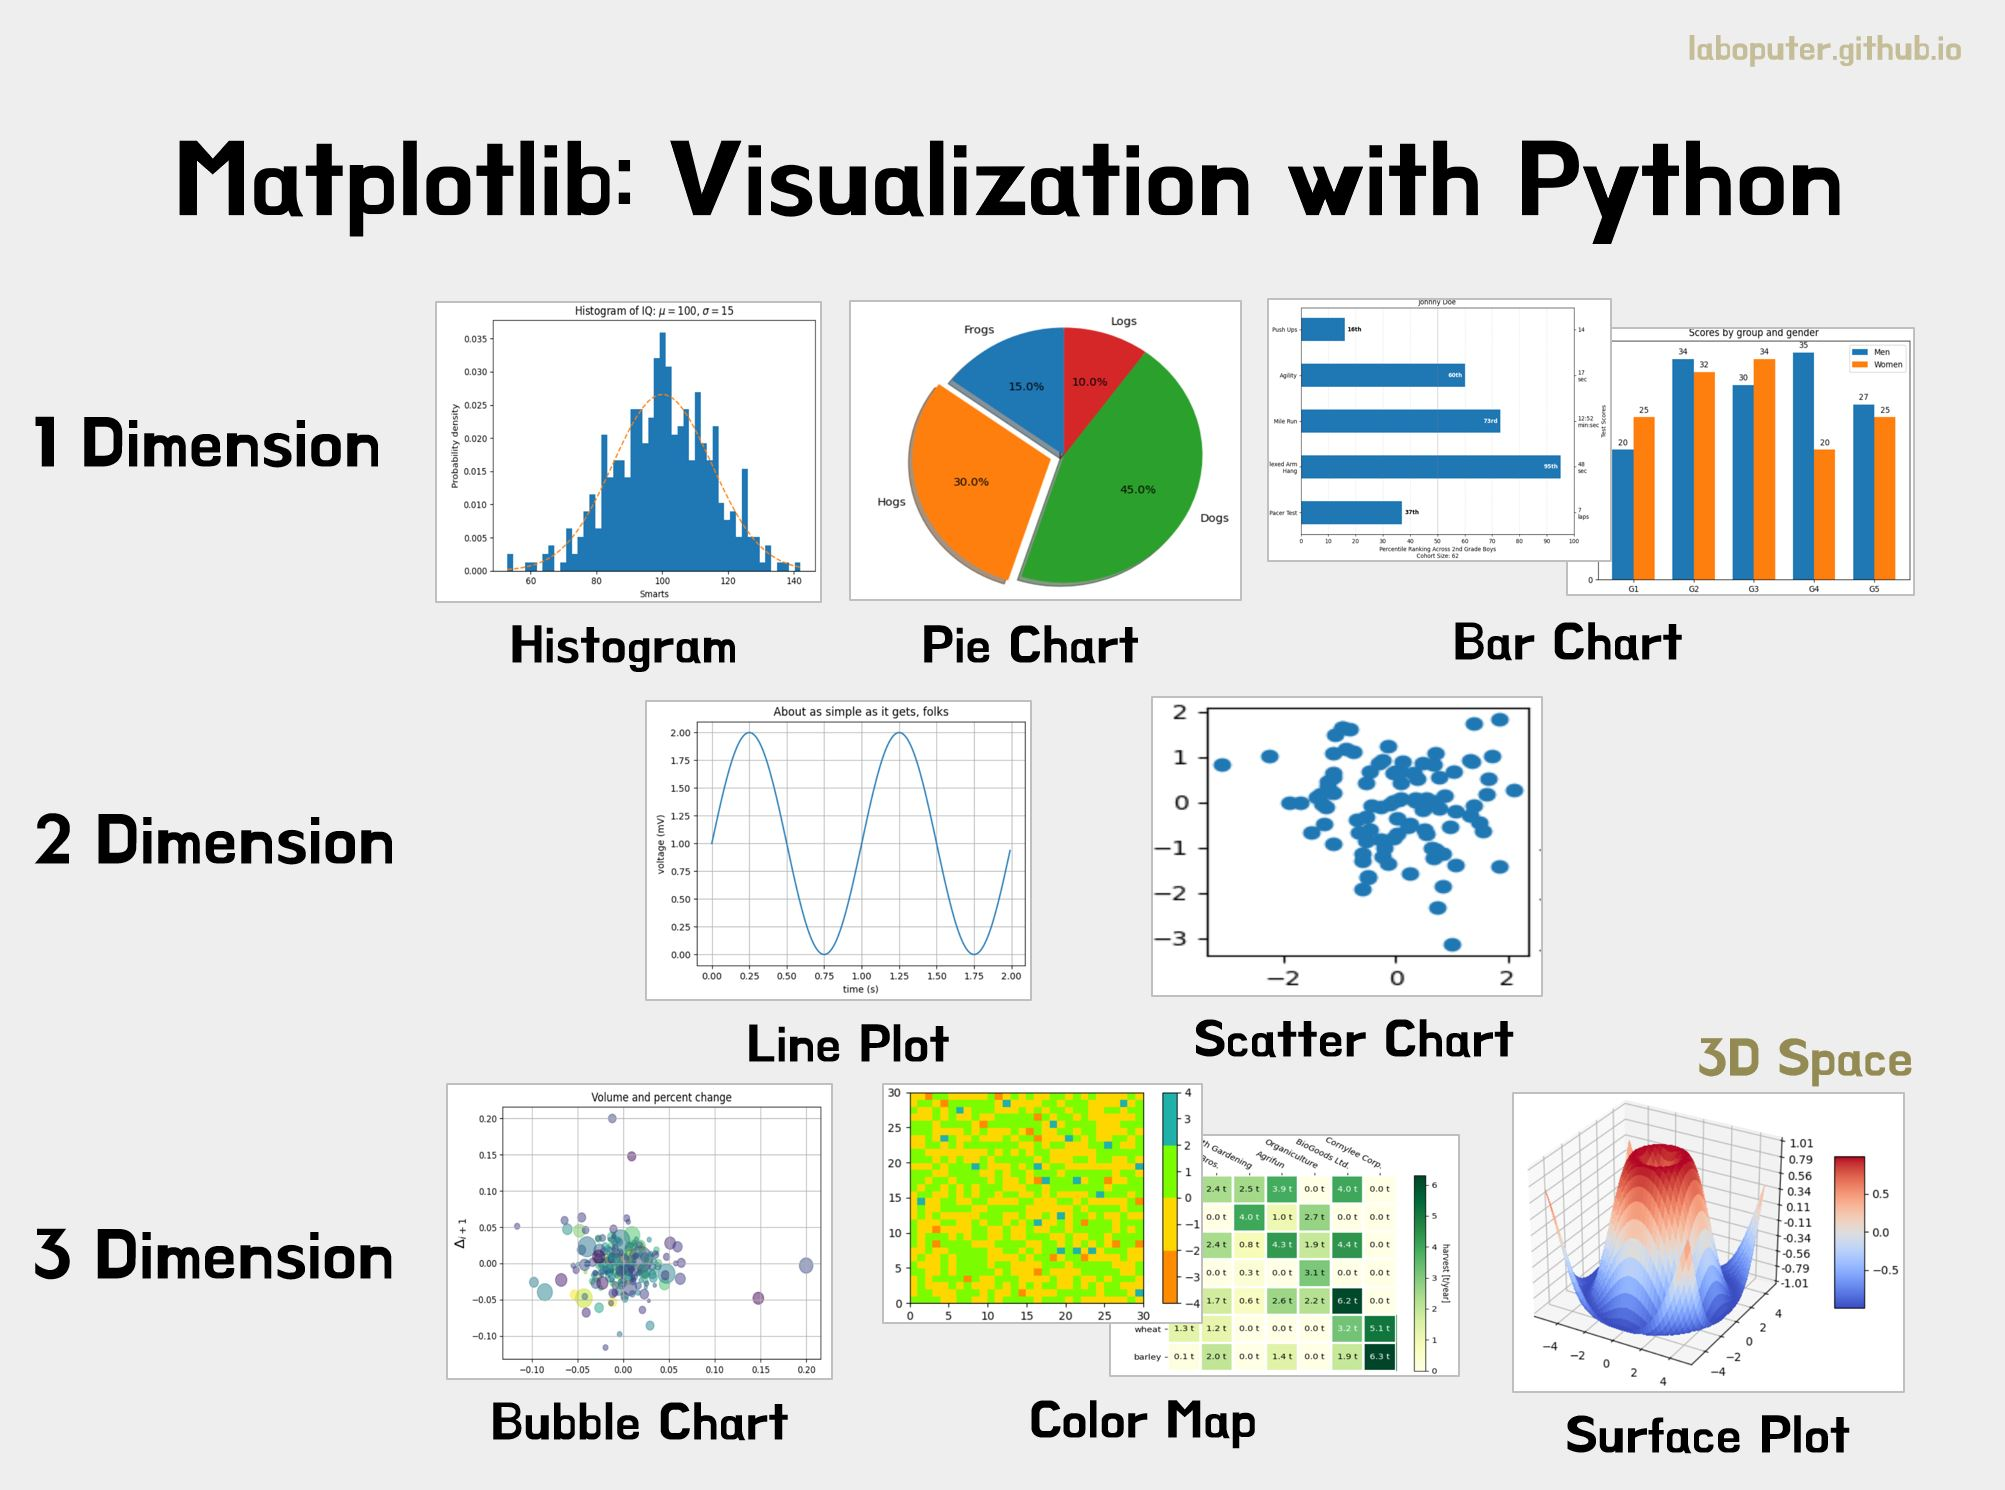
- Matplotlib(portmanteau of MATLAB, plot, and library)은 그래프를 그리기 위해 파이썬에서 가장 많이 사용하는 플로팅 라이브러리(plotting library)
- 플롯(Plot)
- 플롯한다(Plotting)라는 의미는 그래픽으로 렌더링하여 화면으로 출력하기 전 데이터를 가상의 공간에 미리 그려놓는 것을 의미
- 실제로 차트를 그리는 것이 아니라 내부적으로 그릴 준비를 한다
- 최종적으로
plt.show()를 해야 차트가 시각화되어 보이게 됨- Jupyter Notbook 같은 인터랙티브 컴퓨팅 플랫폼에서 대화형 플로팅(interactive plotting)을 할 경우
plt.show()없이도 차트가 줄력됨
- Jupyter Notbook 같은 인터랙티브 컴퓨팅 플랫폼에서 대화형 플로팅(interactive plotting)을 할 경우
State-Based와 Object-oriented의 차이
- Matplotlib에는 두 가지 프로그래밍 방법이 존재
- 즉, 두 가지 인터페이스(interface)가 존재하고 각 인터페이스마다 서로 다른 프로그래밍 규칙(문법)을 가지고 있음
| State-based | Object-oriented |
|---|---|
| >> plt.figure() | >> fig, ax = plt.subplots() |
| >> plt.plot(x,y) | >> ax.plot(x,y) |
- 파이썬은 기본적으로 Object-oriented 프로그래밍 언어이지만, Matplotlib의 개발 목적이 MATLAB의 plotting 기능을 파이썬에 구현하는 것이었기 때문에 Object-oriented뿐만 아니라 MATLAB의 State-based 언어 특성도 함께 가지게 되었음
- State-based approach
plt.{method}형식의 문법으로 그래프를 그림- plt 메서드를 사용
- Object-oriented approach
ax.{메서드}의 형식으로 그래프를 그림- 각 축의 Axes 메서드를 활용
- State-based approach
예시
import numpy as np
import matplotlib.pyplot as plt

# data
data1, data2, data3 = np.random.randn(3, 20)
State-based
fig = plt.figure(figsize=(14,12))<Figure size 1400x1200 with 0 Axes>fig = plt.figure(figsize=(14,12))
plt.subplot(1,2,1) # plt.subplot(121)
plt.scatter(data1,data2)<matplotlib.collections.PathCollection at 0x7fe8bcf3d110>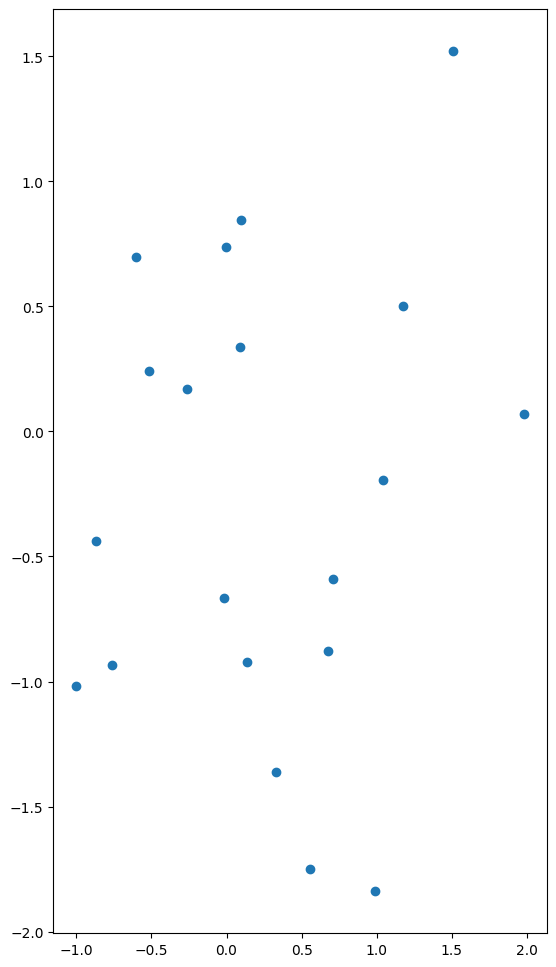
fig = plt.figure(figsize=(14,12))
plt.subplot(1,2,1) # plt.subplot(121)
plt.scatter(data1,data2)
plt.subplot(1,2,2) # plt.subplot(122)
plt.plot(data3,'r')[<matplotlib.lines.Line2D at 0x7fe8bc148890>]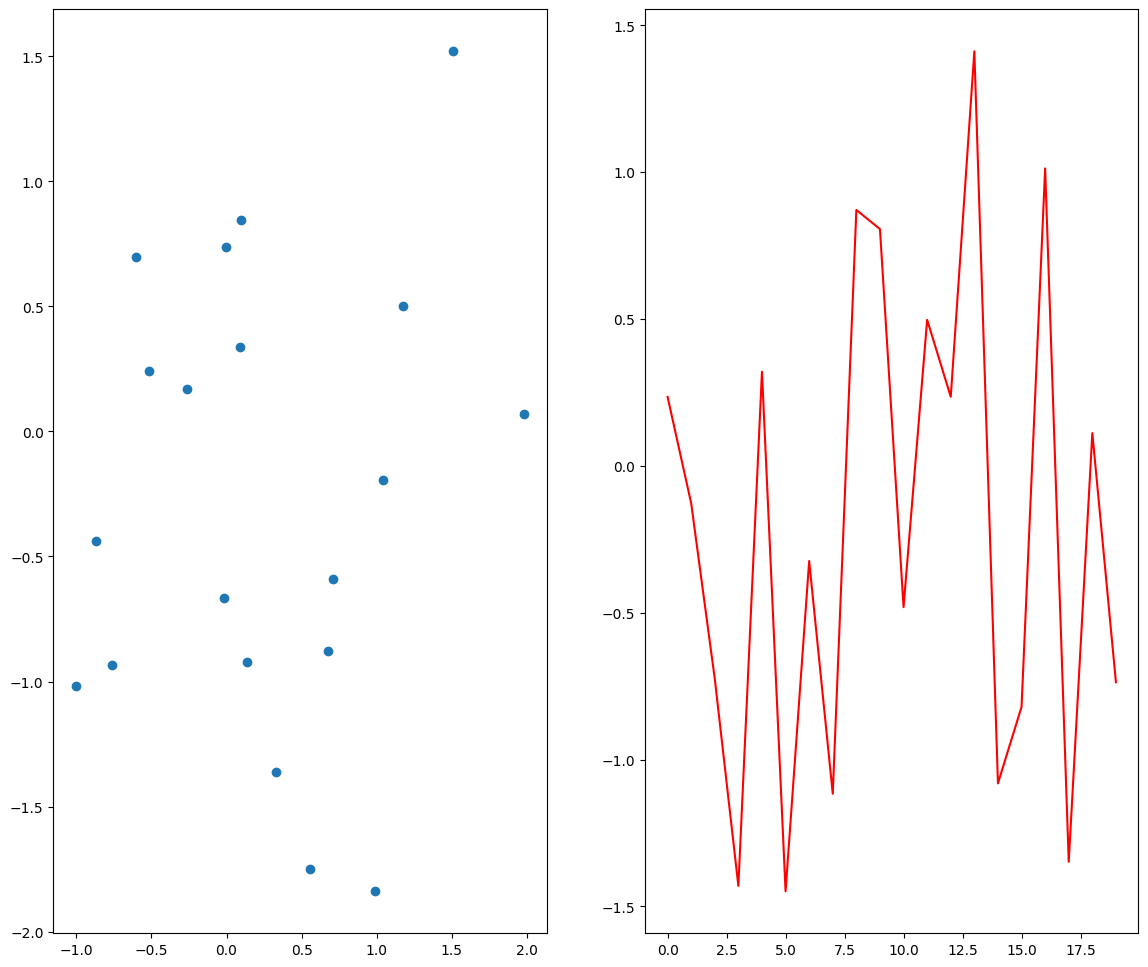
fig = plt.figure(figsize=(14,12))
plt.subplot(1,2,1) # plt.subplot(121)
plt.scatter(data1,data2)
plt.subplot(1,2,2) # plt.subplot(122)
plt.plot(data3,'r')
plt.xlabel("X_axis")
plt.ylabel("Y_axis")
plt.show()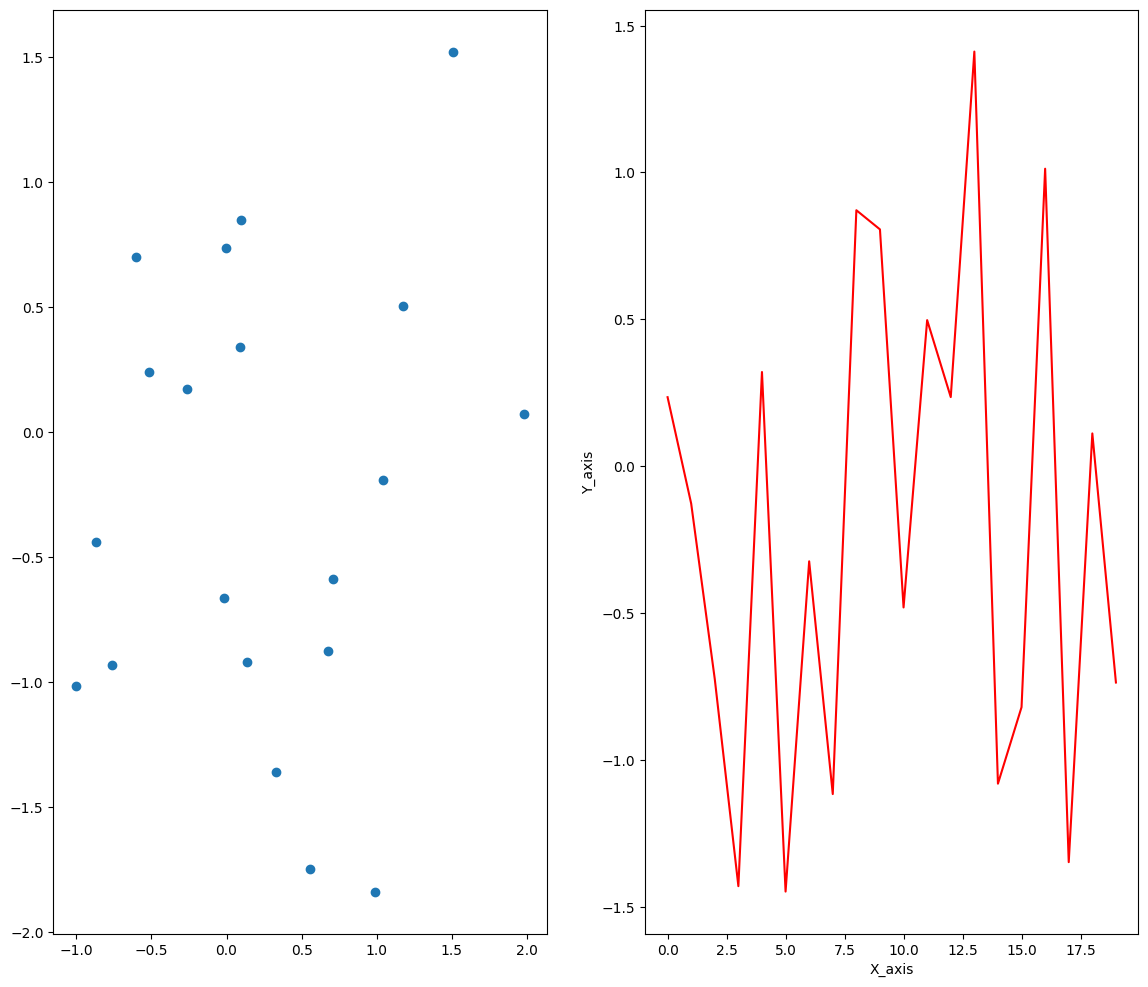
Object-oriented
fig, (ax1, ax2) = plt.subplots(1,2,figsize=(14,12))
fig, (ax1, ax2) = plt.subplots(1,2,figsize=(14,12))
ax1.scatter(data1, data2)<matplotlib.collections.PathCollection at 0x7fe8bc1f5110>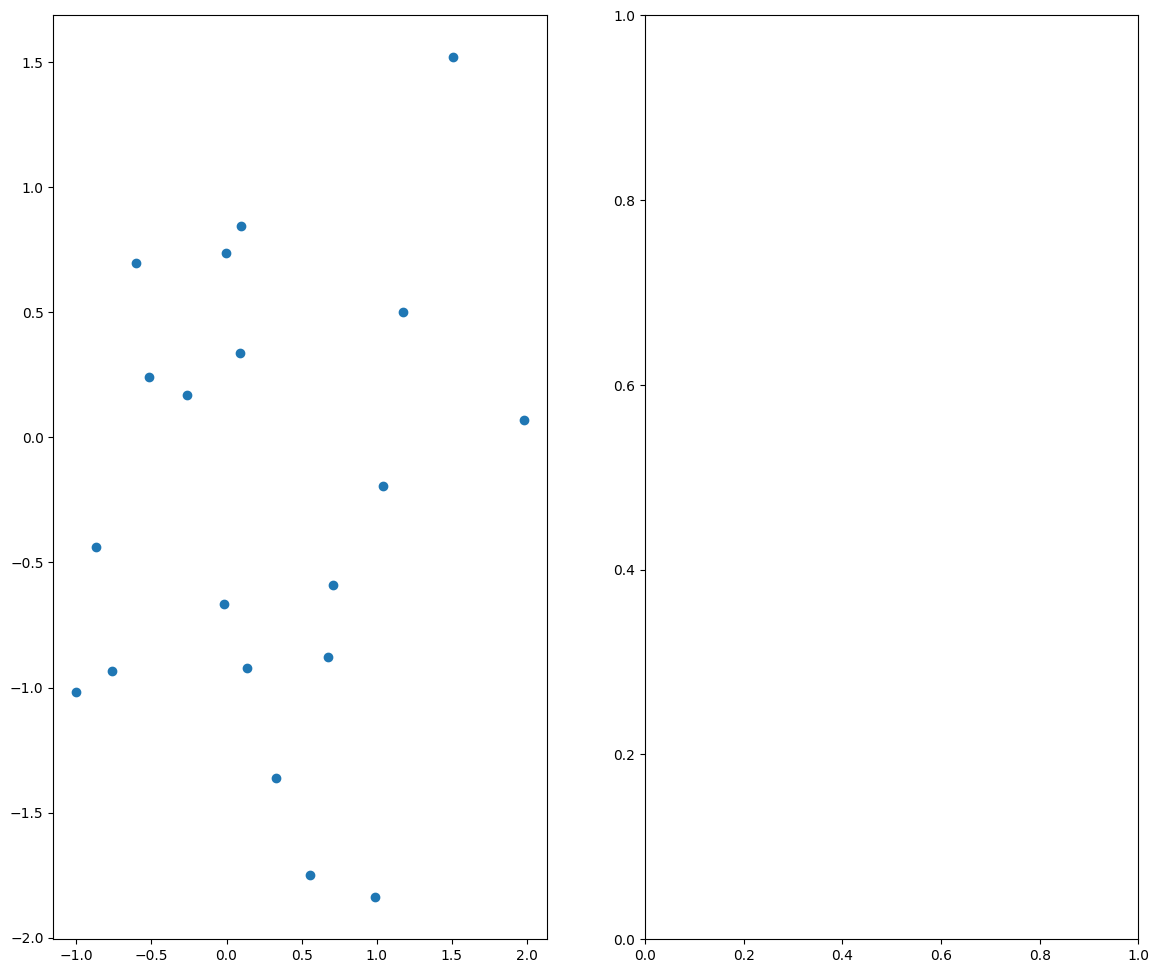
fig, (ax1, ax2) = plt.subplots(1,2,figsize=(14,12))
ax1.scatter(data1, data2)
ax2.plot(data3,'r')[<matplotlib.lines.Line2D at 0x7fe8a86d7bd0>]
fig, (ax1, ax2) = plt.subplots(1,2,figsize=(14,12))
ax1.scatter(data1, data2)
ax2.plot(data3,'r')
ax1.set_xlabel("Axes 1-X_axis")
ax1.set_ylabel("Axes 1-Y_axis")
ax2.set_xlabel("Axes 2-X_axis")
ax2.set_ylabel("Axes 2-Y_axis")
plt.show()
- Object-oriented 방법으로 생성한 그림에는 두 Axes 모두 Axis-Label이 있지만 State-based 방법으로 생성한 그림에는 우측 Axis에만 Axis-Label이 존재
- 이는 State-based 방법으로는 최근에 생성한 subplot만 그래프의 설정을 변경할 수 있기 때문
- 즉, plt 함수의 메서드는 언제나 현재의 subplot에만 적용할 수 있고 과거의 subplot은 설정을 변경하기 어려움
- plt.figure()로 시작하는 경우에도 axes 객체를 생성하고 변수를 지정해주면 Object-oriented 방식으로 그래프 수정 가능
fig = plt.figure(figsize=(14,12))
ax1 = plt.subplot(1,2,1) # plt.subplot(121)
ax1.scatter(data1,data2)
ax2 = plt.subplot(1,2,2) # plt.subplot(122)
ax2.plot(data3,'r')
ax1.set_xlabel("Axes 1-X_axis")
ax1.set_ylabel("Axes 1-Y_axis")
ax2.set_xlabel("Axes 2-X_axis")
ax2.set_ylabel("Axes 2-Y_axis")
plt.show()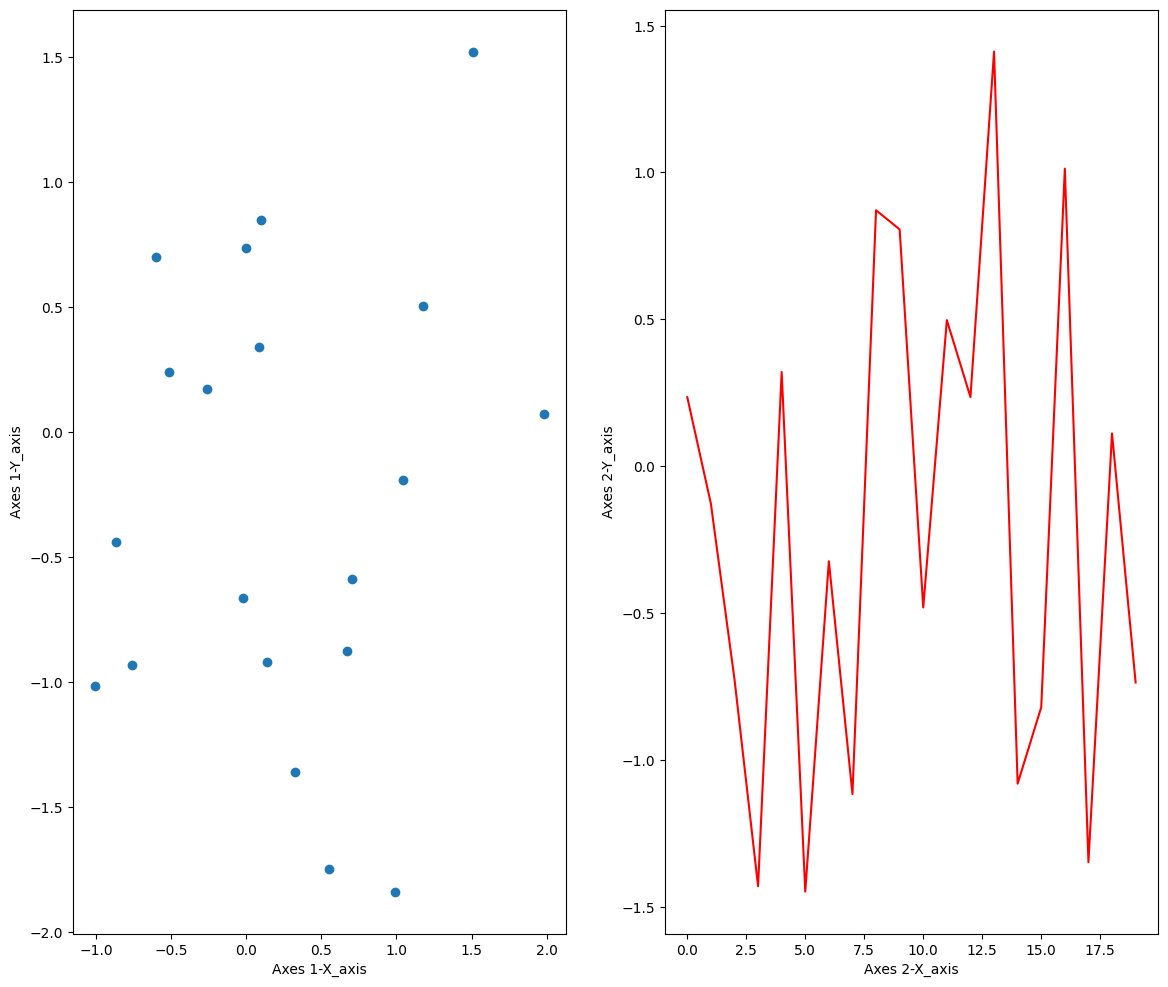
- Matplotlib 홈페이지의 튜토리얼에 따르면 대화형 플로팅(interactive plotting)에서는 State-based(=the (restrict) pyplot style)를, 규모가 큰 프로젝트에 쓰이는 비대화형 플로팅(non-interactive plotting)에는 Object-oriented 방식을 추천한다고 함
- interacitve plotting → e.g., in a Jupyers nootbook
- non-interactive plotting(in functions and scripts that are intended to be reused as part of a lager project)
Matplotlib Quick start guide
Matplotlib's documentation and examples use both the OO and the pyplot styles. In general, we suggest using the OO style, particularly for complicated plots, and functions and scripts that are intended to be reused as part of a larger project. However, the pyplot style can be very convenient for quick interactive work.
Matplotlib Figure 구성 요소
- matplotlib.figure.Figure (the top level container for all elements)
- Matplotlib Figure: plot에서 사용되는 모든 구성 요소를 담는 최상위 객체(=인스턴스, 턴테이너)
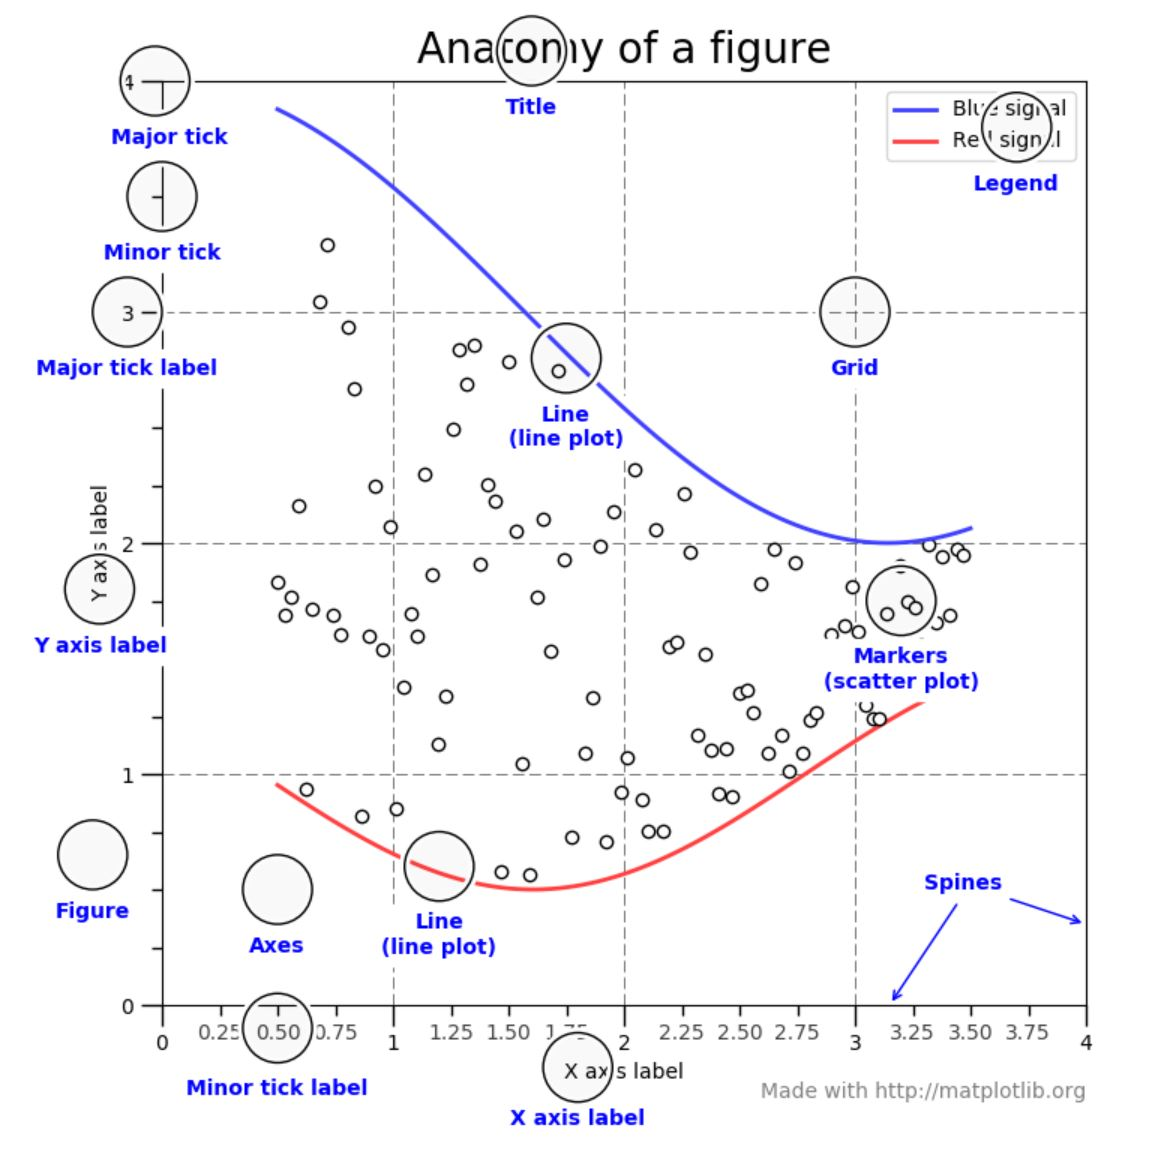
- Figure
- 최상위 객체
- 1개 이상의 Axes 포함
- Axes
- 실질적으로 그래프가 그려지는 영역
- 2개 이상의 Axis 객체 포함
- 2개면 2차원, 3개면 3차원 그래프
- axes.set_xlim(), axes.set_ylim(), axes.set_title(), axes.set_xlabel() 등
- Axis
- 그래프 임계치, 축의 데이터 표현 간격(Tick) 설정

2 B R 0 2 B