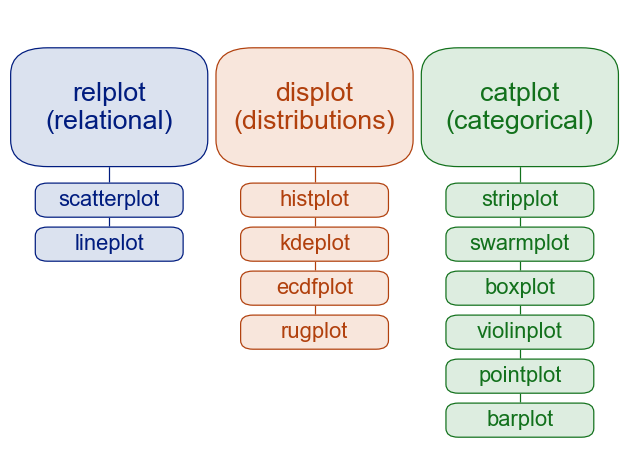

Relational plots (관계형)
relplot
- Figure-level interface for drawing relational plots onto a FacetGrid.
- 사용법
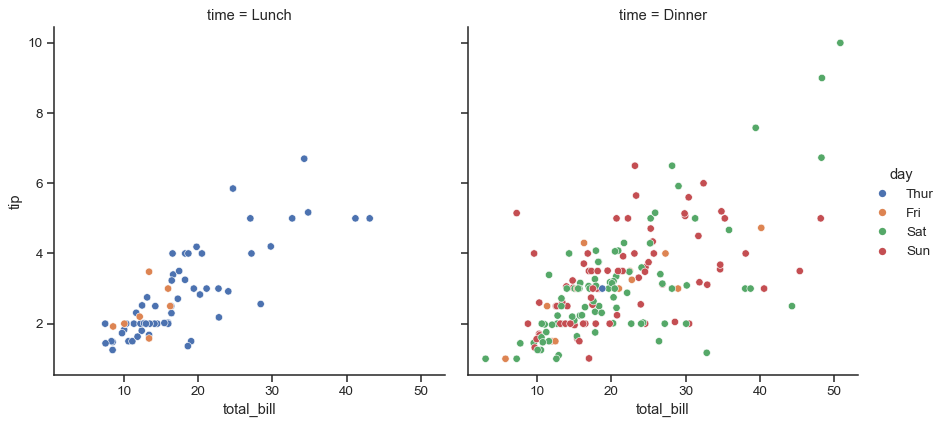
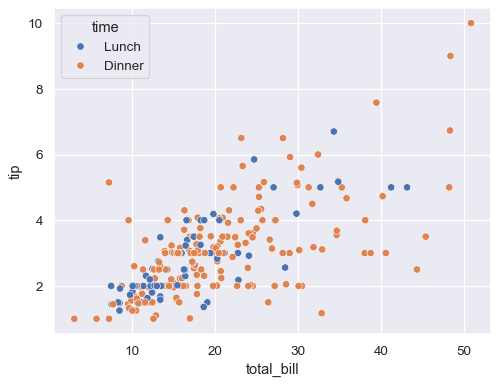
scatterplot
- Draw a scatter plot with possibility of several semantic groupings.
- 사용법
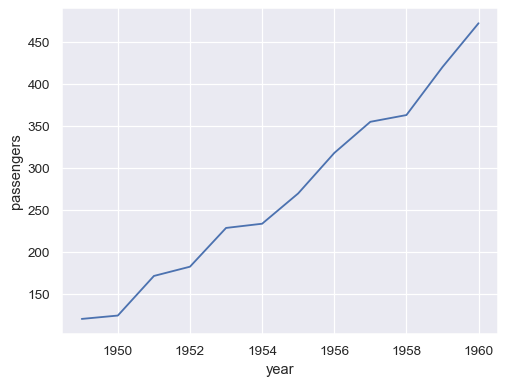
lineplot
- Draw a line plot with possibility of several semantic groupings.
- 사용법
Distribution plots (분포도)
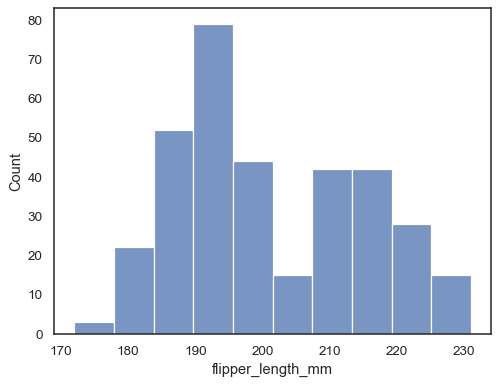
displot
- Figure-level interface for drawing distribution plots onto a FacetGrid.
- 사용법
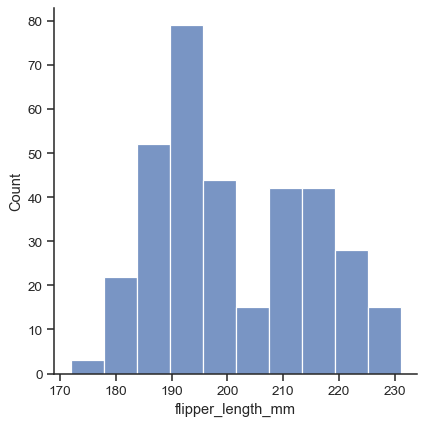
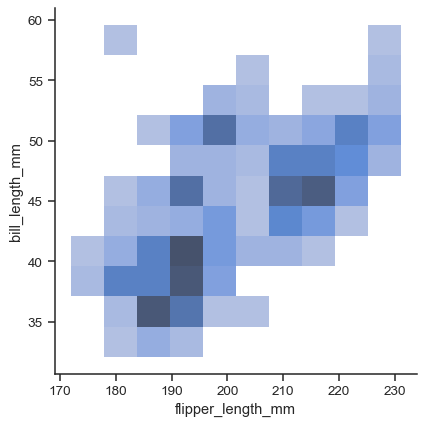
histplot
- Plot univariate or bivariate histograms to show distributions of datasets.
- 사용법
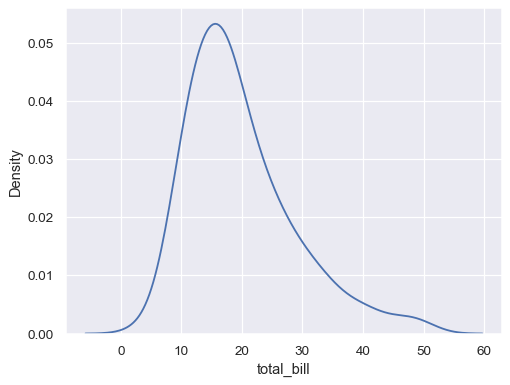
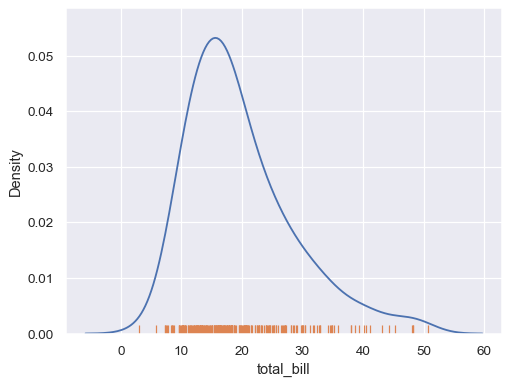
kdeplot
- Plot univariate or bivariate distributions using kernel density estimation.
- 사용법
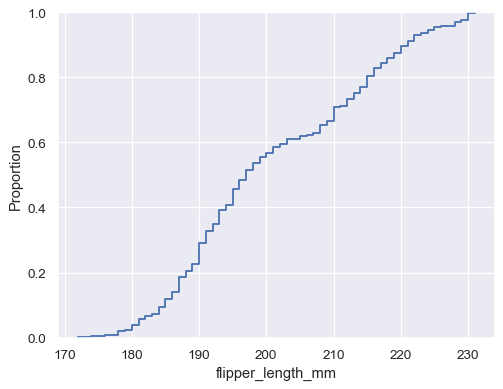
ecdfplot
- Plot empirical cumulative distribution functions.
- 사용법
rugplot
- Plot marginal distributions by drawing ticks along the x and y axes.
- 사용법
distplot
- DEPRECATED: Flexibly plot a univariate distribution of observations.
- 사용법

Categorical plots (범주형)
catplot
- Figure-level interface for drawing categorical plots onto a FacetGrid.
- 사용법

stripplot
- Draw a scatterplot where one variable is categorical.
- 사용법

swarmplot
- Draw a categorical scatterplot with non-overlapping points.
- 사용법

boxplot
- Draw a box plot to show distributions with respect to categories.
- 사용법

violinplot
- Draw a combination of boxplot and kernel density estimate.
- 사용법

boxenplot
- Draw an enhanced box plot for larger datasets.
- 사용법

pointplot
- Show point estimates and confidence intervals using scatter plot glyphs.
- 사용법

barplot
- Show point estimates and confidence intervals as rectangular bars.
- 사용법

countplot
- Show the counts of observations in each categorical bin using bars.
- 사용법

Regression plots (회귀)
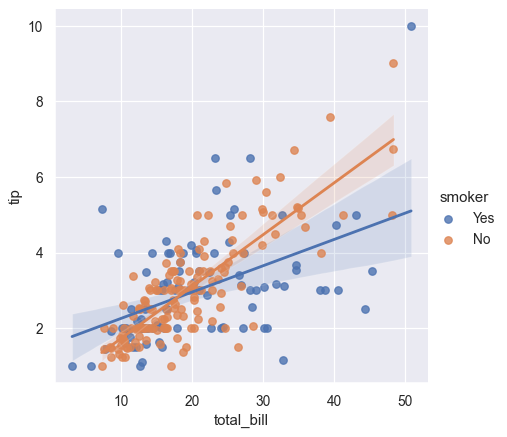
lmplot
- Plot data and regression model fits across a FacetGrid.
- 사용법
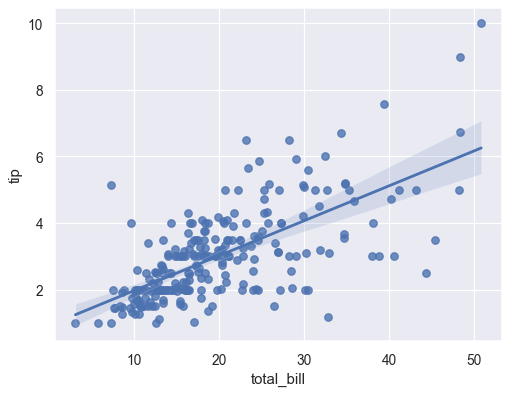
regplot
- Plot data and a linear regression model fit.
- 사용법
residplot
- Plot the residuals of a linear regression.
- 사용법

Here Today, Gone Tomorrow