TIL 3/12 과제
##1. 숫자 맞추기 게임
- 플레이어와 컴퓨터가 참여하는 숫자 맞추기 게임을 만드세요.
- 프로그램은 다음과 같은 기능을 포함해야 합니다.
- 컴퓨터는 1부터 10 사이의 랜덤한 숫자를 생성합니다.
- 플레이어는 숫자를 입력하고, 입력한 숫자가 큰지 작은지 힌트를 얻습니다.
- 플레이어가 숫자를 맞힐 때까지 위 과정을 반복합니다.
Random, randint, while 항, if하고 elif항의 사용도를 물어보는 질문
The randint() method returns an integer number selected element from the specified range.
In this case, the specified range is between 1 and 10.
=> random.randint(1,10)
import random
integer=random.randint(1,10)
print(integer)
while True:
guess=int(input("Guess a random number between 0 and 10."))
if guess>integer:
print("Too big, guess another number")
elif guess<integer:
print("Too small, guess another number")
elif integer==guess:
print("Correct answer")
break
I should know the notations better, such as: ==, =!
- 클래스와 함수 사용하기
이름, 성별, 나이를 입력받고, 이를 출력하는 프로그램을 작성해주세요.
This exercise can be solved in two ways:
user_name = input("Write your name")
user_gender = input("male or female")
user_age = int(input("age"))
print(user_name)
print(user_gender)
print(user_age)
If I solve the exercise in this way, I should use input to put the value in
There is a more complex way of solving this problem.
In python the constructor method is init(), and is written as:
def init(self, object_parameters...):
# Initialize the object 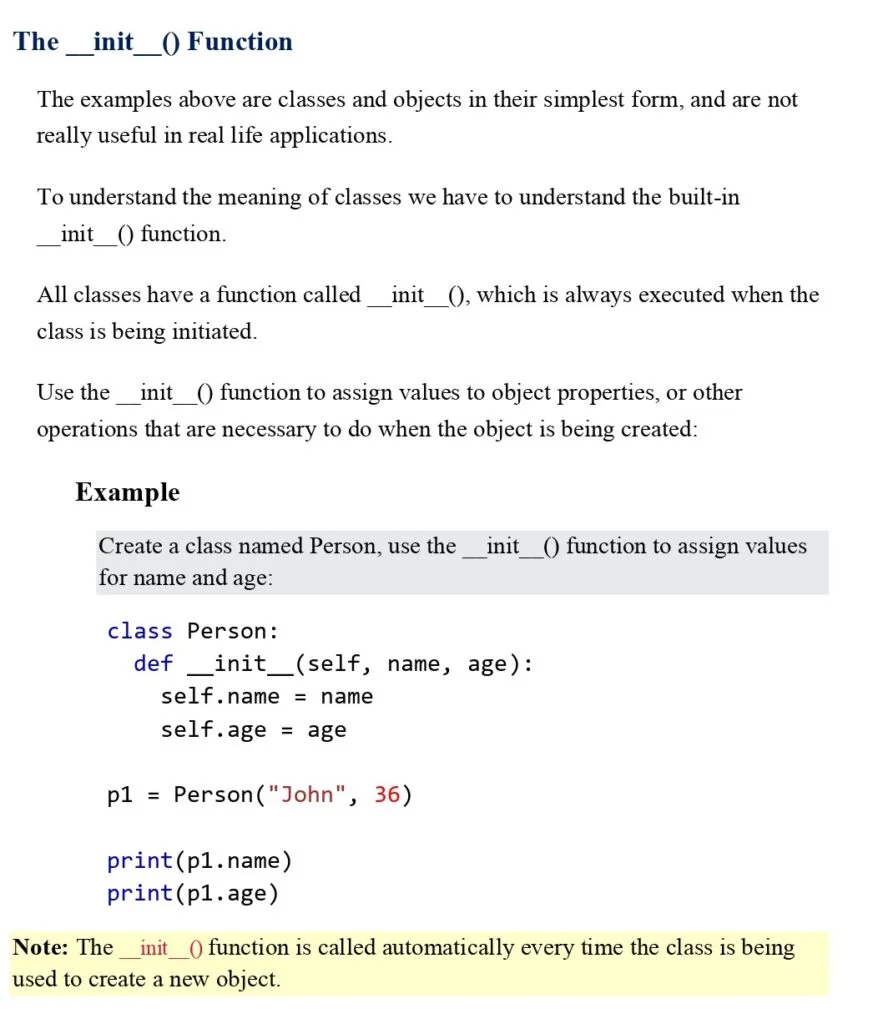
class Person:
def init(self, name="", gender="", age=""):
self.name = name
self.gender = gender
self.age = age
def display(self):
print(f"이름: {self.name}, 성별: {self.gender}")
print(f"나이: {self.age}")
def user_input(self):
self.name = input("name")
self.gender = input("gender")
self.age = int(input("age"))
def main():
person = Person()
person.user_input()
person.display()
main()
-
Python 라이브러리를 활용하여 주어진 데이터(.xlxs)를 분석 Quiz를 수행해주세요
-
다운로드 한 데이터 파일(.xlxs)을 열고 어떤 데이터인지 먼저 파악합니다.
-
과제 수행에 필요한 Python 라이브러리를 불러옵니다.
-
Quiz를 수행합니다.
Quiz questions:
- Python 라이브러리 함수를 사용하여 엑셀 파일을 불러오고, DataFrame을 출력해주세요.
For pandas, we usually import pandas with the pd alias, which means we refer to pandas as pd in the code instead of writing “pandas” each time.
A DataFrame is a data structure that organizes data into a 2-dimensional table of rows and columns, much like a spreadsheet.
The pandas.read_excel() function lets you read any Excel file into a Pandas DataFrame object.
import pandas as pd
df = pd.read_excel("/관서별 5대범죄 발생 및 검거.xlsx")
df = pd.read_csv("/pop_kor.csv")
print(df)
- 각 경찰서(
관서명)를 해당 구 이름으로 매핑하여 '구별'이라는 새로운 column을 생성하고, DataFrame을 출력해주세요.- 매칭되지 않는 경찰서명에 대해서는 기본값
'구 없음'을 할당합니다.
- 매칭되지 않는 경찰서명에 대해서는 기본값
import pandas as pd
import the dictionary
district_map = {'서대문서': '서대문구', '수서서': '강남구', '강서서': '강서구', '서초서': '서초구',
'서부서': '은평구', '중부서': '중구', '종로서': '종로구', '남대문서': '중구',
'혜화서': '종로구', '용산서': '용산구', '성북서': '성북구', '동대문서': '동대문구',
'마포서': '마포구', '영등포서': '영등포구', '성동서': '성동구', '동작서': '동작구',
'광진서': '광진구', '강북서': '강북구', '금천서': '금천구', '중랑서': '중랑구',
'강남서': '강남구', '관악서': '관악구', '강동서': '강동구', '종암서': '성북구',
'구로서': '구로구', '양천서': '양천구', '송파서': '송파구', '노원서': '노원구',
'방배서': '서초구', '은평서': '은평구', '도봉서': '도봉구'}
To convert a nested dictionary to a Pandas DataFrame:
Use the DataFrame.from_dict() method.
Set the orient keyword argument to index.
When the orient argument is set to index, the keys of the dict will be rows.
ex: import pandas as pd
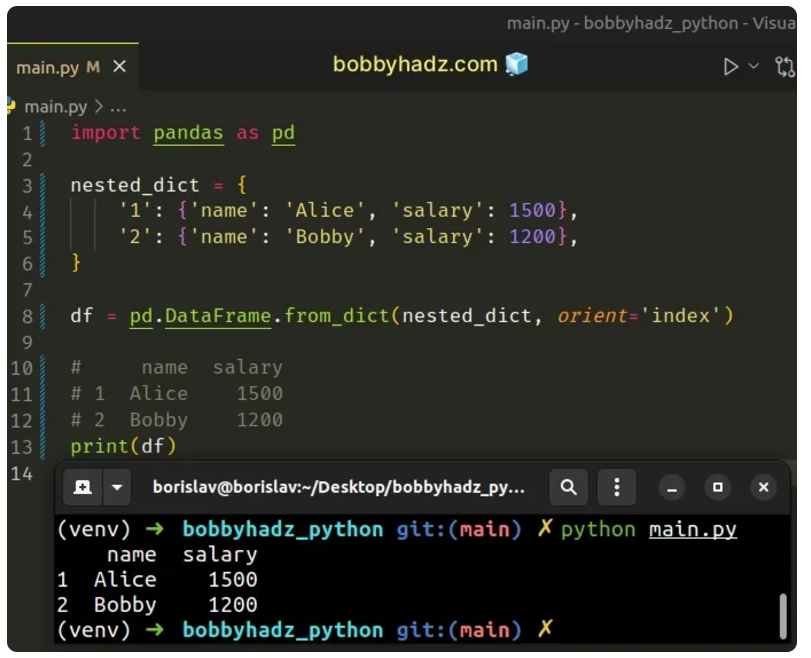
df = pd.DataFrame.from_dict(district_map, orient='index', columns=['구'])
df['관서명'] = df.index
def station_to_district(station):
# If the station is not found, return '구 없음'
return district_map.get(station, '구 없음')
df['구'] = df['관서명'].map(station_to_district).fillna('구 없음')
df = df[['구', '관서명']]
print(df)
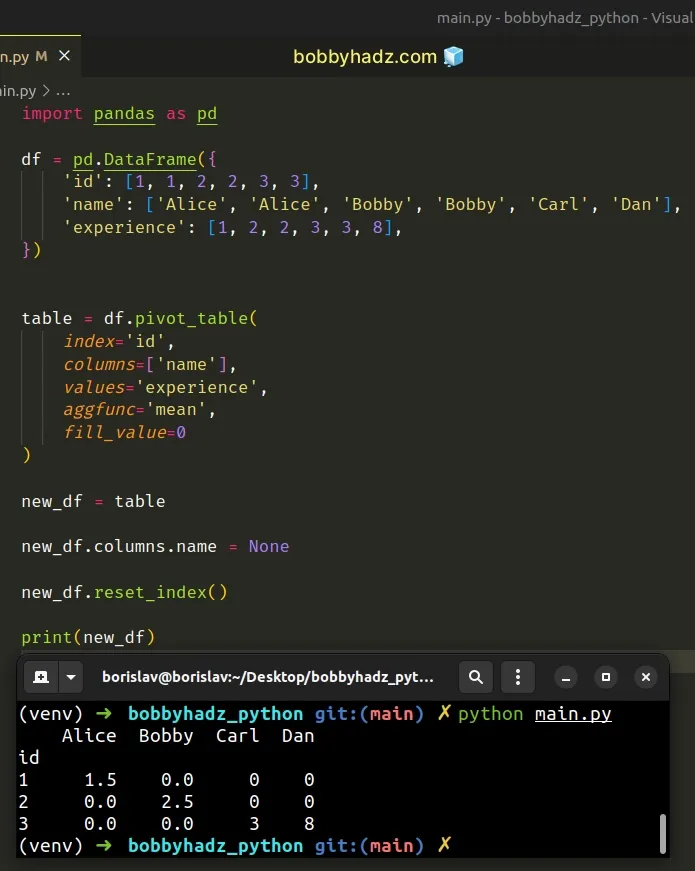
- pivot_table 을 사용하여 관서별 데이터를 구별 데이터로 변경하고, 같은 구의 경우에는 sum을 적용하여 더해주세요. (index : 관서명 -> 구별)
To convert a pivot table to a DataFrame in Pandas:
Set the columns.name property to None to remove the column name.
Use the reset_index() method to convert the index to columns.
import pandas as pd
excel_file= "/관서별 5대범죄 발생 및 검거.xlsx"
df= pd.read_excel("/관서별 5대범죄 발생 및 검거.xlsx")
district_map = {'서대문서': '서대문구', '수서서': '강남구', '강서서': '강서구', '서초서': '서초구',
'서부서': '은평구', '중부서': '중구', '종로서': '종로구', '남대문서': '중구',
'혜화서': '종로구', '용산서': '용산구', '성북서': '성북구', '동대문서': '동대문구',
'마포서': '마포구', '영등포서': '영등포구', '성동서': '성동구', '동작서': '동작구',
'광진서': '광진구', '강북서': '강북구', '금천서': '금천구', '중랑서': '중랑구',
'강남서': '강남구', '관악서': '관악구', '강동서': '강동구', '종암서': '성북구',
'구로서': '구로구', '양천서': '양천구', '송파서': '송파구', '노원서': '노원구',
'방배서': '서초구', '은평서': '은평구', '도봉서': '도봉구'}
df['구'] = df['관서명'].map(district_map).fillna('구 없음')
#Using a pivot table
#Transform the data from being organized by police station (관서)
#to being organized by district (구).
#(index: change from police station name to district name)
#For data belonging to the same district, sum the values.
df_pivot = df.pivot_table(index='구', aggfunc='sum')
print(df_pivot)
- 구 없음 행은 drop 을 활용하여 삭제해주세요.
To drop the columns in a DataFrame whose name contains a given string:
Call the drop() method on the DataFrame.
Filter the columns by name using the regex parameter.
Drop the columns in place.
import pandas as pd
excel_file= "/관서별 5대범죄 발생 및 검거.xlsx"
df= pd.read_excel("/관서별 5대범죄 발생 및 검거.xlsx")
district_map = {'서대문서': '서대문구', '수서서': '강남구', '강서서': '강서구', '서초서': '서초구',
'서부서': '은평구', '중부서': '중구', '종로서': '종로구', '남대문서': '중구',
'혜화서': '종로구', '용산서': '용산구', '성북서': '성북구', '동대문서': '동대문구',
'마포서': '마포구', '영등포서': '영등포구', '성동서': '성동구', '동작서': '동작구',
'광진서': '광진구', '강북서': '강북구', '금천서': '금천구', '중랑서': '중랑구',
'강남서': '강남구', '관악서': '관악구', '강동서': '강동구', '종암서': '성북구',
'구로서': '구로구', '양천서': '양천구', '송파서': '송파구', '노원서': '노원구',
'방배서': '서초구', '은평서': '은평구', '도봉서': '도봉구'}
df['구'] = df['관서명'].map(district_map).fillna('구 없음')
df_pivot = df.pivot_table(index='구', aggfunc='sum')
df_pivot = df_pivot.drop('구 없음')
print(df_pivot)
- 각 범죄 별로 검거율을 계산하고, 각 검거율 데이터 column을 DataFrame에 추가해주세요.
excel_file= "/관서별 5대범죄 발생 및 검거.xlsx"
df= pd.read_excel("/관서별 5대범죄 발생 및 검거.xlsx")
district_map = {'서대문서': '서대문구', '수서서': '강남구', '강서서': '강서구', '서초서': '서초구',
'서부서': '은평구', '중부서': '중구', '종로서': '종로구', '남대문서': '중구',
'혜화서': '종로구', '용산서': '용산구', '성북서': '성북구', '동대문서': '동대문구',
'마포서': '마포구', '영등포서': '영등포구', '성동서': '성동구', '동작서': '동작구',
'광진서': '광진구', '강북서': '강북구', '금천서': '금천구', '중랑서': '중랑구',
'강남서': '강남구', '관악서': '관악구', '강동서': '강동구', '종암서': '성북구',
'구로서': '구로구', '양천서': '양천구', '송파서': '송파구', '노원서': '노원구',
'방배서': '서초구', '은평서': '은평구', '도봉서': '도봉구'}
df['구'] = df['관서명'].map(district_map).fillna('구 없음')
df_pivot = df.pivot_table(index='구', aggfunc='sum')
df_pivot = df_pivot.drop('구 없음')
# Calculating 검거율 (arrest rate) for each crime
#'검거율'=='검거'/'발생'
df_pivot['강간검거율'] = df_pivot[('강간(검거)')]/df_pivot[('강간(발생)')]
df_pivot['강도검거율'] = df_pivot[('강도(검거)')]/df_pivot[('강도(발생)')]
df_pivot['살인검거율'] = df_pivot[('살인(검거)')]/df_pivot[('살인(발생)')]
df_pivot['절도검거율'] = df_pivot[('절도(검거)')]/df_pivot[('절도(발생)')]
df_pivot['폭력검거율'] = df_pivot[('폭력(검거)')]/df_pivot[('폭력(발생)')]
print(df_pivot)
- 필요없는 column을 del 을 사용하여 삭제해주세요.
삭제해야할 column:
강간(검거),
강도(검거),
살인(검거),
절도(검거),
폭력(검거),
소계(발생),
소계(검거)
import pandas as pd
excel_file= "/관서별 5대범죄 발생 및 검거.xlsx"
df= pd.read_excel("/관서별 5대범죄 발생 및 검거.xlsx")
district_map = {'서대문서': '서대문구', '수서서': '강남구', '강서서': '강서구', '서초서': '서초구',
'서부서': '은평구', '중부서': '중구', '종로서': '종로구', '남대문서': '중구',
'혜화서': '종로구', '용산서': '용산구', '성북서': '성북구', '동대문서': '동대문구',
'마포서': '마포구', '영등포서': '영등포구', '성동서': '성동구', '동작서': '동작구',
'광진서': '광진구', '강북서': '강북구', '금천서': '금천구', '중랑서': '중랑구',
'강남서': '강남구', '관악서': '관악구', '강동서': '강동구', '종암서': '성북구',
'구로서': '구로구', '양천서': '양천구', '송파서': '송파구', '노원서': '노원구',
'방배서': '서초구', '은평서': '은평구', '도봉서': '도봉구'}
df['구'] = df['관서명'].map(district_map).fillna('구 없음')
df_pivot = df.pivot_table(index='구', aggfunc='sum')
df_pivot = df_pivot.drop('구 없음')
# Calculating 검거율 (arrest rate) for each crime
#'검거율'=='검거'/'발생'
df_pivot['강간검거율'] = df_pivot[('강간(검거)')]/df_pivot[('강간(발생)')]
df_pivot['강도검거율'] = df_pivot[('강도(검거)')]/df_pivot[('강도(발생)')]
df_pivot['살인검거율'] = df_pivot[('살인(검거)')]/df_pivot[('살인(발생)')]
df_pivot['절도검거율'] = df_pivot[('절도(검거)')]/df_pivot[('절도(발생)')]
df_pivot['폭력검거율'] = df_pivot[('폭력(검거)')]/df_pivot[('폭력(발생)')]
#Delete specific columns
df.drop(columns=['강간(검거)', '강도(검거)', '살인(검거)', '절도(검거)', '폭력(검거)', '소계(발생)', '소계(검거)'], axis=1)
print(df)
- DataFrame의 컬럼명을 rename 을 사용하여 변경해주세요.
변경해야할 column
'강간(발생)':'강간',
'강도(발생)':'강도',
'살인(발생)':'살인',
'절도(발생)':'절도',
'폭력(발생)':'폭력'
Use the df.rename() function and refer the columns to be renamed. Not all the columns have to be renamed:
df = df.rename(columns={'oldName1': 'newName1', 'oldName2': 'newName2'})
import pandas as pd
excel_file= "/관서별 5대범죄 발생 및 검거.xlsx"
df= pd.read_excel("/관서별 5대범죄 발생 및 검거.xlsx")
district_map = {'서대문서': '서대문구', '수서서': '강남구', '강서서': '강서구', '서초서': '서초구',
'서부서': '은평구', '중부서': '중구', '종로서': '종로구', '남대문서': '중구',
'혜화서': '종로구', '용산서': '용산구', '성북서': '성북구', '동대문서': '동대문구',
'마포서': '마포구', '영등포서': '영등포구', '성동서': '성동구', '동작서': '동작구',
'광진서': '광진구', '강북서': '강북구', '금천서': '금천구', '중랑서': '중랑구',
'강남서': '강남구', '관악서': '관악구', '강동서': '강동구', '종암서': '성북구',
'구로서': '구로구', '양천서': '양천구', '송파서': '송파구', '노원서': '노원구',
'방배서': '서초구', '은평서': '은평구', '도봉서': '도봉구'}
df['구'] = df['관서명'].map(district_map).fillna('구 없음')
df_pivot = df.pivot_table(index='구', aggfunc='sum')
df_pivot = df_pivot.drop('구 없음')
# Calculating 검거율 (arrest rate) for each crime
#'검거율'=='검거'/'발생'
df_pivot['강간검거율'] = df_pivot[('강간(검거)')]/df_pivot[('강간(발생)')]
df_pivot['강도검거율'] = df_pivot[('강도(검거)')]/df_pivot[('강도(발생)')]
df_pivot['살인검거율'] = df_pivot[('살인(검거)')]/df_pivot[('살인(발생)')]
df_pivot['절도검거율'] = df_pivot[('절도(검거)')]/df_pivot[('절도(발생)')]
df_pivot['폭력검거율'] = df_pivot[('폭력(검거)')]/df_pivot[('폭력(발생)')]
#Delete specific columns
df.drop(columns=['강간(검거)', '강도(검거)', '살인(검거)', '절도(검거)', '폭력(검거)', '소계(발생)', '소계(검거)'], axis=1)
df.rename(columns={'강간(발생)':'강간', '강도(발생)':'강도', '살인(발생)':'살인', '절도(발생)':'절도', '폭력(발생)':'폭력'}, inplace=True)
print(df)