PyGAD 알고리즘을 사용하여, 각 이미지의 픽셀값을 진화시켜 이미지를 재생성합니다. 진행순서는 다음과 같습니다.
- 이미지 로드
- Fitness function 정의
- pygad.GA class를 활용하여 인스턴스 생성
- PyGAD 실행
- Plot results 확인
- 통계 계산
1. 이미지 로드
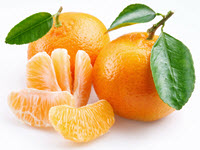
이번 예시에서는 fruit.jpg 이미지를 활용합니다.
import numpy
import imageio
import gari
import pygad
import matplotlib.pyplot
import imageio.v2 as imageio
염색체의 표현은 픽셀값으로, 0~255의 값으로 표현합니다.
# Reading target image to be reproduced using Genetic Algorithm (GA).
target_im = imageio.imread('fruit.jpg')
target_im = numpy.asarray(target_im/255, dtype=numpy.float64)
2. Fitness function 정의
Fitness function을 정의하기 전, gari.img2chromosome() 메소드를 사용해서 이미지를 벡터로 표현시킵니다.
그 후, 각 generation별 Fitness value를 계산하기 위해 Fitness function을 정의합니다. Fitness value는 원본 이미지의 염색체와 재생성되는 이미지의 염색체의 차의 합으로 정의입니다.
# Target image after enconding. Value encoding is used.
target_chromosome = gari.img2chromosome(target_im)

def fitness_fun(ga_instance,solution, solution_idx):
    """
    Calculating the fitness value for a solution in the population.
    The fitness value is calculated using the sum of absolute difference between genes values in the original and reproduced chromosomes.

    solution: Current solution in the population to calculate its fitness.
    solution_idx: Index of the solution within the population.
    """

    fitness = numpy.sum(numpy.abs(target_chromosome-solution)) # here is the fitness function; you can modify to see if the search can be improved

    # Negating the fitness value to make it increasing rather than decreasing.
    fitness = numpy.sum(target_chromosome) - fitness
    return fitness
last_fitness = 0
def on_generation(ga_instance):
global last_fitness
if (ga_instance.generations_completed % 50 ==0):
print("Generation = {generation}".format(generation=ga_instance.generations_completed))
print("Fitness = {fitness}".format(fitness=ga_instance.best_solution(pop_fitness=ga_instance.last_generation_fitness)[1]))
print("Change = {change}".format(change=ga_instance.best_solution(pop_fitness=ga_instance.last_generation_fitness)[1] - last_fitness))
last_fitness = ga_instance.best_solution(pop_fitness=ga_instance.last_generation_fitness)[1]
if ga_instance.generations_completed % 500 == 0:
matplotlib.pyplot.imsave('solution_'+str(ga_instance.generations_completed)+'.png', gari.chromosome2img(ga_instance.best_solution()[0], target_im.shape))3. pygad.GA class를 활용하여 인스턴스 생성
# The GA parameters are set
ga_instance = pygad.GA(num_generations=5000,
                       num_parents_mating=10,
                       fitness_func=fitness_fun,
                       sol_per_pop=20,
                       num_genes=target_im.size,
                       init_range_low=0.0,
                       init_range_high=1.0,

                       crossover_type="uniform",  # you could change with other crossover operations such as single_point, two_points, uniform, scattered
                       mutation_percent_genes=0.01,
                       mutation_type="random", # you could change with other mutation operations such as random, swap, inversion, scramble
                       mutation_by_replacement=True,
                       random_mutation_min_val=0.0,
                       random_mutation_max_val=1.0,
                       on_generation=on_generation,
#                        parallel_processing=["process", 5])
                       parallel_processing=5)
4. PyGAD 실행
ga_instance.run()5. Plot results 확인
ga_instance.plot_fitness()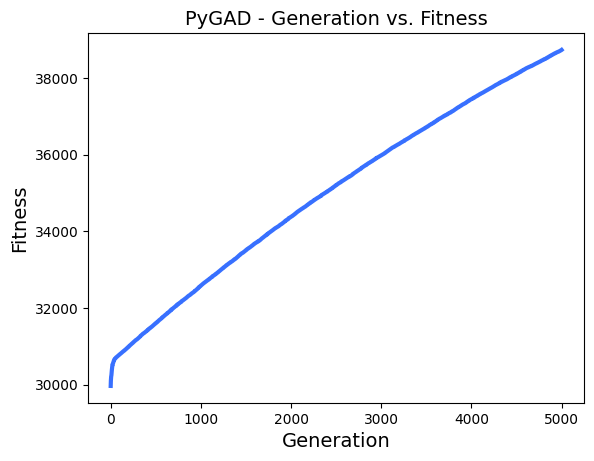
6. 통계 계산
최적의 솔루션에 대한 정보를 확인할 수 있습니다.
# Returning the details of the best solution.
solution, solution_fitness, solution_idx = ga_instance.best_solution()
print("Fitness value of the best solution = {solution_fitness}".format(solution_fitness=solution_fitness))
print("Index of the best solution : {solution_idx}".format(solution_idx=solution_idx))

if ga_instance.best_solution_generation != -1:
    print("Best fitness value reached after {best_solution_generation} generations.".format(best_solution_generation=ga_instance.best_solution_generation))
다음을 통해 재생성된 이미지를 확인할 수 있습니다.
result = gari.chromosome2img(solution, target_im.shape)
matplotlib.pyplot.imshow(result)
matplotlib.pyplot.title("PyGAD & GARI for Reproducing Images")
matplotlib.pyplot.show()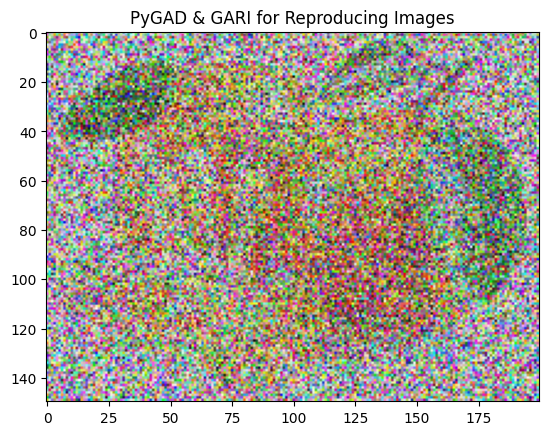
이 외에도, number of generation, crossover, mutation의 파라미터를 변경하여 다양한 실험이 가능합니다. 분명한 것은 더 많은 세대를 지날수록 이미지 재생성의 퍼포먼스는 더욱 더 향상되는 것을 확인할 수 있을 것입니다.

현재 머신러닝, 딥러닝을 공부하고 있습니다.