1. Cache - Perf
To monitor cache hits or misses at the level of a particular core or at the L3 cache level, or even for a specific command, you should consider using Perf. Perf is a powerful performance analyzing tool in Linux, and it's particularly well-suited for detailed analysis like cache performance.
Here’s how you can use Perf for monitoring cache hits or misses:
-
Install Perf: It usually comes preinstalled with the Linux kernel, but if it's not available, you can install it through your distribution's package manager. For Ubuntu, the command is typically:
sudo apt-get install linux-tools-common linux-tools-generic linux-tools-`uname -r` -
Monitoring Cache Hits/Misses:
- To monitor cache events on a particular core, you can use the
-Coption followed by the core number. - For L3 cache, you can specify events like
LLC-loadsandLLC-load-misses(LLC stands for Last Level Cache, which is typically L3). - You can also attach Perf to a running process or execute a command under Perf to get cache performance for that specific process or command.
- To monitor cache events on a particular core, you can use the
-
Example Commands:
- To monitor L3 cache load and miss events on core 0:
sudo perf stat -e LLC-loads,LLC-load-misses -C 0 - To monitor cache events for a specific command:
sudo perf stat -e cache-references,cache-misses -- <command> - To monitor L1 and L2 cache misses while running a command, you might use something like:
sudo perf stat -e L1-dcache-load-misses,LL-cache-misses -- <command> - To monitor L3 cache load and miss events on core 0:
Identify the Event Names: The exact names of the events for L1 and L2 cache misses can vary depending on the processor. Common names are
L1-dcache-load-missesfor L1 data cache load misses andLL-cache-missesfor Last Level Cache misses (which could be L2 or L3, depending on the CPU architecture).
- Interpreting Results: After the command executes, Perf will display statistics including the number of L1 and L2 cache misses that occurred during the command's execution.
2. Memory Read/Write Throughput - IntelVTune Profiler

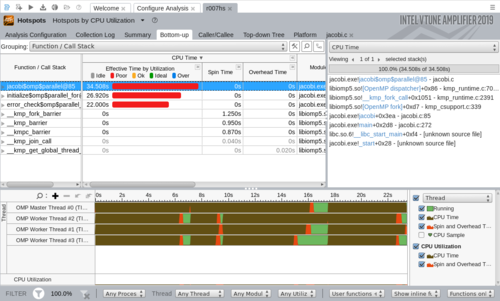
Using Intel VTune Profiler involves several steps, from installation to running analyses on your target applications. VTune Profiler is a performance analysis tool that provides a rich set of metrics, including CPU usage, memory access patterns, and more. Here’s a basic guide on how to use VTune:
Installation
For Ubuntu:
wget https://registrationcenter-download.intel.com/akdlm/IRC_NAS/56d0db2b-1ff1-4abe-857a-72ca9be22bd3/l_oneapi_vtune_p_2024.0.1.14.sh

sudo sh ./l_oneapi_vtune_p_2024.0.1.14.sh
Setting Up a Project
-
Launch VTune Profiler: Once installed, open VTune Profiler.
-
Create a New Project:
- Choose 'New Project' from the VTune start screen.
- Name your project and select a directory to store the project files.
Configuring and Running an Analysis
-
Choose an Analysis Target:
- You can analyze either a running process or a binary executable.
- For a binary, provide the path to the executable and any command-line arguments it needs.
-
Select an Analysis Type:
- VTune offers various types of analyses like Hotspots, Memory Access, Microarchitecture Exploration, etc.
- For memory read/write throughput, you might want to start with the Memory Access analysis.
-
Run the Analysis:
- Click the 'Start' button to begin the analysis.
- VTune will execute your application and collect data.
Reviewing Results
-
View the Results: After the analysis is complete, VTune will display the results in a variety of reports and views.
-
Interpret the Data:
- Look for hotspots, which are areas of code with the most significant performance impact.
- Use the memory access patterns to understand how your application interacts with the system's memory.
-
Optimize Based on Findings: Use the insights gained from VTune to optimize your application. This might involve code refactoring, algorithm changes, or other modifications.
Advanced Features
- Remote Profiling: VTune can profile applications running on remote systems, which is particularly useful for server-side performance analysis.
- Command Line Interface: For automated or scripted analyses, VTune provides a command-line interface.
- Integrate with Development Environments: VTune can be integrated with popular development environments like Visual Studio or Eclipse for a more seamless workflow.
Tips
- Run Multiple Analyses: Different types of analyses can provide different insights. It's often useful to run several types of analyses on your application.
- System Requirements: Ensure your system meets the requirements for VTune, especially for more detailed analyses which can be resource-intensive.
- Documentation and Tutorials: Refer to Intel's documentation and tutorials for more detailed guidance on using VTune Profiler. They provide valuable information for both beginners and advanced users.
