Polar Plot
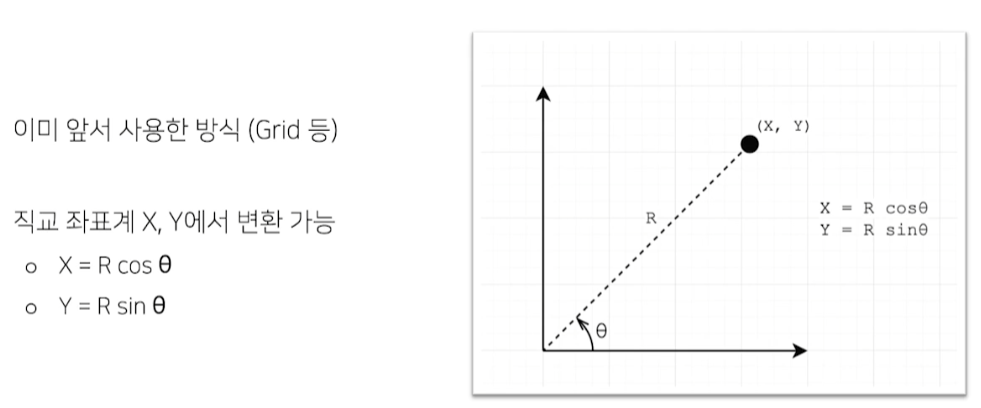
극 좌표계를 사용
거리, 각을 사용하여 plot
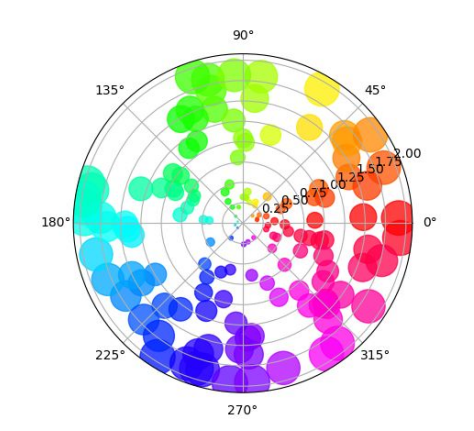
- scatter 외에 line, area 모두 가능
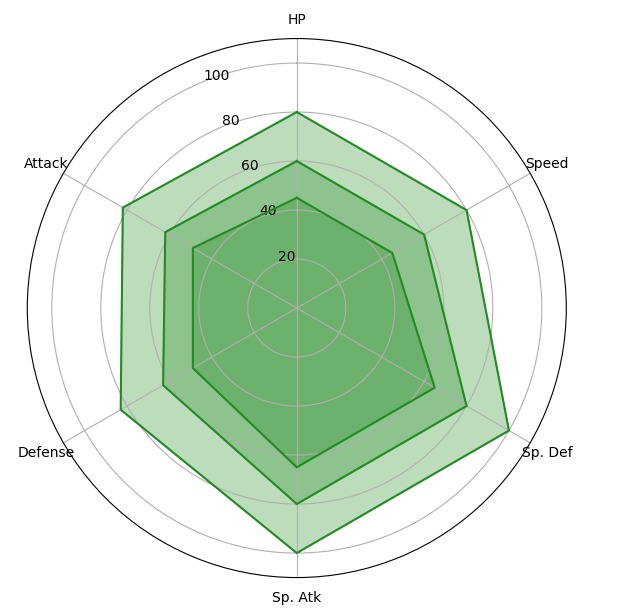
Radar Chart
별 모양으로 생겨 Star Plot으로 불리기도 함
중심점을 기준으로 N개의 변수 값 표현
데이터의 quality를 표현하기에 좋음
- e.g., 운동 선수 분석, 캐릭터 능력치
주의점
- 각 feature은 독립적이며, 척도가 같아야 함
- 자동차의 최대 속도, 연비 등 척도가 다른 수치는 표현이 힘듦
- 면적이 중요해 보이나 feature 순서에 따라 많이 다름
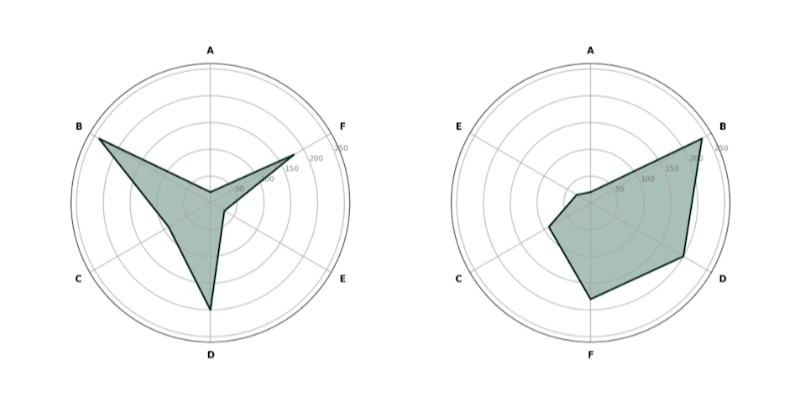
- 두 chart는 같은 chart지만 오른쪽 면적이 더 넓어보임
- Feature가 많으면 가독성이 떨어짐
실습
Polar Coordinate
ax = fig.add_subplot(111, projection='polar')
- 서브플롯 ax를 만들 때
projection='polar'파라미터를 전달 polar=True파라미터를 전달해도 똑같음
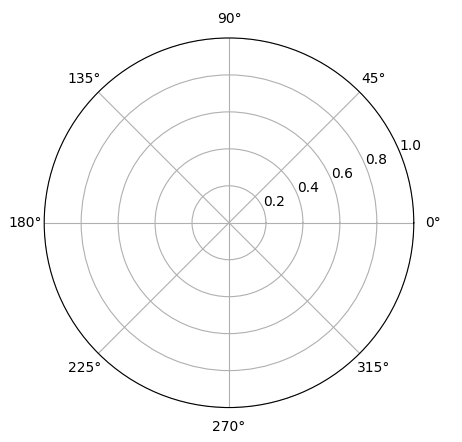
- 0.2 ~ 1.0은 반지름 길이
ax.set_rmax(2) & ax.set_rmin(1)
- 반지름 시작점이 1, 끝점이 2인 길이 1인 원이 생성
ax.set_rticks([0.5, 1, 1.5, 2])
- xticks처럼 반지름 tick을 정해줌
ax.set_rlabel_position(각도)
- 반지름 label이 적히는 위치의 각도 조정
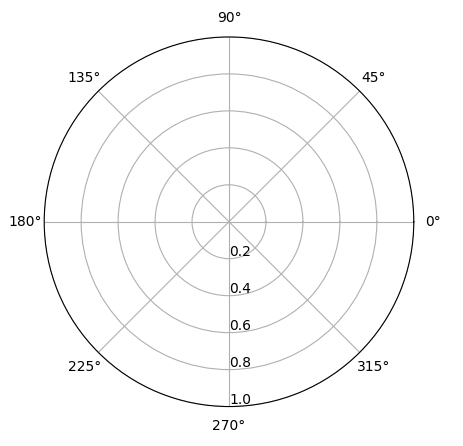
- -90으로 설정해 0에서 -90도에 위치하는 곳에 rlabel 표시
ax.set_thetamin(각도) & ax.set_thetamax(각도)
- 각도의 최소, 최대값을 지정해 부채꼴 모양 plot
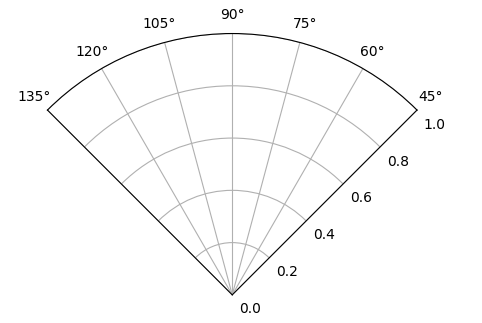
- 45 ~ 135도의 부채꼴 생성
Polar 기본 차트
ax = fig.add_subplot(111, projection='polar')
c = ax.scatter(theta, r)- 각도와 반지름 정보를 data로 사용
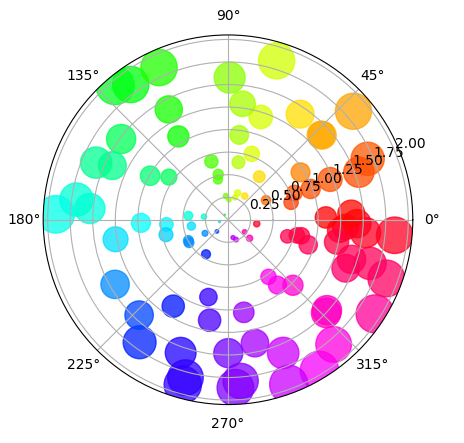
- c, s, cmap, alpha 등 직교 좌표 plot과 동일하게 사용
ax.bar(theta, r) bar chart
ax.bar(theta, r) line chart
Radar Chart
theta = np.linspace(0, 2*np.pi, 6, endpoint=False)
- feature 개수에 맞춰 2파이를 등분
끝 점을 포함시켜야 완전히 이어진 radar chart를 그릴 수 있음
- 끝 점을 data에 포함시켜야 함
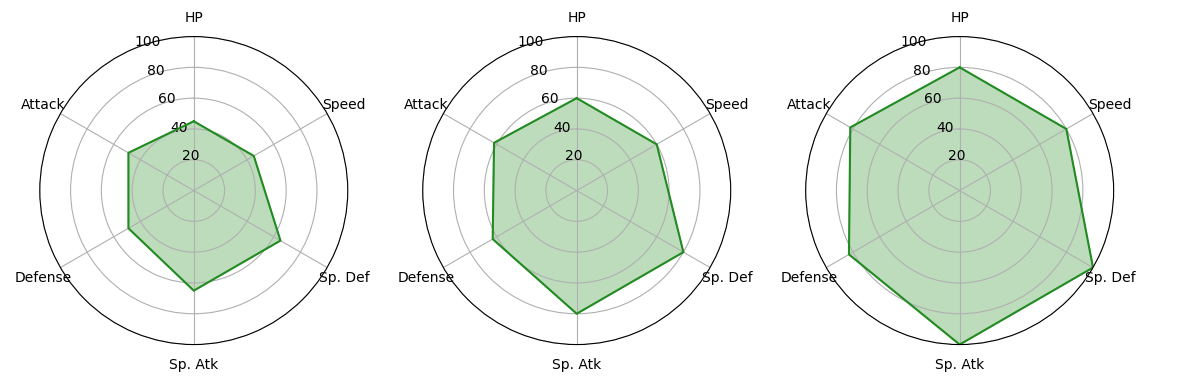
- 원하는 plot 모양에 맞게 따로 그릴 수도, 겹쳐서 그릴 수도 있음
※ 모든 이미지 및 코드 출처는 네이버 커넥트재단 부스트캠프 AI Tech 5기입니다. ※

AI-Kid