📌 월간 비트코인(KRW-BTC)
2020년 ~ 2020년 약 3년동안에 월간 KRW-BTC 시세
📖 upbit API
KRW-BTC 에 대한 시세 정보는 upbit api 에서 requests 라이브러리를 이용하여 가져오도록 했습니다.
📕 라이브러리 가져오기
import requests
import json
import pandas as pd
✍ API를 통한 월별 데이터 함수
def get_month_BIT(market,year,month):
	url = "https://api.upbit.com/v1/candles/months"
    # api에 전달할 매개변수
    queryparams = {
    	"market": market,
        "to" : f"{year} - {month:02d}-01 00:00:00"
        "count" 1
    }
✍ API 요청하기
headers = {"accept": "application/json"}
res = requests.get(url, headers=headers,params=queryparams)
# 요청 성공 했을 경우 : code 200
if res.status_code == 200:
	try:
    	data = res.json()[0]
        # 필요 데이터
        high_price = data["high_price"] # 고가
        low_price = data["low_price"] # 저가
        candle_acc_trade_price = data["candle_acc_trade_price"] #  누적거래 금액
        candle_acc_trade_volume = data["candle_acc_trade_volume"] #누적 거래량
        return(high_price,low_price,candle_acc_trade_price,candle_acc_trade_volume)

	except Exception as e:
    	raise Exception(e)
else:
	res.status_code == 400
✍ 비트코인 월간 데이터 저장하기
# 종목 = 비트코인(KRW)
market = "KRW-BTC"

# []에 KRW-BTC 월간 데이터 저장
month_data = []

# 2020년 01월 ~ 2022년 12월 까지의 데이터를 []에 저장
for year in range(2020,2023):
	for month in range(1,13):
    	if year == 2022 and month == 13:
        	break
       # get_month_BIT()를 호출하여 data에 저장
       	data = get_month_BIT(market,year,month)
       	month_data.append(data)
✍ DataFrame 변환 및 .csv로 저장하기
df = pd.DataFrame(month_data,columns=['고가','저가','누적 거래대금','누적 거래량'])
df['고가'] = df['고가'].apply(lambda x: '{:,.0f} 원'.format(x))
df['저가'] = df['저가'].apply(lambda x: '{:,.0f} 원'.format(x))
df['누적 거래대금'] = df['누적 거래대금'].apply(lambda x: '{:,.0f} 원'.format(x))
df['누적 거래량'] = df['누적 거래량'].apply(lambda x: '{:,.0f} 개'.format(x))

index = [(f"{year}년 {month}월") for year in range(2020, 2023) for month in range(1, 13) if not (year == 2022 and month == 13)]
df.index = pd.Index(index,name="월")

df.to_csv('monthly_BIT.csv',encoding='utf-8-sig')

print(df.head(10))
💻 출력
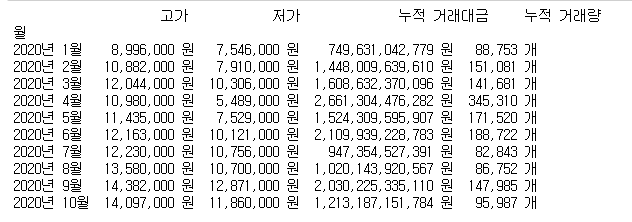
2020년 01월 ~ 2022년 12월 까지의 KRW-BTC의 모든 월 단위 정보를 나타내기 양이 많아
df.head(10) 함수를 사용하여 상위 10개 정보 만을 출력했습니다.
📌 데이터 시각화
matplotlib 을 이용하여 비트코인의 월간 시장 데이터를 막대 그래프 형식으로 나타내도록 했습니다.
import matplotlib.pyplot as plt
import matplotlib
matplotlib.rcParams['font.family'] = 'Malgun Gothic' # Windows
matplotlib.rcParams['font.size'] = 15 #
matplotlib.rcParams['axes.unicode_minus'] = False

%matplotlib inline
✍ 고가 그래프
# CSV 파일에서 데이터 읽기
df = pd.read_csv('monthly_BIT.csv', index_col=0)
# '원' 문자 제거
df['고가'] = df['고가'].str.replace(' 원', '')
# ',' 제거 및 숫자로 변환
df['고가'] = pd.to_numeric(df['고가'].str.replace(',', ''))
# 막대 그래프 생성
ax = df.plot(kind='bar', figsize=(16,8),alpha=0.8)
# 그래프 제목과 축 라벨 설정
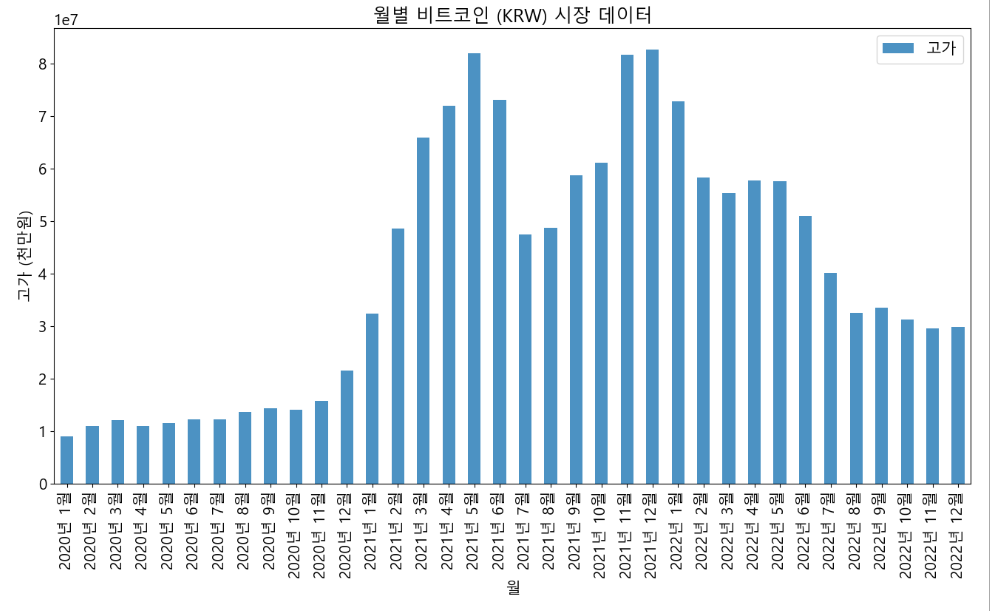
plt.title('월별 비트코인 (KRW) 시장 데이터')
plt.xlabel('월')
plt.ylabel('고가 (천만원)')
# x축 label 회전
plt.xticks(rotation=90)
# 그래프 츌력
plt.show()💻 고가 그래프
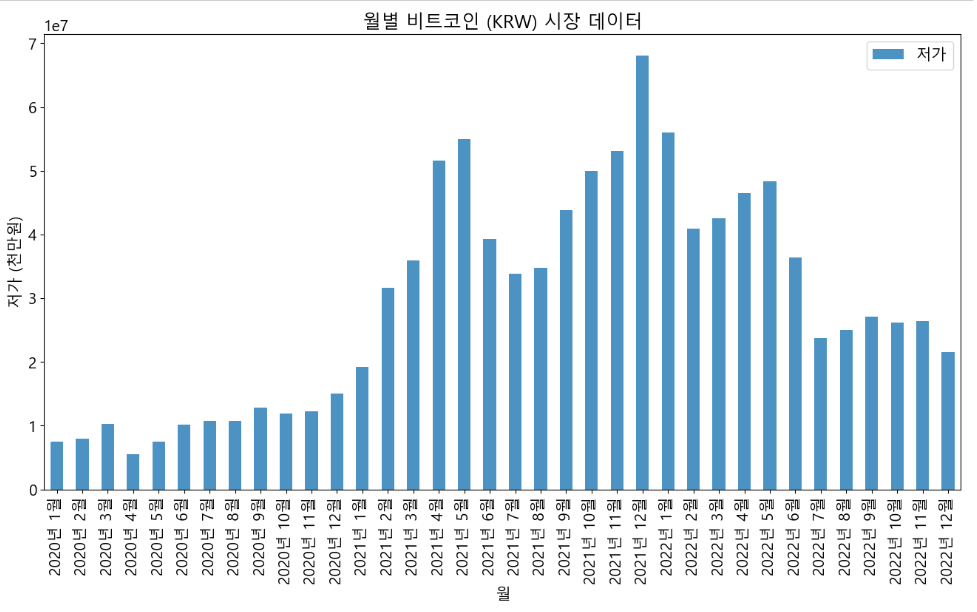
✍ 그 외 그래프
위에 작성한 코드에 df['고가'] 부분만 수정하며, '누적 거래량'은 '원' 문자 제거가 아닌 '개' 문자 제거를 하며 나머지 코드는 동일 합니다.
💻 저가 그래프
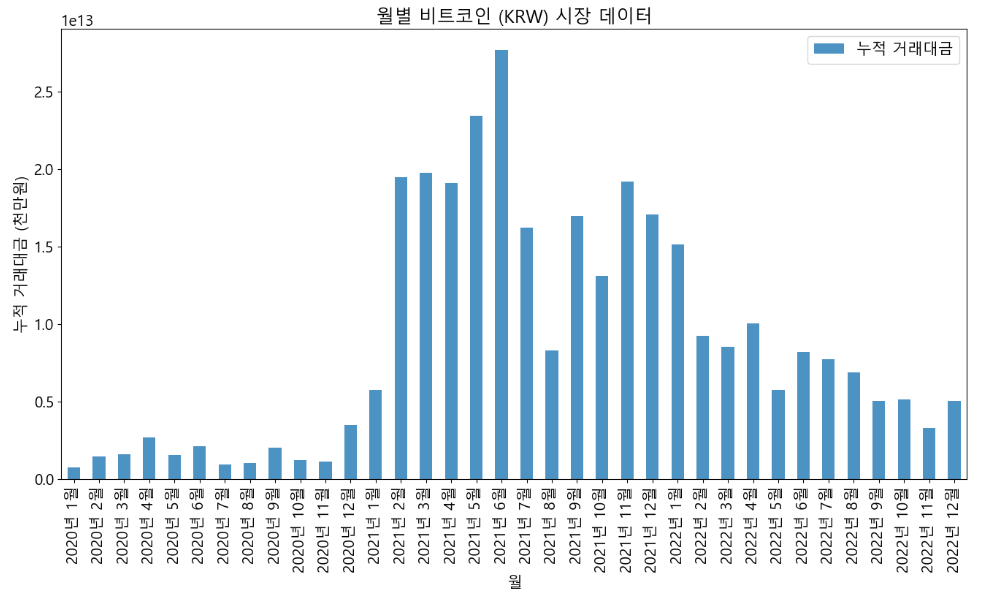
💻 누적 거래대금 그래프
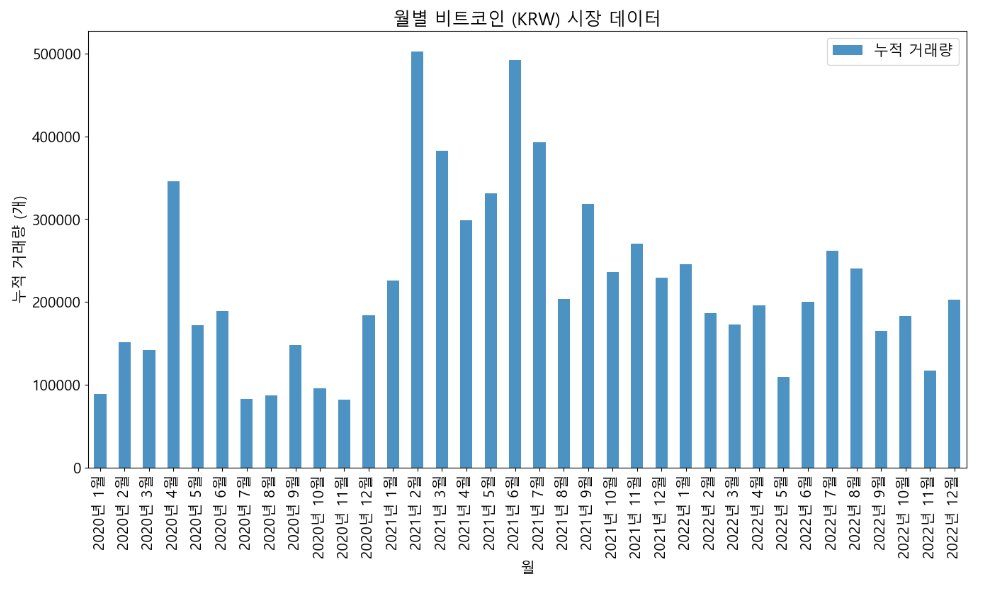
💻 누적 거래량
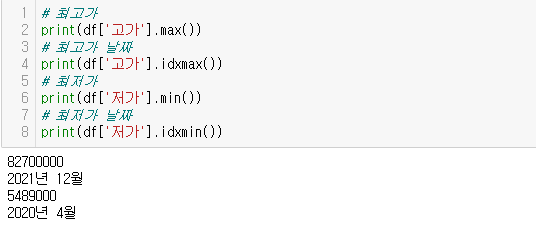
🎨 최고가 , 최저가 구하기
2020년 ~ 2022년까지 비트코인(KRW-BTC) 월간 데이터에서 최고가/최저가를 구하는 방법은 아래와 같습니다.
📌 프로젝트 후기
학원에서 배운 내용으로 진행된 첫 토이프로젝트 로써 전반적으로 내용이 부실하다 라는 느낌이 들긴하지만 실력향상에 있어서 큰 도움이 되는것 같다.
