1. Measures of Central Tendency
- Statistic (통계량) & Parameter (모수)
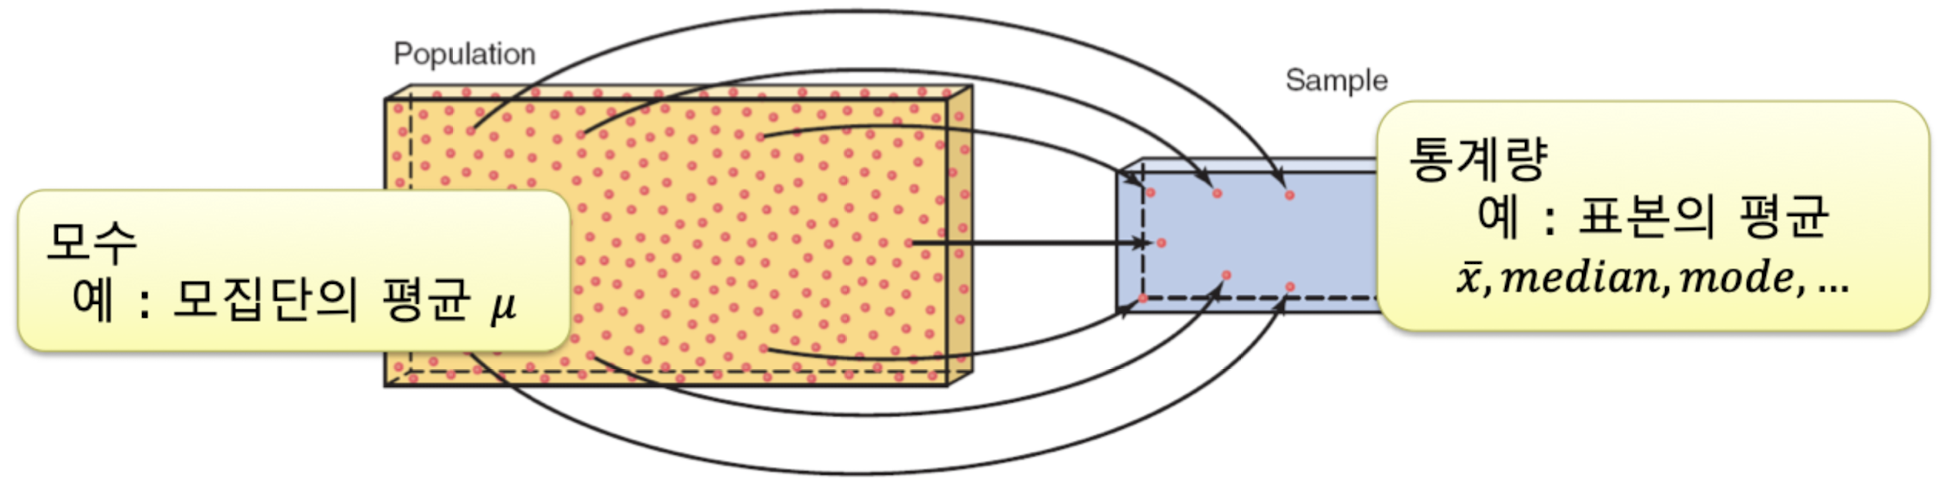
- 통계량 : sample(표본)의 데이터 값을 사용하여 얻은 특성 또는 측정값
- 모수 : 특정 population(모집단)의 모든 데이터 값을 사용하여 얻은 특성 또는 측정값
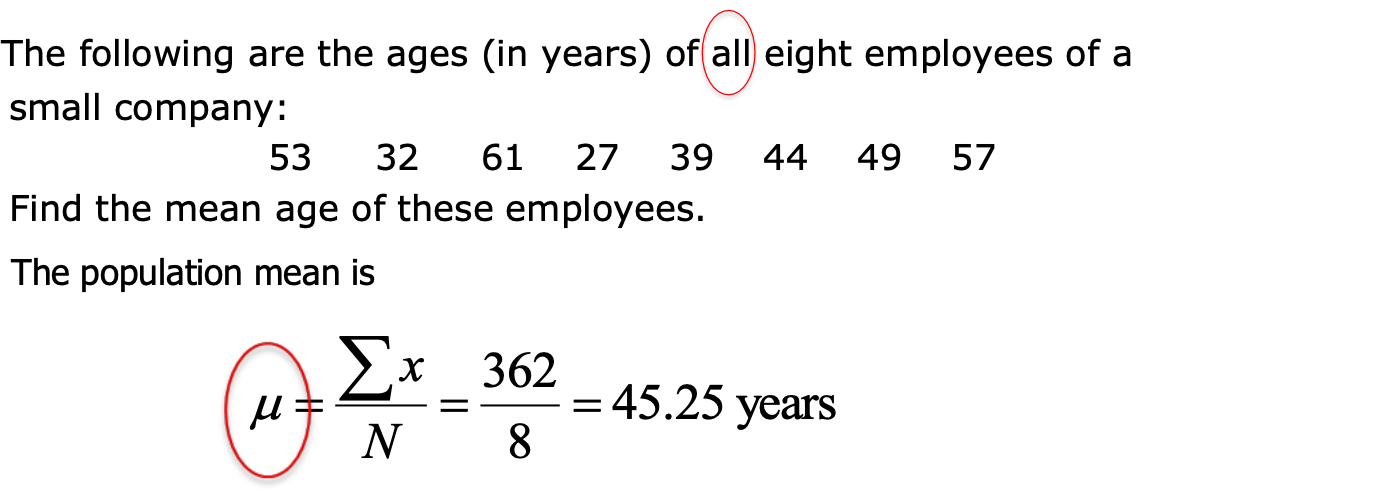
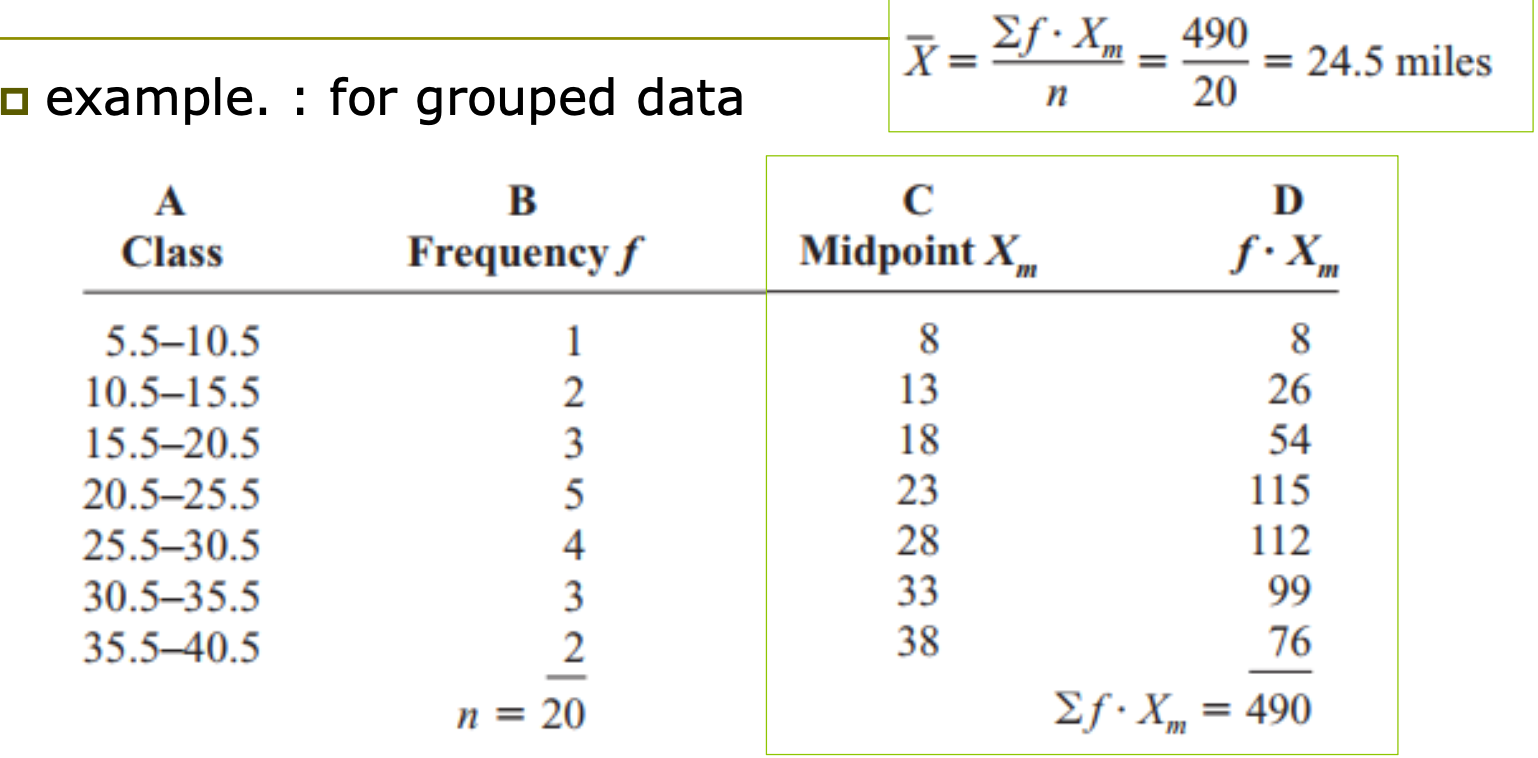
Mean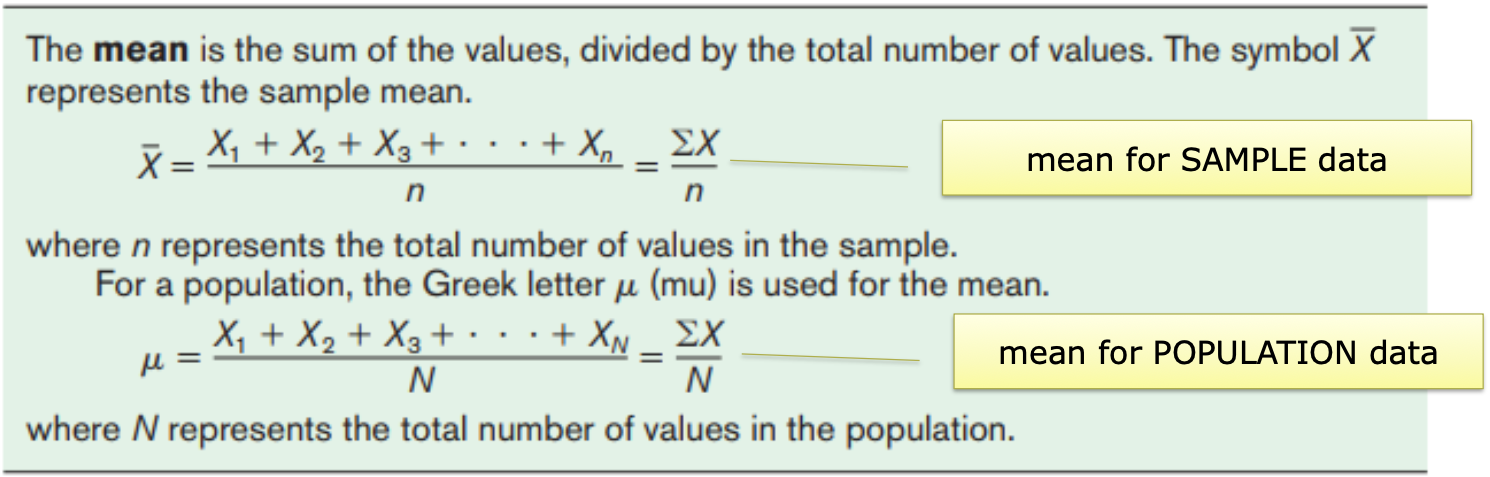
Median
: halfway point, midpoint
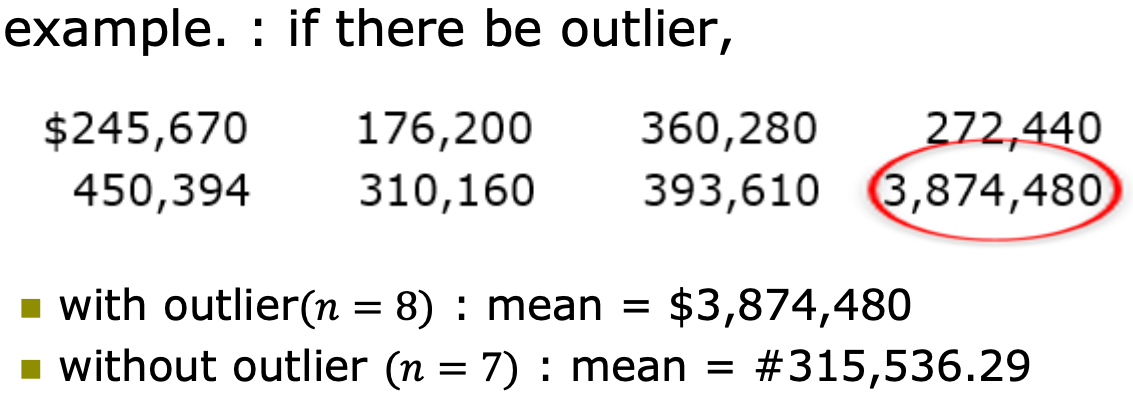
→ Exist outlier : median > mean
Mode
: Most often
Unimodal : only one mode
Bimodal : two modes
Multimodal : more than two modes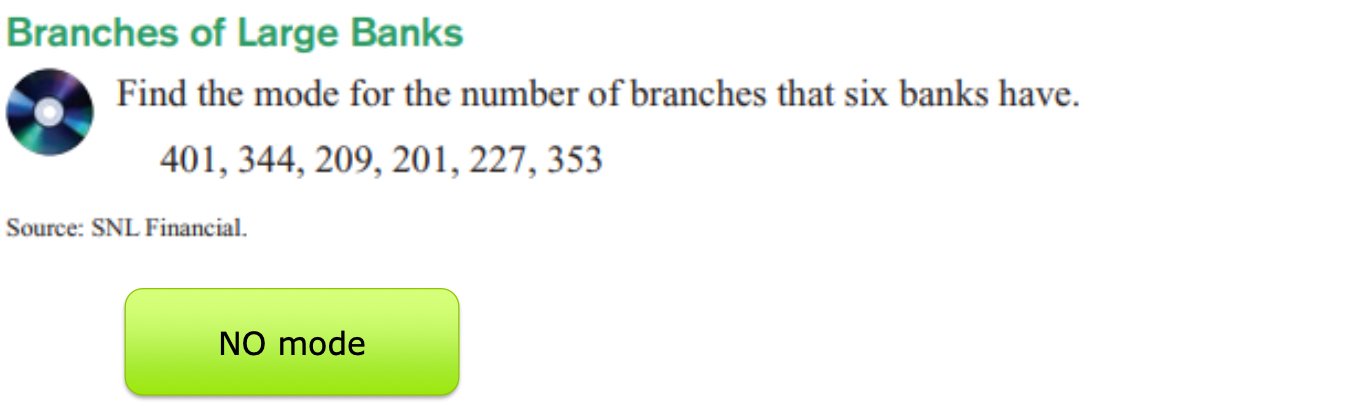
Midrange
: rough estimate of the middle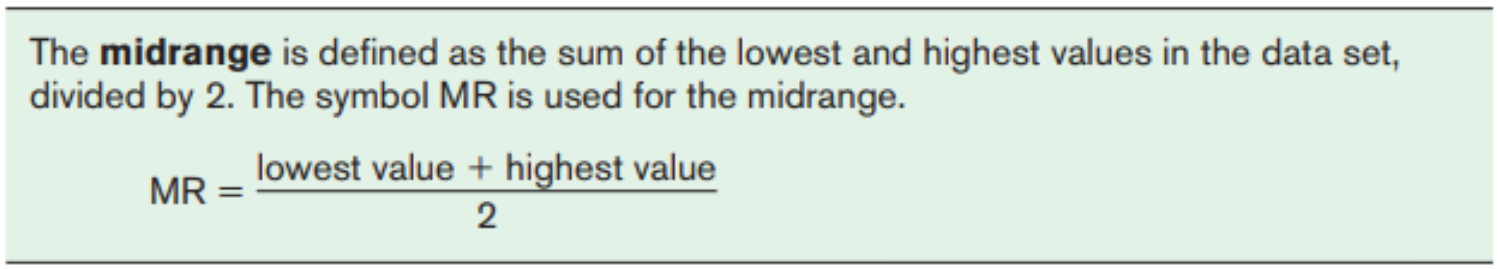
→ Outlier 있다면?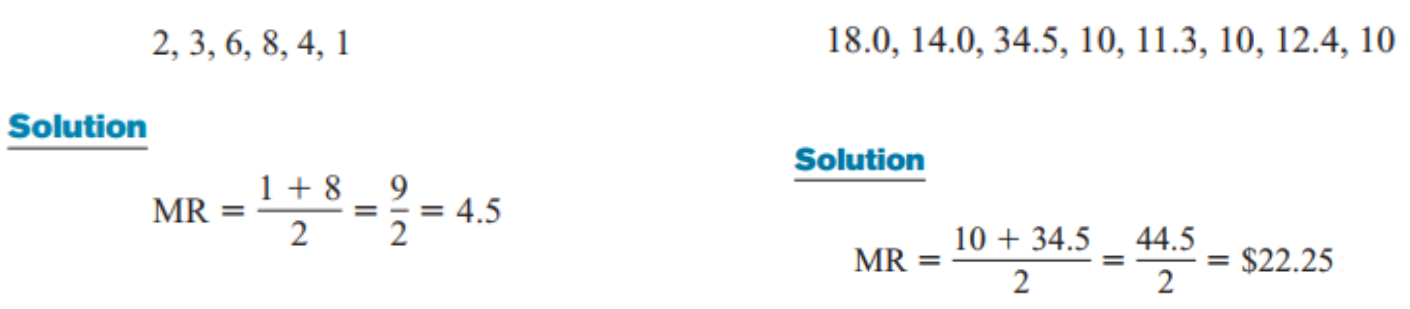
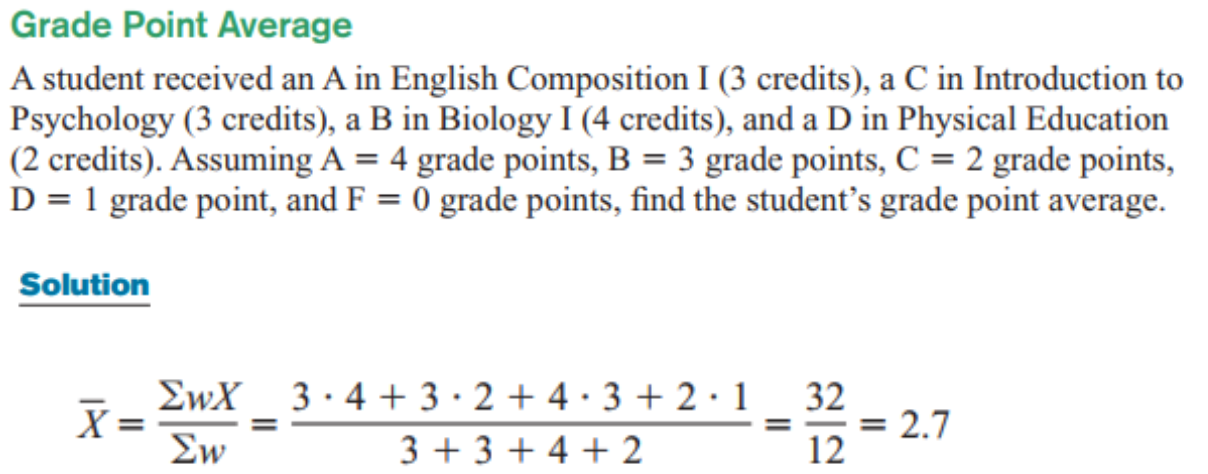
Weighted mean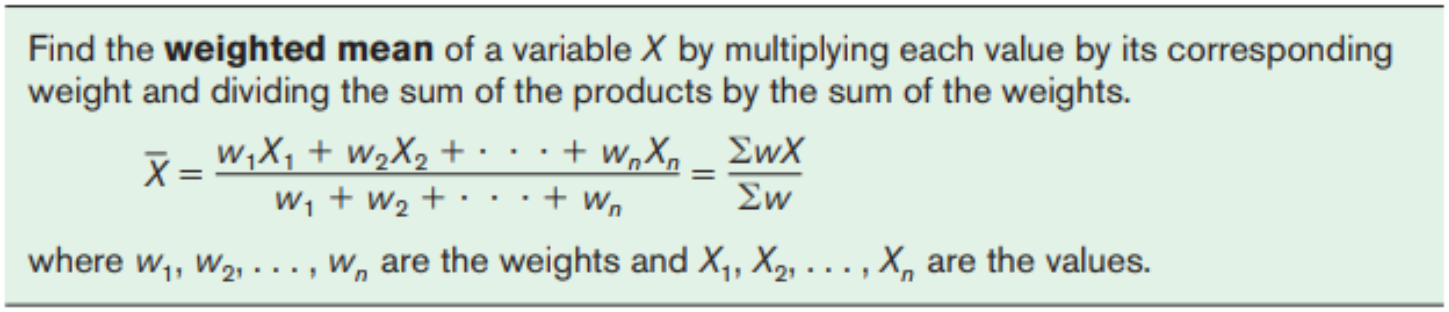
k% trimmed mean
: 작은거에서 k%, 큰거에서 k% 빼고 100-2k%로만 평균을 계산
Properties and uses of central tendency
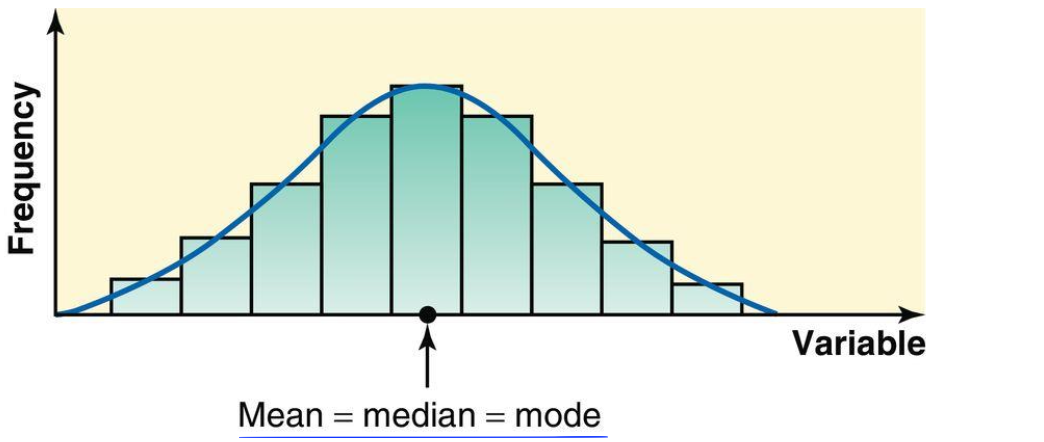
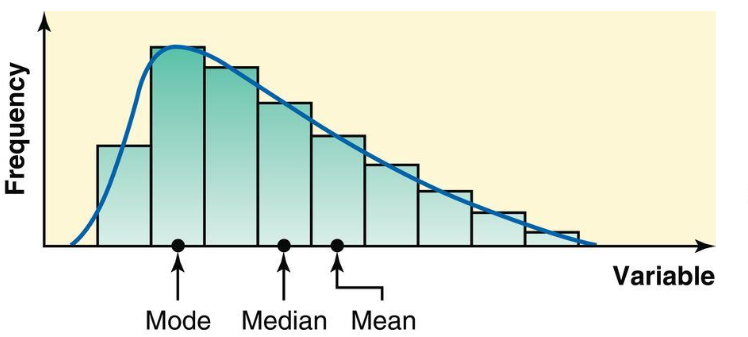
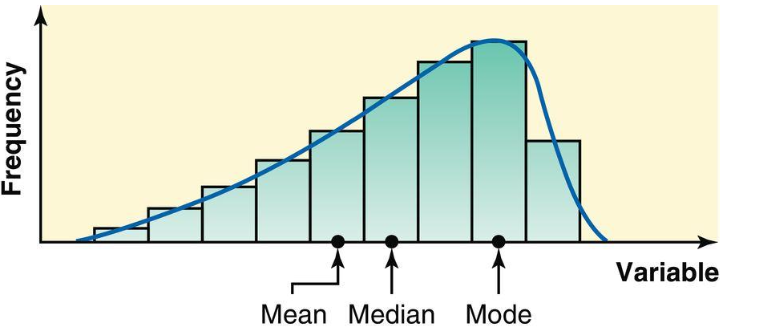
- Relationships among the mean, median, and mode
- for a symmetric histogram
- skewed to the right
- skewed to the left
- for a symmetric histogram
2. Measures of Variation
Range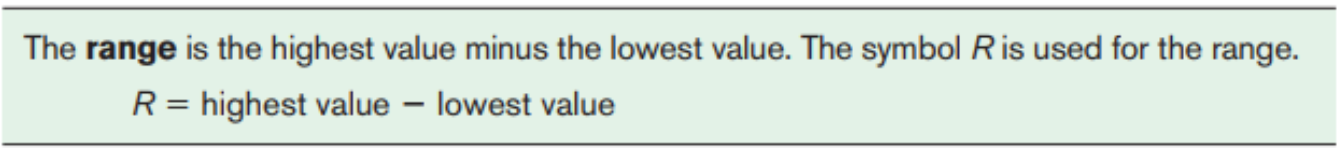
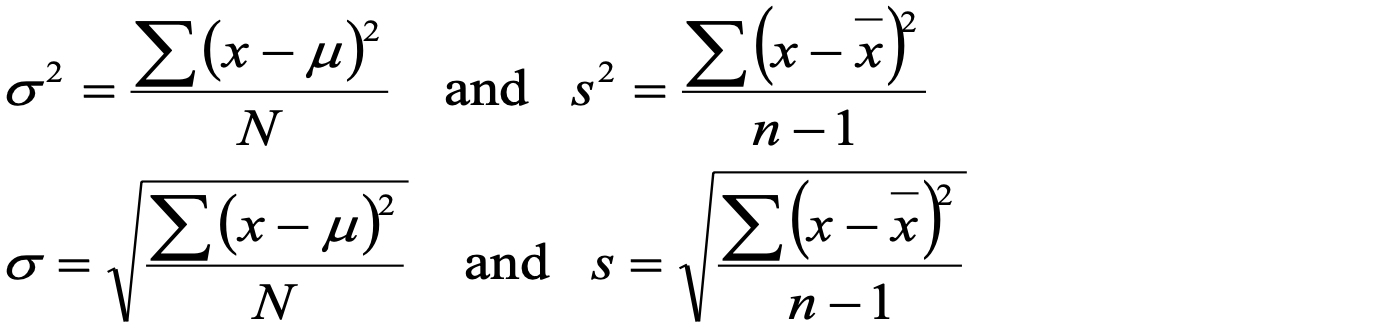
Population variance and standard deviation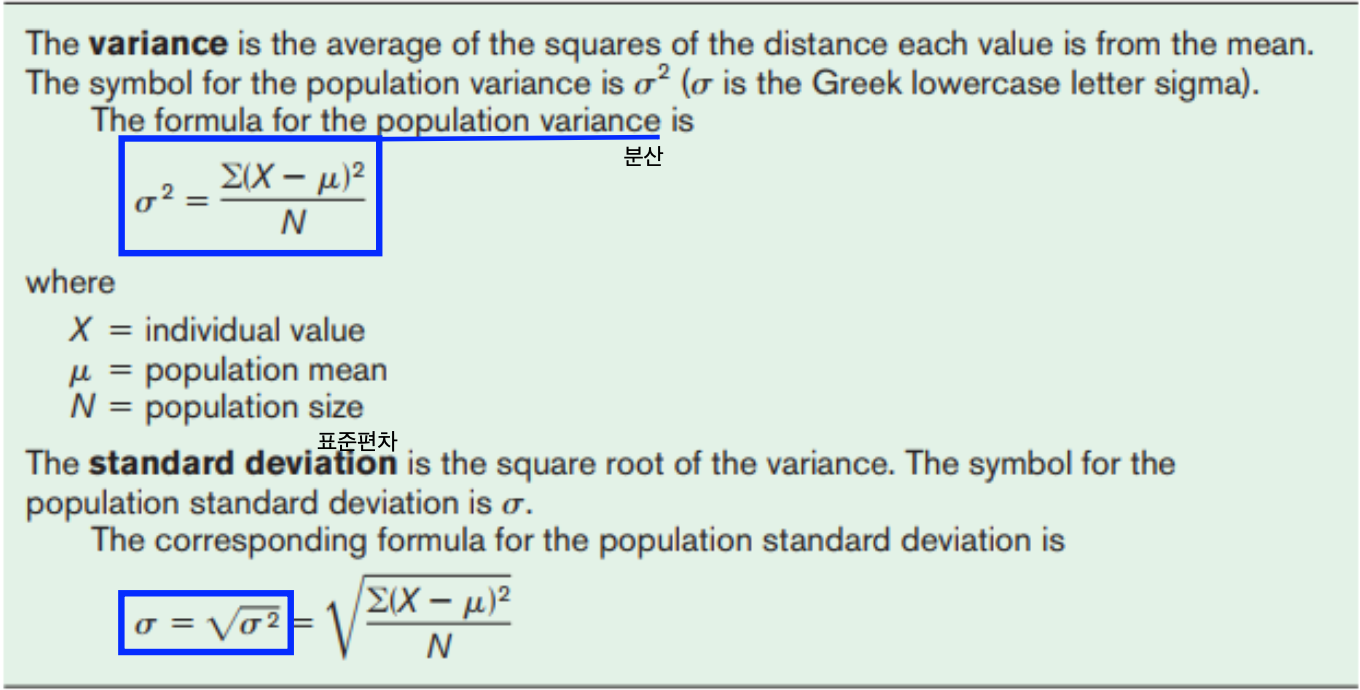
Sample variance and standard deviation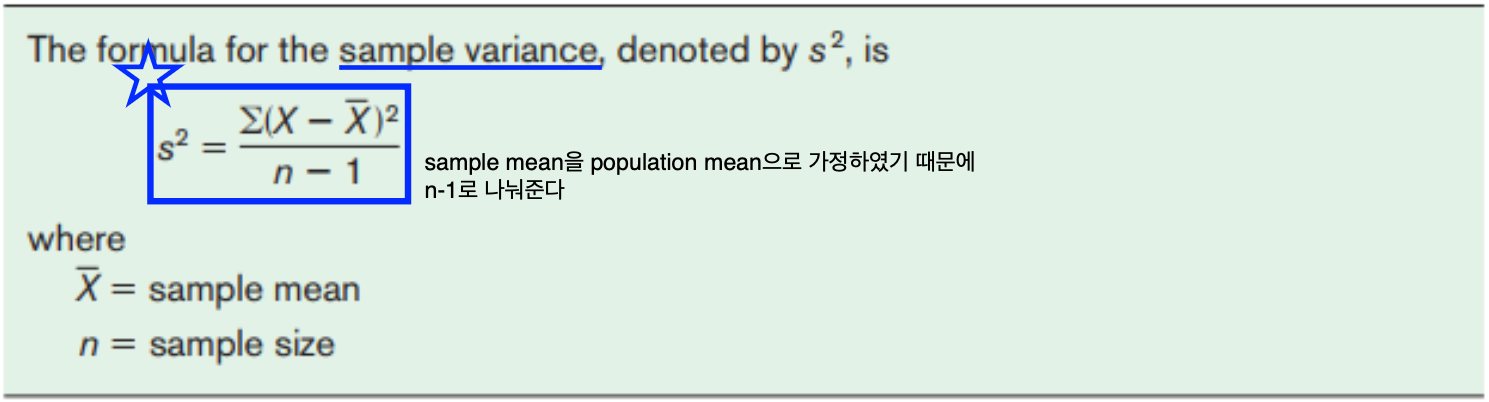
- basic formulas
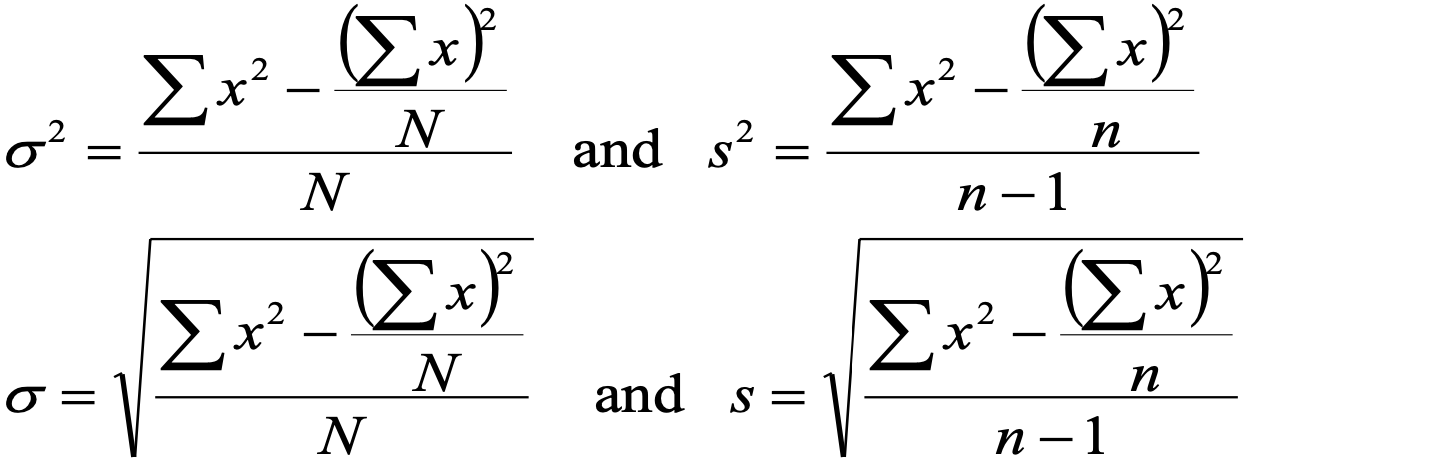
- short-cut formulas
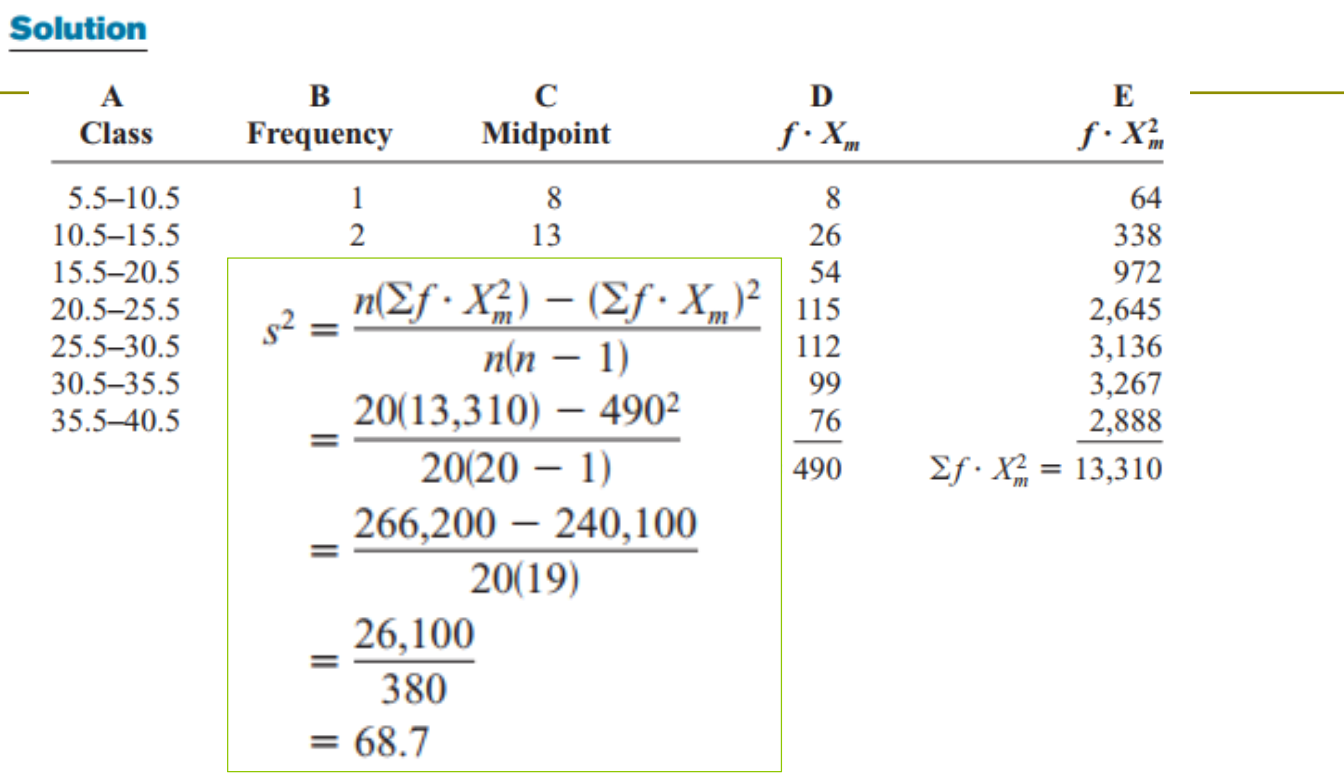
Variance and standard deviation for grouped data
Similar for finding the mean for grouped data
Ex_
The data represent the # of miles that 20 runners ran during one week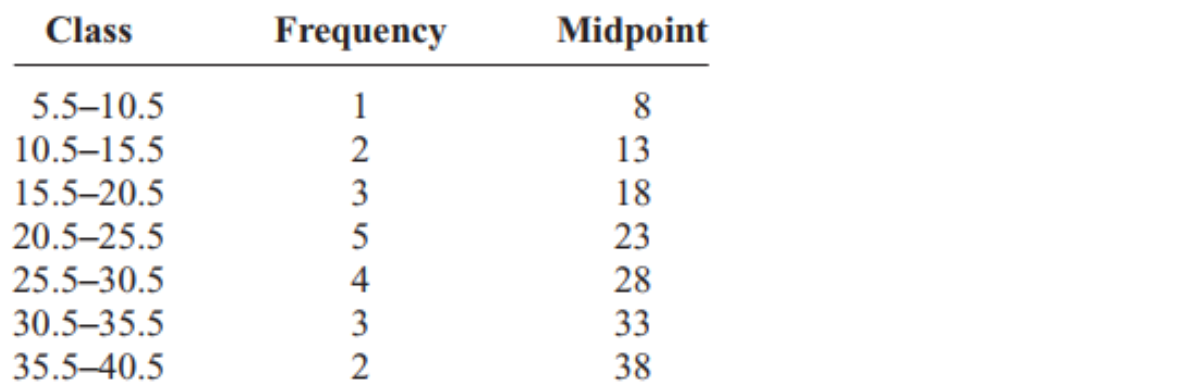
Coefficient of variation (변동계수)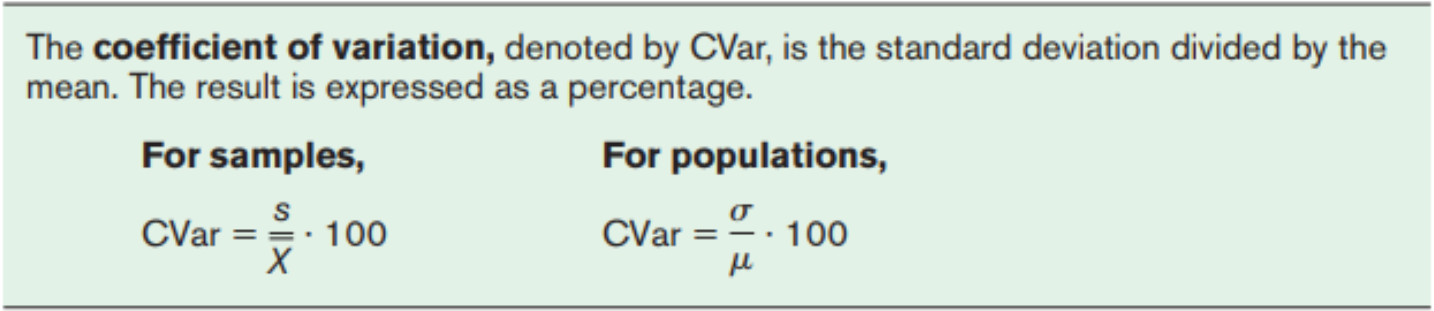
→ 비교단위가 다르기 때문에
Range rule for thumb
Be used to approximate the standard deviation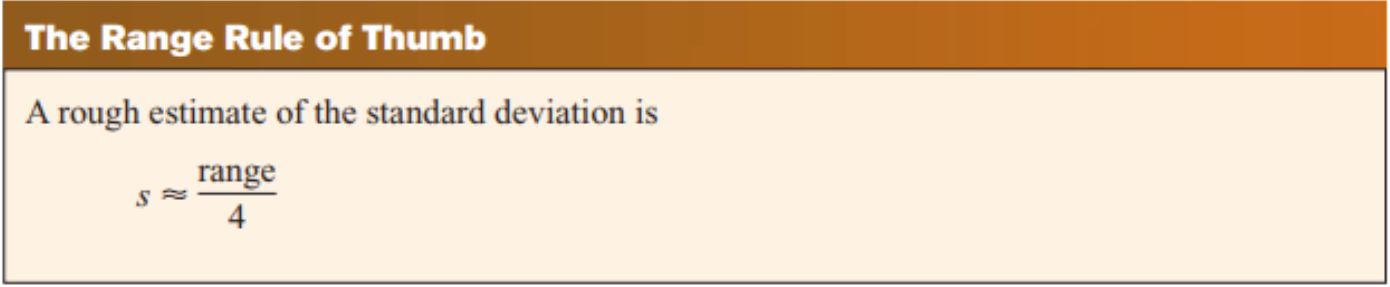
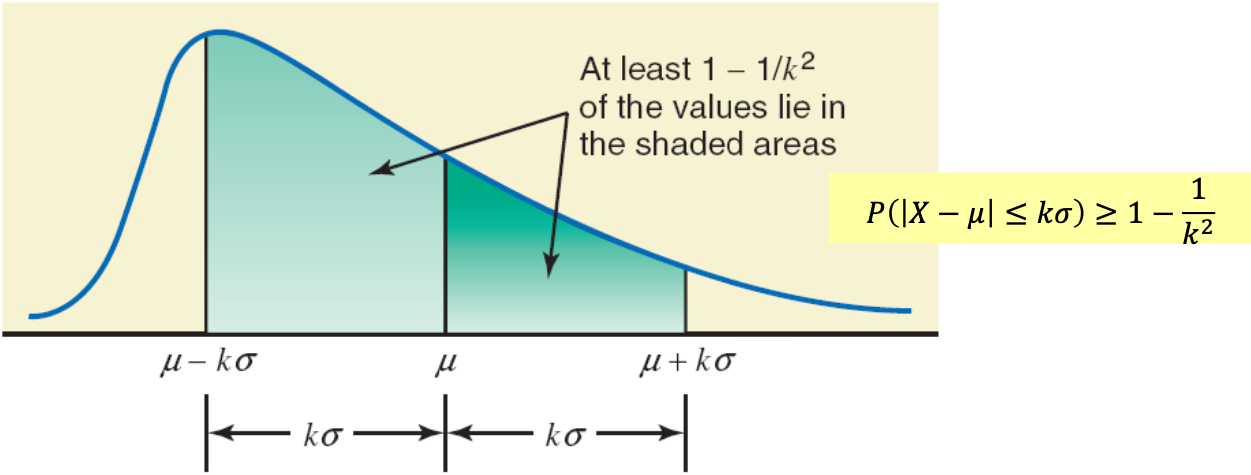
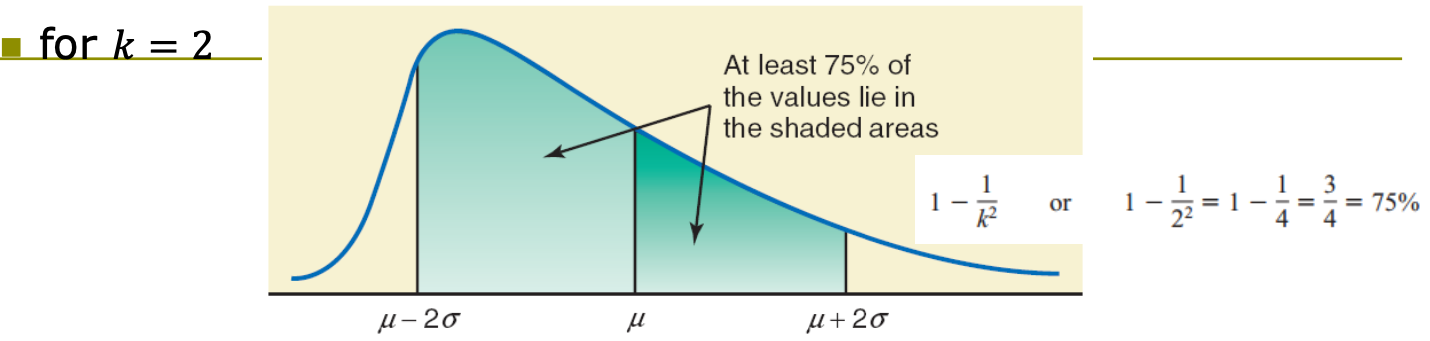
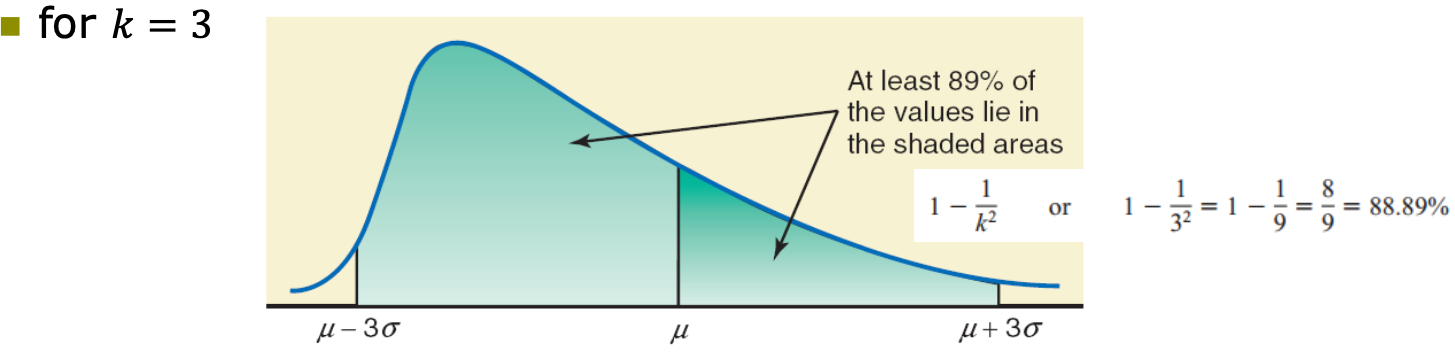
Chebyshev’s theorem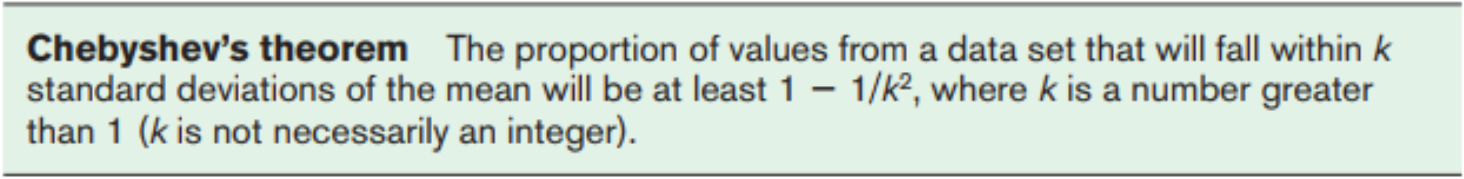
Ex_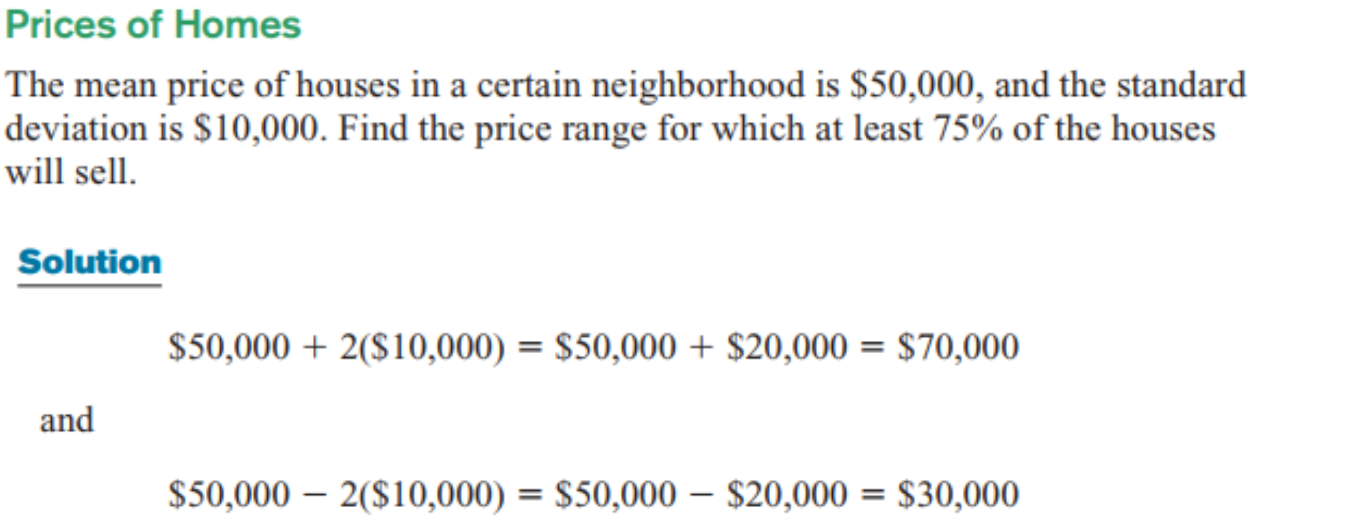
The empirical (normal) rule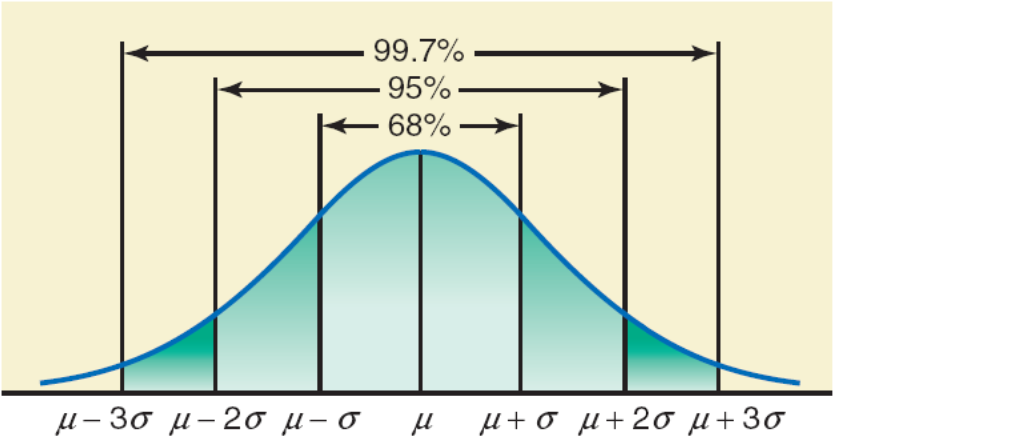
- For a bell shaped distribution, approximately
- 68% of the obs. lie within 1 std. of mean
- 95% of the obs. lie within 2 std. of mean
- 99.7% of the obs. lie within 3 std. of mean
3. Measures of Position
Standard scores ( 표준점수 )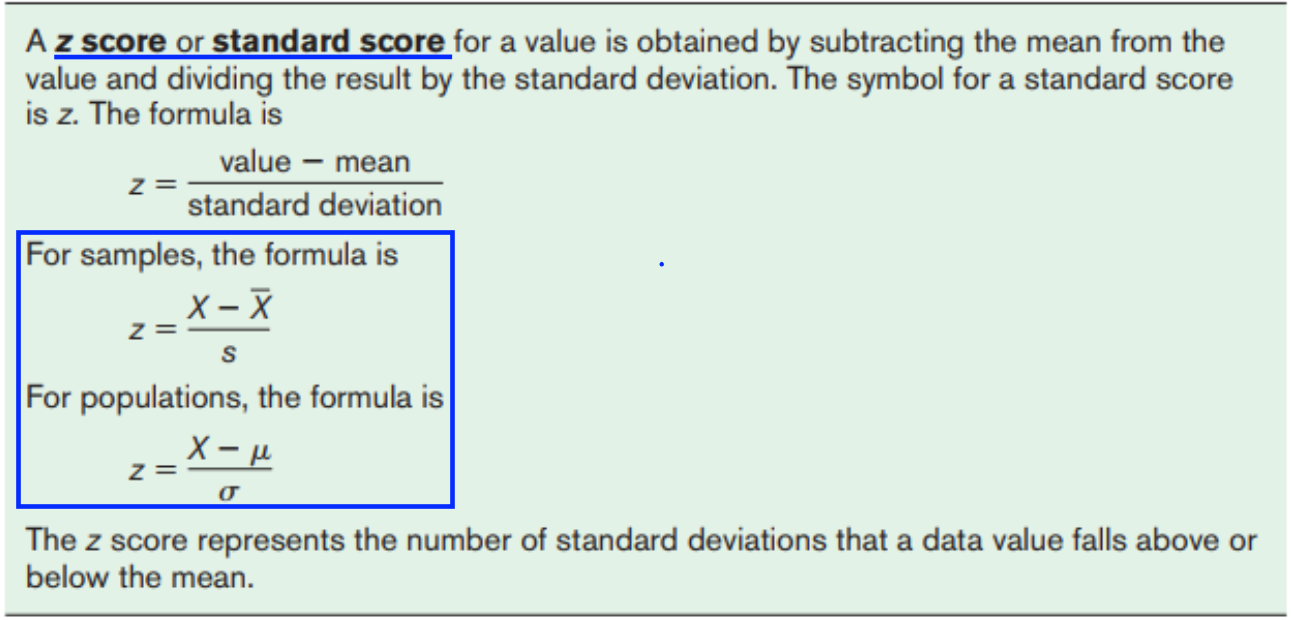
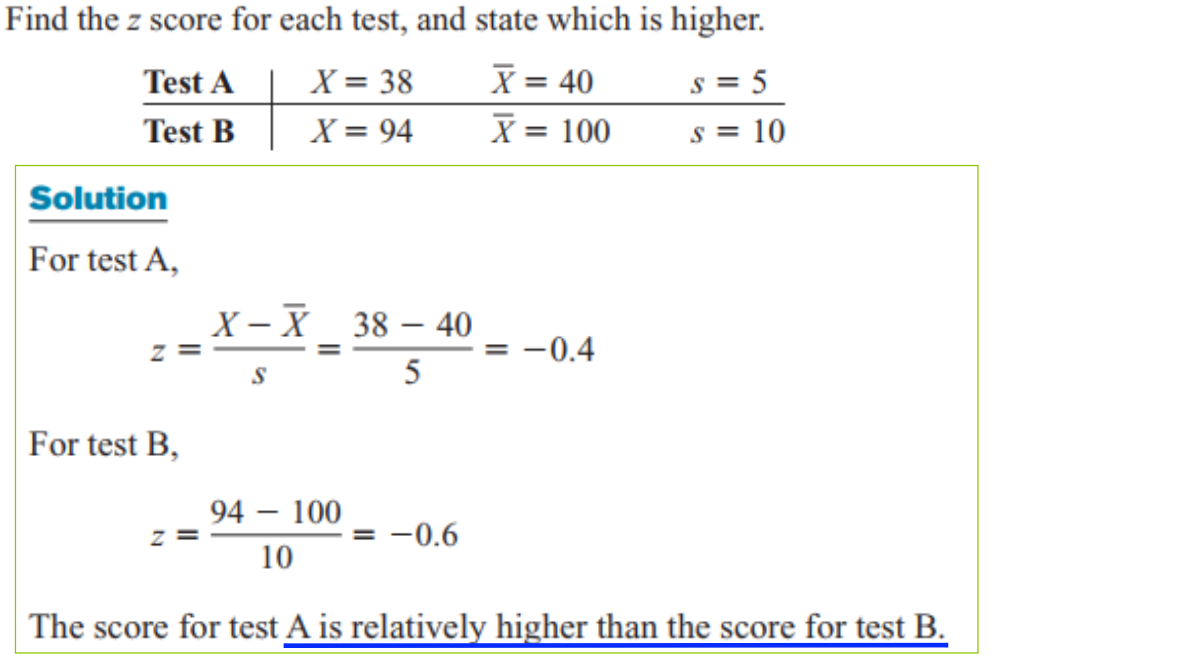
→ 표준점수는 데이터 값이 평균보다 높거나 낮은 표준 편차의 수를 나타낸다
Percentiles ( 백분위수 )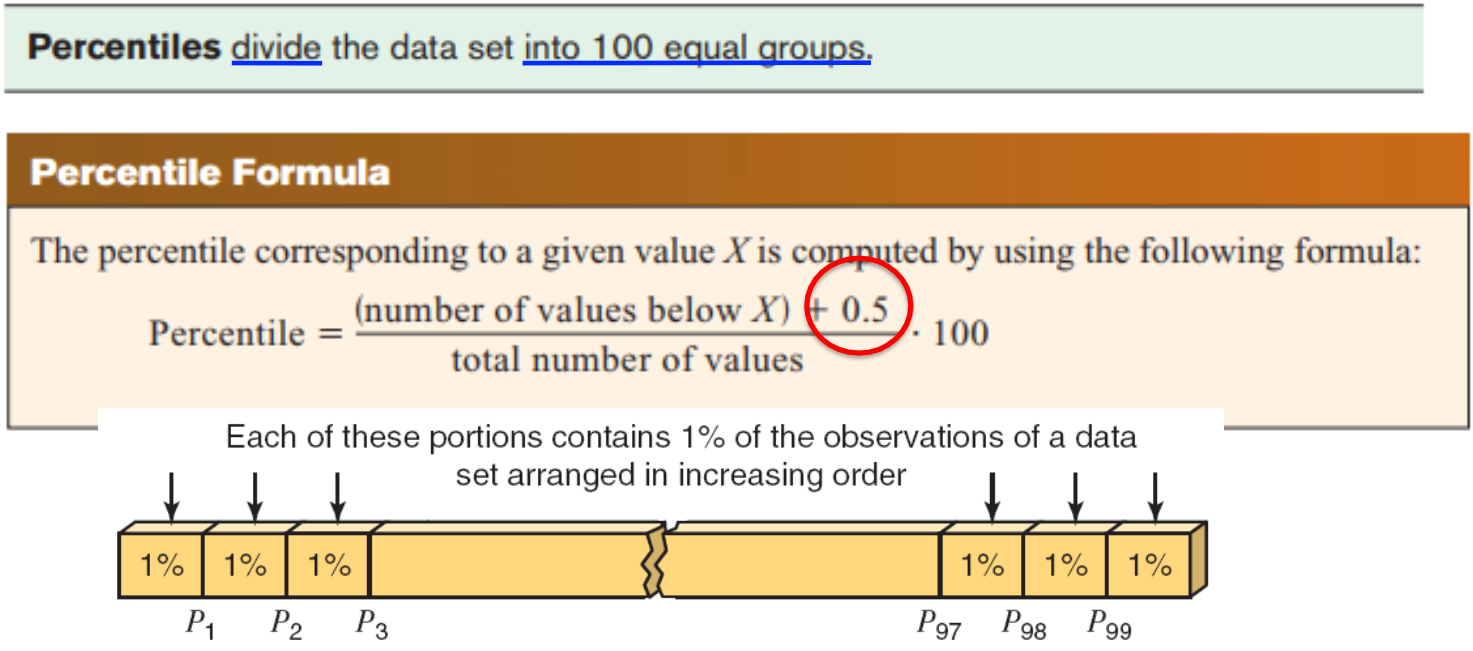
→ 이러한 각 부분에는 증가하는 순서로 배열된 데이터 집합의 관측값 중 1%가 포함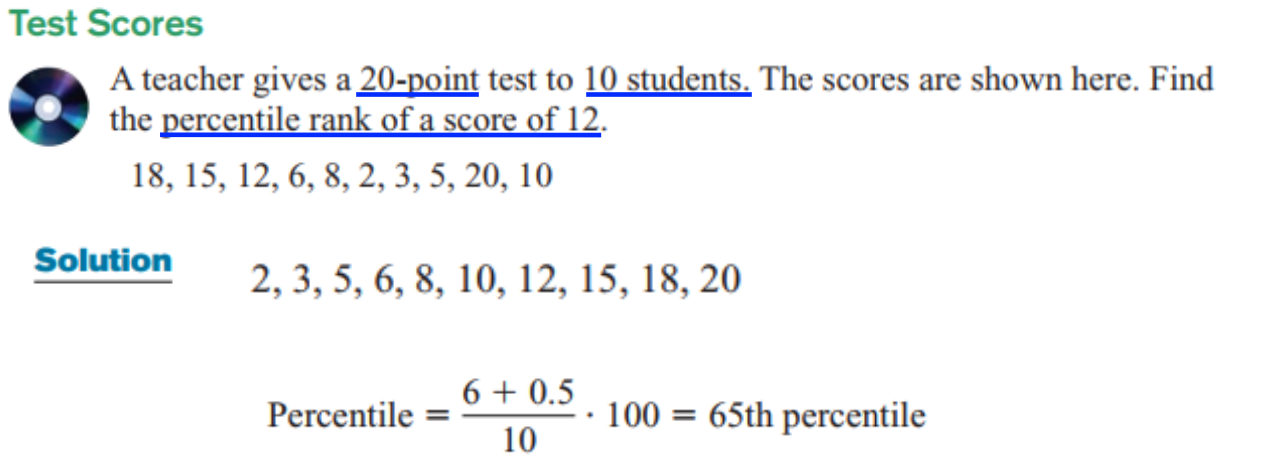
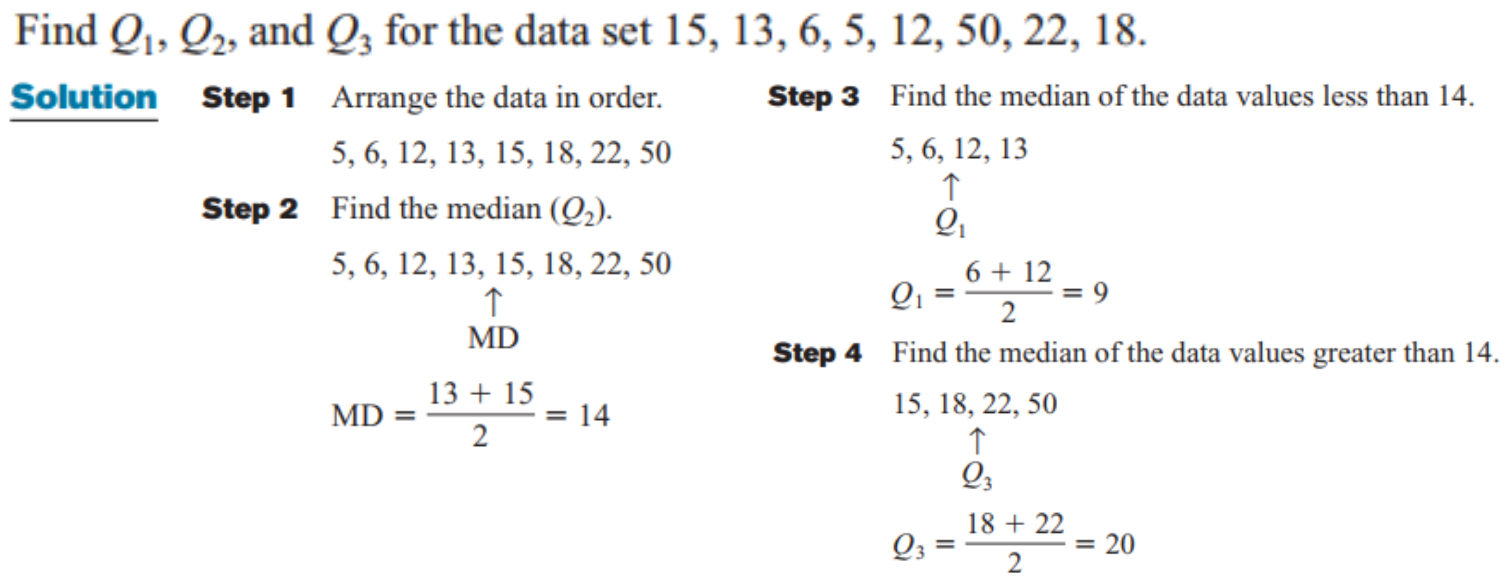
Quartiles ( 사분위수 )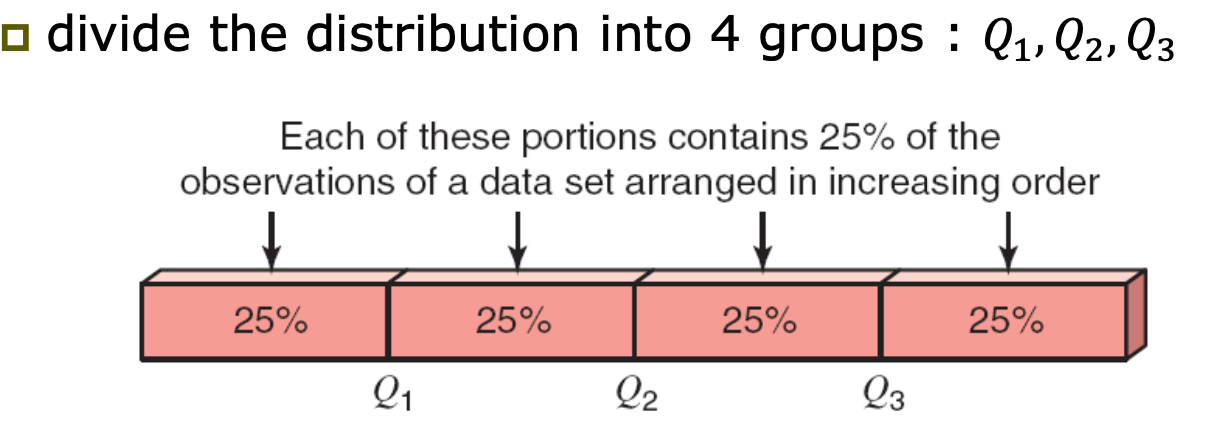
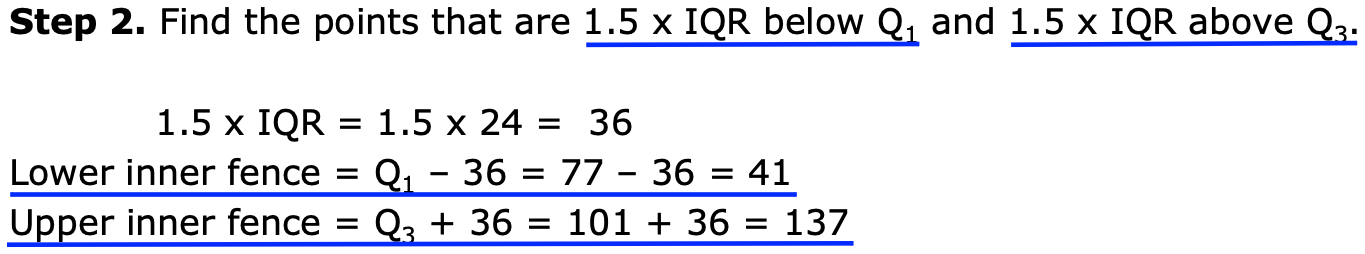
IQR ( Interquarile Range )
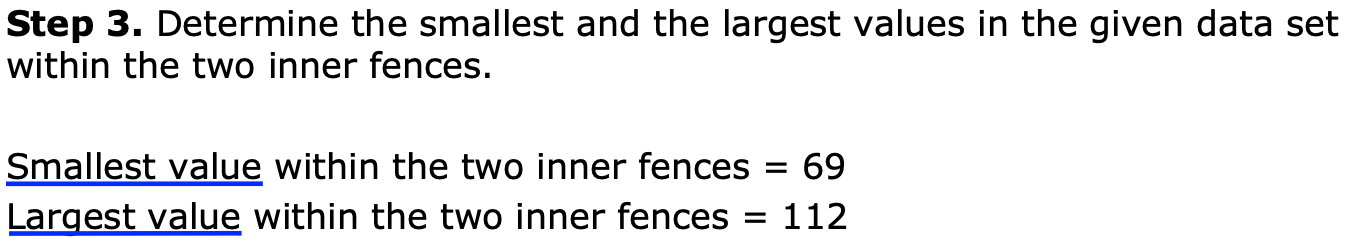
Outlier ( 이상값 )
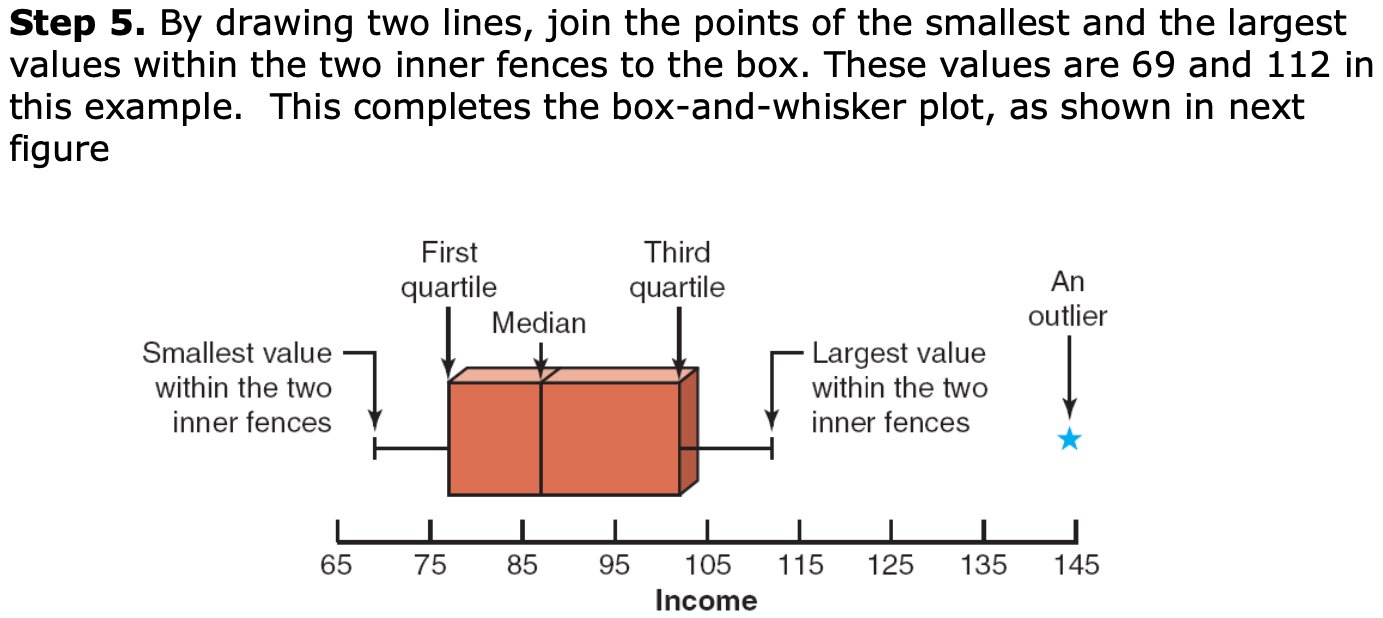
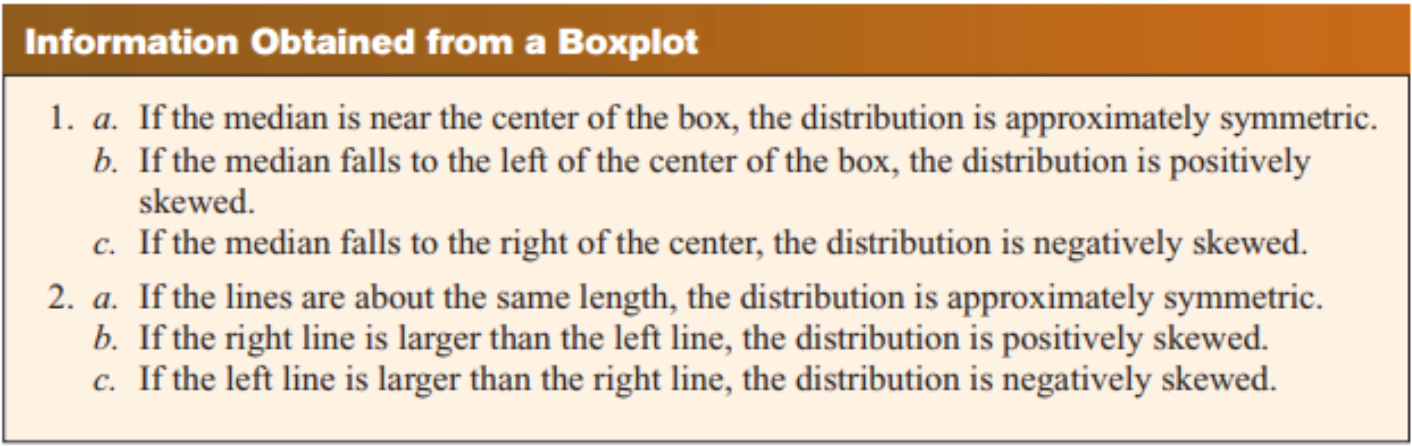
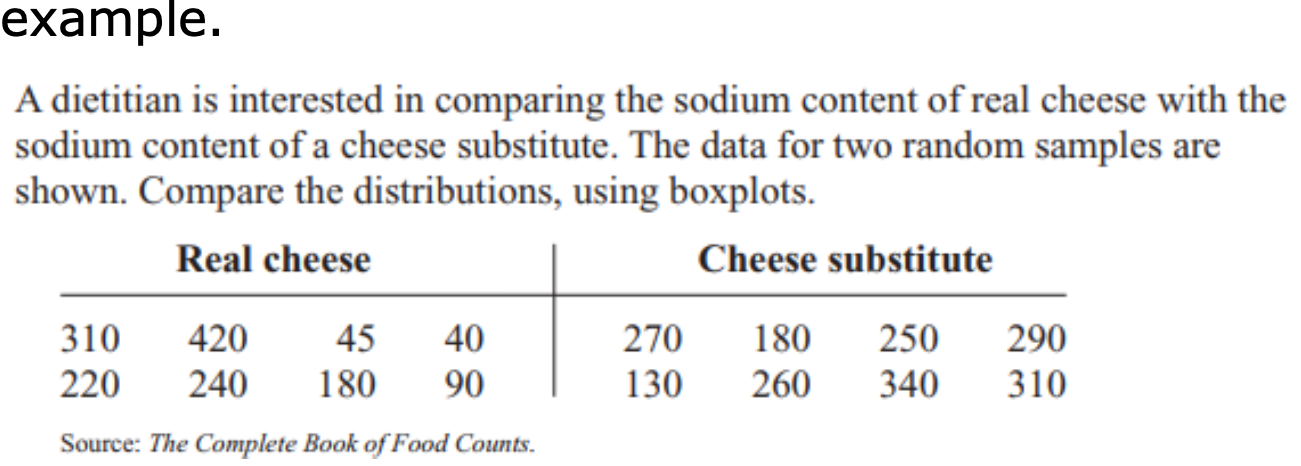
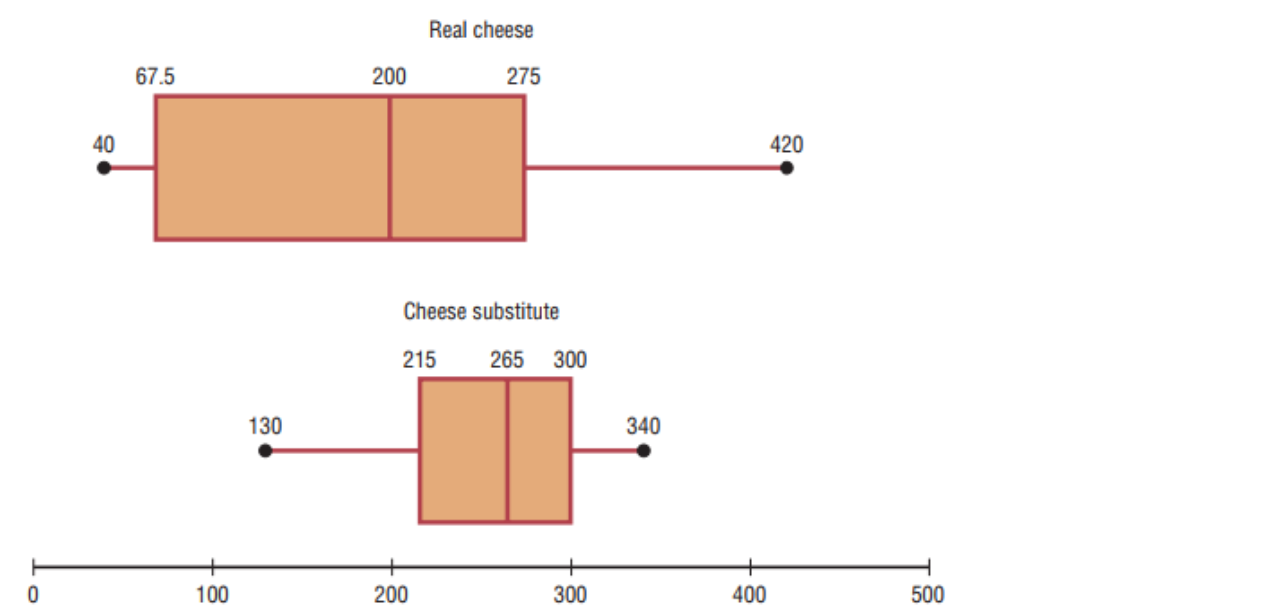
Exploratory Data Analysis (EDA)
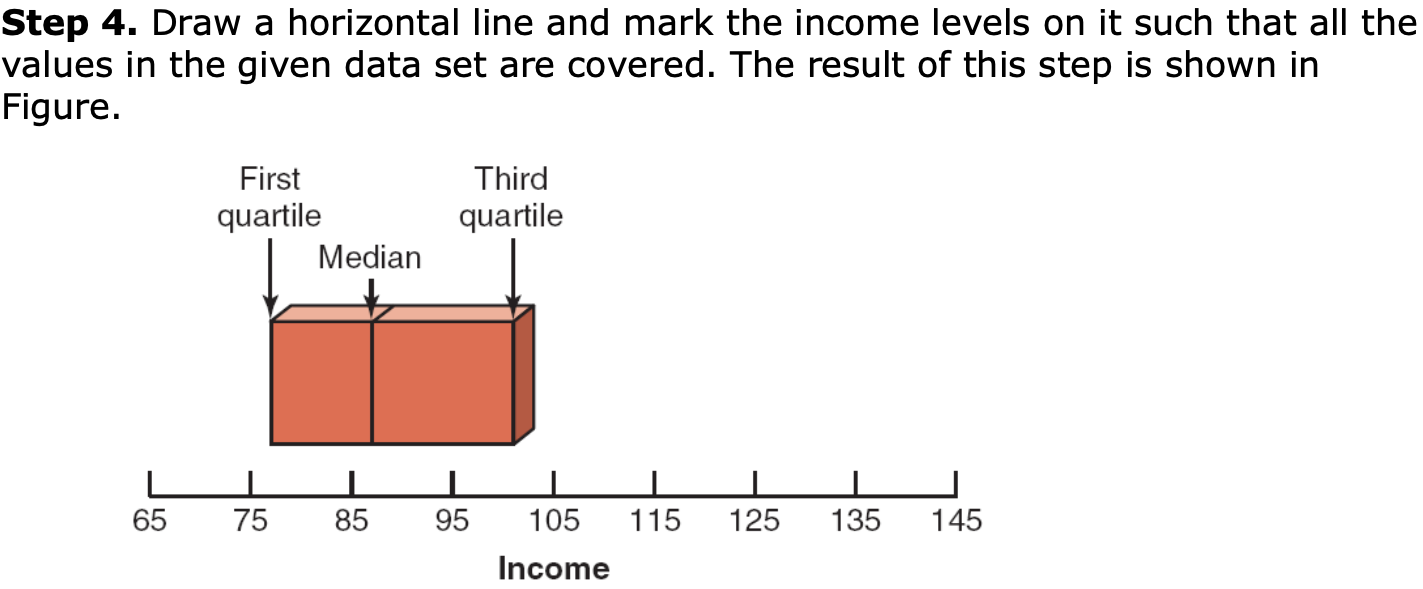
- 5-number summary & Boxplots
- min, , , , max
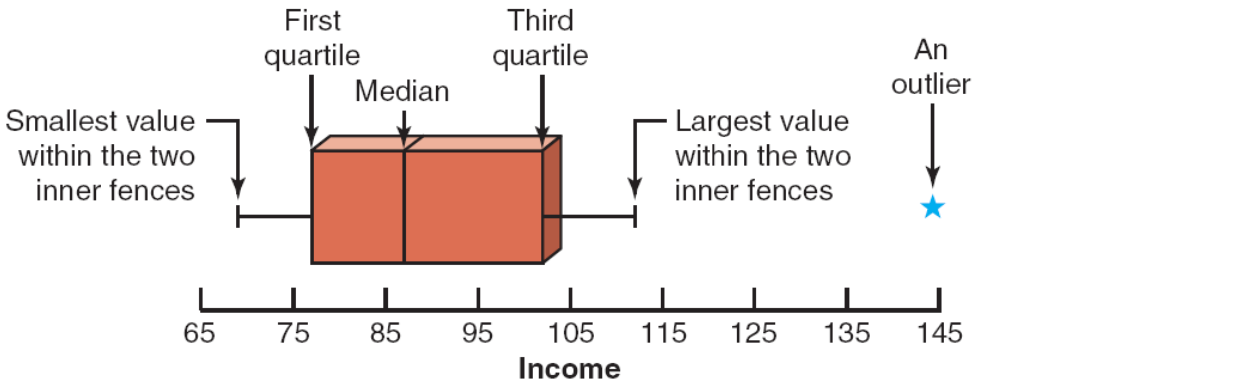
- min, , , , max
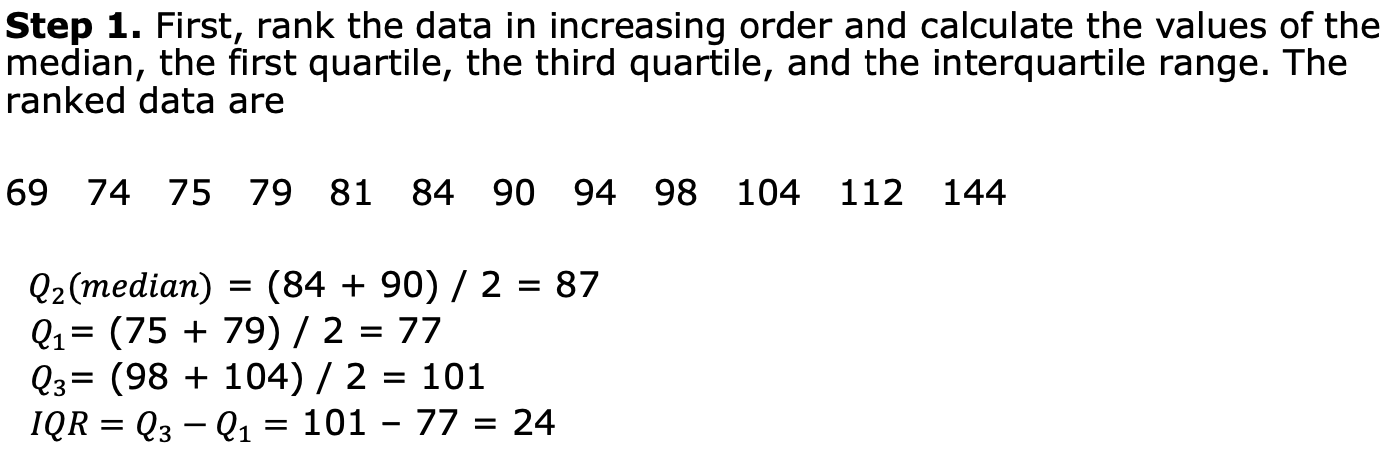
- Ex_
75 69 84 112 74 104 81 90 94 144 79 98
Construct a box-and-whisker plot for these data.
HGU GLS학부 김헌주 교수님의 23-2 통계학 수업을 듣고 작성한 포스트이며, 첨부한 모든 사진은 교수님 수업 PPT의 사진 원본에 필기를 한 수정본입니다.

HGU - 개인 공부 기록용 블로그