ModelGenesis의 코드 중 일부입니다. 자세한 코드를 확인하시려면 아래의 주소에서 확인하세요.
ModelGenesis Github : https://github.com/MrGiovanni/ModelsGenesis/blob/master/pytorch/utils.py

- MRI data에 대해서 Data Augmentation을 하기 위해 non-linear transformation 방법 중 하나인 Bezier Curve를 이용하기 위해 작성한 코드 리뷰입니다.
- 필요한 부분(사용할 부분)만 발췌하여 메모할 예정입니다.
Bernstein_poly(i, n, t)
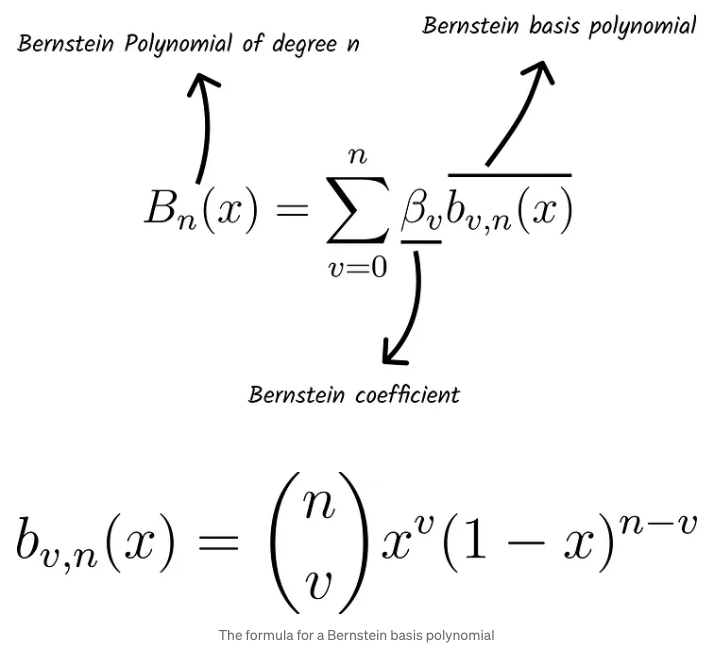
def bernstein_poly(i, n, t):
    """
     The Bernstein polynomial of n, i as a function of t
    """

return comb(n, i) * ( t**(n-i) ) * (1 - t)**i- Bernstein polynomial을 정의.
- t : 0~1 사이의 parameter로 점 사이의 비율을 의미
- n : 다항식의 차수
- i는 t의 function
bezier_curve(points, nTimes)
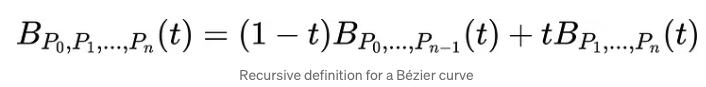
def bezier_curve(points, nTimes=1000):
    """
       Given a set of control points, return the
       bezier curve defined by the control points.

       Control points should be a list of lists, or list of tuples
       such as [ [1,1],
                 [2,3],
                 [4,5], ..[Xn, Yn] ]
        nTimes is the number of time steps, defaults to 1000

        See http://processingjs.nihongoresources.com/bezierinfo/
    """

    nPoints = len(points)
    xPoints = np.array([p[0] for p in points])
    yPoints = np.array([p[1] for p in points])

    t = np.linspace(0.0, 1.0, nTimes)

    polynomial_array = np.array([ bernstein_poly(i, nPoints-1, t) for i in range(0, nPoints)   ])

    xvals = np.dot(xPoints, polynomial_array)
    yvals = np.dot(yPoints, polynomial_array)

    return xvals, yvals
- nPoints = point의 수
- t = 닫힌 구간 [0, 1]에서 1000간격의 array
- polynomial_array = 모든 point에 대해서 bernstein 계산을 진행 후 결과를 저장한 array
- x_vals : x point 사이의 curve point를 계산
- y_vals : y point 사이의 curve point를 계산
nonlinear_transformation(x, prob)
def nonlinear_transformation(x, prob=0.5):
    if random.random() >= prob:
        return x
    points = [[0, 0], [random.random(), random.random()], [random.random(), random.random()], [1, 1]]
    xpoints = [p[0] for p in points]
    ypoints = [p[1] for p in points]
    xvals, yvals = bezier_curve(points, nTimes=100000)
    if random.random() < 0.5:
        # Half change to get flip
        xvals = np.sort(xvals)
    else:
        xvals, yvals = np.sort(xvals), np.sort(yvals)
    nonlinear_x = np.interp(x, xvals, yvals)
    return nonlinear_x
- 0.5의 확률로 nonlinear transformation을 실행해줌.
- [0, 0]과 [1, 1] 사이의 임의의 점 2개를 지정해서 bezier curve를 만듦
- 생성된 bezier curve와 input data x에 대해 interpolation을 하여 augmentation 진행

한양대학교 인공지능학과 대학원생 조권휘입니다.