
#PANDAS 개인 과제

#베이직 문항 (10개)
기본 함수 및 기능 1개만 가지고도 간단하게 처리할 수 있는 문제 : )
#1번 문제 : 데이터 불러오기
- 문제) pandas를 import한 다음 데이터를 불러와서 데이터를 확인하세요.
- 아래와 같은 코드를 이용하여 데이터를 불러옵니다.
- 이때 iris 변수에는 dataframe이 담기게 됩니다.
- 데이터를 눈으로 확인할 수 있으면 정답입니다.
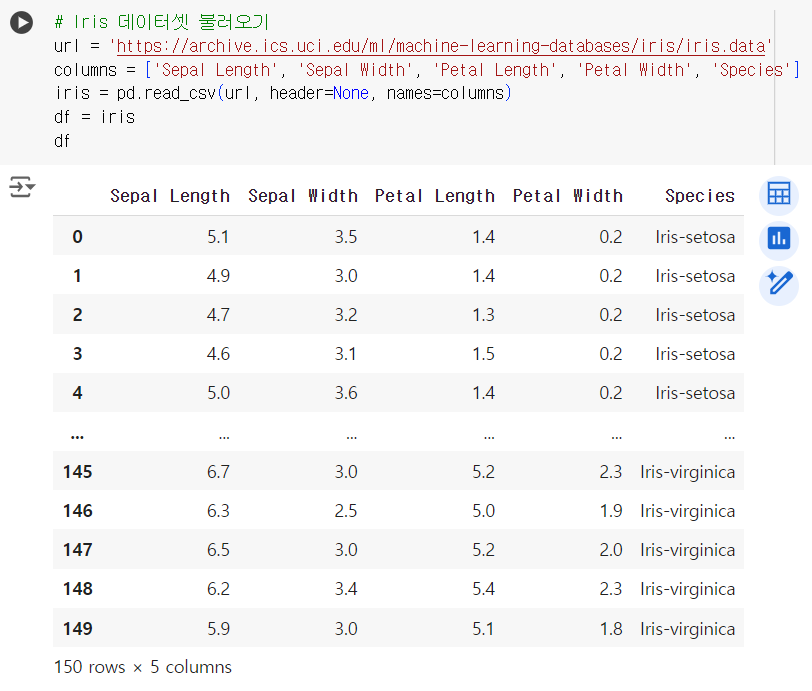
# Iris 데이터셋 불러오기
url = 'https://archive.ics.uci.edu/ml/machine-learning-databases/iris/iris.data'
columns = ['Sepal Length', 'Sepal Width', 'Petal Length', 'Petal Width', 'Species']
iris = pd.read_csv(url, header=None, names=columns)
# Iris 데이터셋 불러오기
url = 'https://archive.ics.uci.edu/ml/machine-learning-databases/iris/iris.data'
columns = ['Sepal Length', 'Sepal Width', 'Petal Length', 'Petal Width', 'Species']
iris = pd.read_csv(url, header=None, names=columns)
df = iris
df
+)
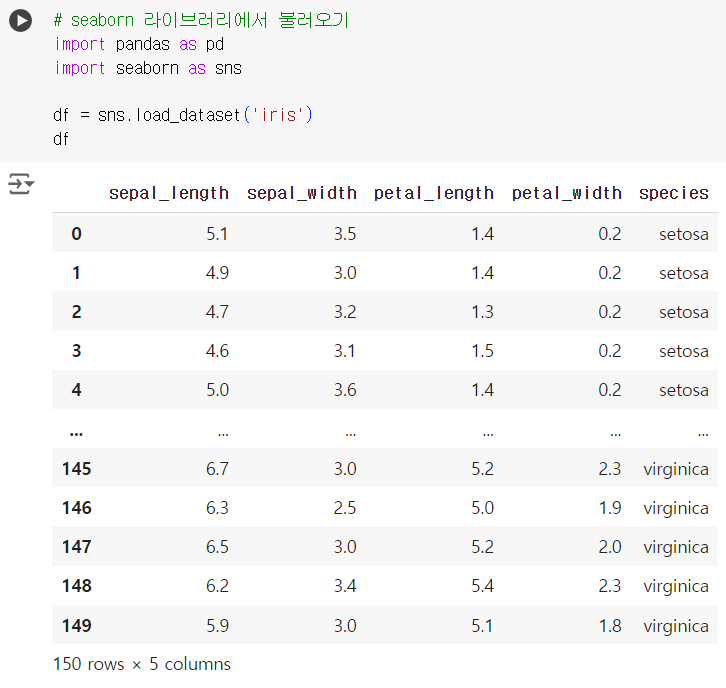
# seaborn 라이브러리에서 불러오기
import pandas as pd
import seaborn as sns
df = sns.load_dataset('iris')
df
#2번 문제 : 데이터 구조 파악하기
- 문제) 데이터셋의 첫 5행을 출력하고, 데이터의 구조를 파악하세요.
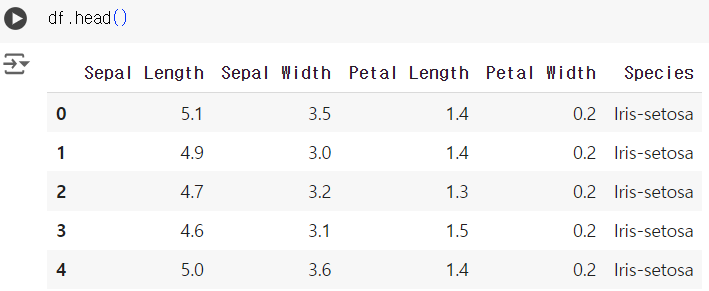
df.head()
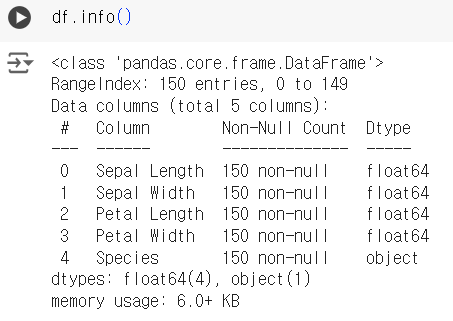
#3번 문제 : 데이터 요약 정보 확인하기
- 문제) 데이터셋의 요약 정보를 확인하세요.
df.info()
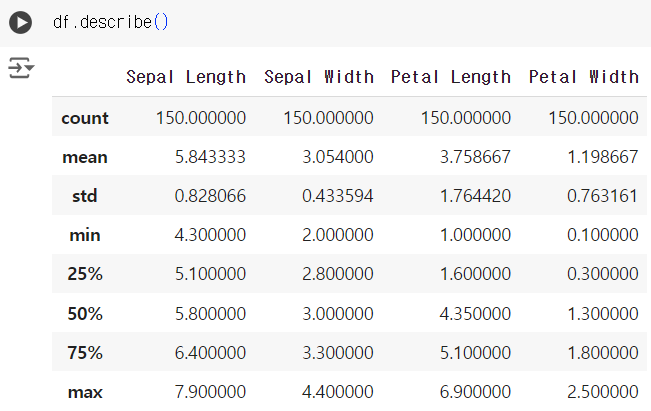
#4번 문제 : 기초 통계량 확인하기
- 문제) 각 열의 기초 통계량(평균, 표준편차, 최솟값, 최댓값 등)을 출력하세요.
df.describe()
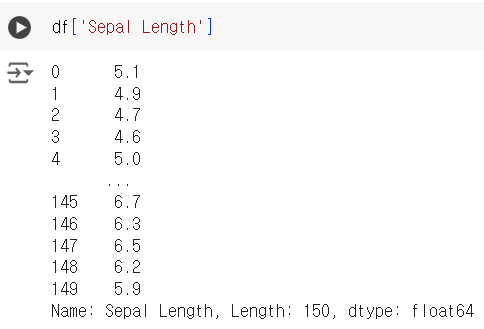
#5번 문제 : 특정 열 선택하기
- 문제) 'Sepal Length' 열만 선택하여 출력하세요.
df['Sepal Length']
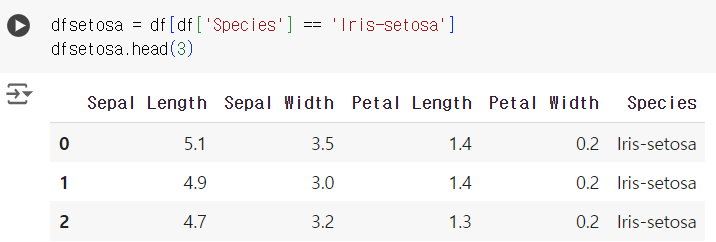
#6번 문제 : 조건에 맞는 데이터 필터링하기
- 문제) 'Species'가 'Iris-setosa'인 행들만 선택하여 새로운 데이터프레임을 만드세요.
dfsetosa = df[df['Species'] == 'Iris-setosa']
dfsetosa.head(3)
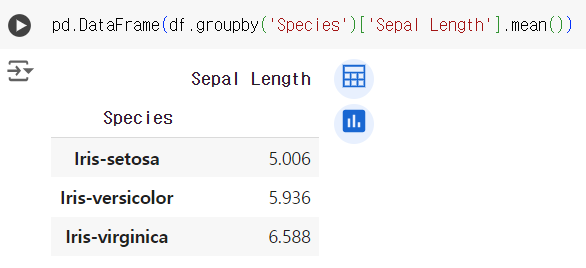
#7번 문제 : 그룹별 통계량 계산하기
- 문제) 각 품종('Species')별로 'Sepal Length'의 평균을 계산하세요.
pd.DataFrame(df.groupby('Species')['Sepal Length'].mean())
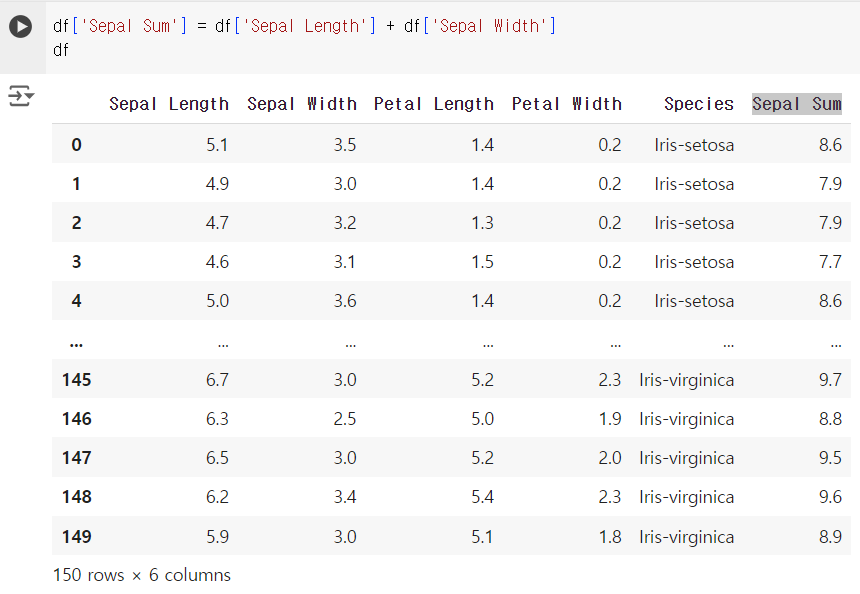
#8번 문제 : 새로운 열 추가하기
- 문제) 각 행의 'Sepal Length'와 'Sepal Width'의 합을 계산하여 새로운 열 'Sepal Sum'을 추가하세요.
df['Sepal Sum'] = df['Sepal Length'] + df['Sepal Width']
df
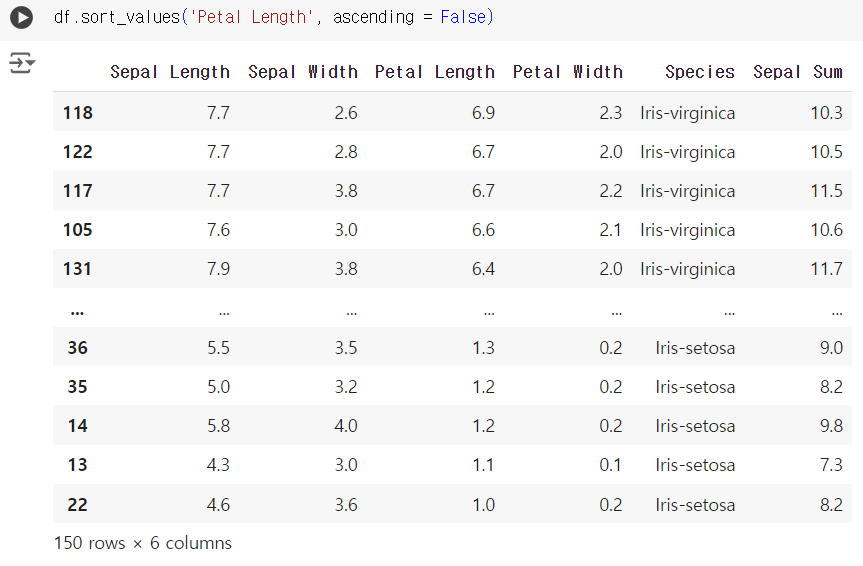
#9번 문제 : 데이터 정렬하기
- 문제) 'Petal Length' 기준으로 데이터프레임을 내림차순으로 정렬하세요.
df.sort_values('Petal Length', ascending = False)
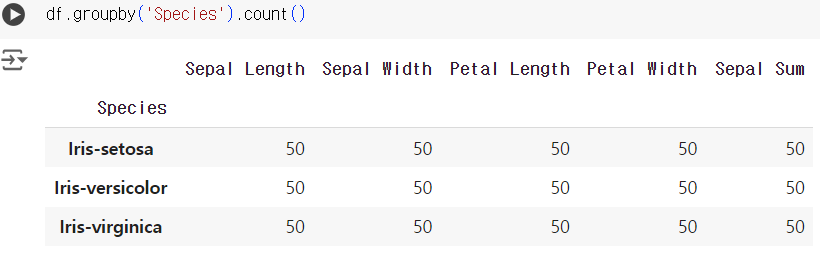
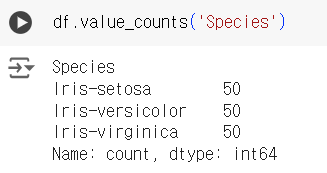
#10번 문제 : 특정 값 세기
- 문제) 각 품종('Species')별로 몇 개의 샘플이 있는지 세어보세요.
df.groupby('Species').count()
df.value_counts('Species')
#챌린지 문항 (10개)
두 개 이상의 함수 및 기능을 사용하거나 데이터 분석하는 관점에서 접근해야 하는 문제
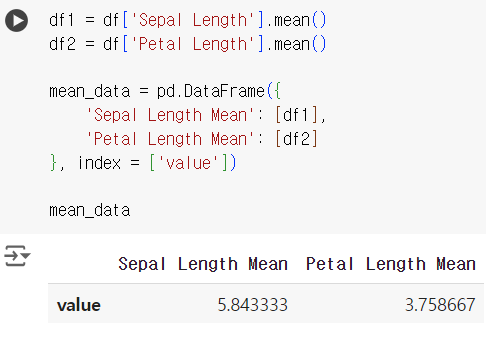
#11번 문제 : 데이터 결합하기
- 문제) 'Sepal Length'와 'Petal Length'의 평균을 계산한 후, 이를 새로운 데이터프레임으로 결합하세요.
df1 = df['Sepal Length'].mean()
df2 = df['Petal Length'].mean()
mean_data = pd.DataFrame({
    'Sepal Length Mean': [df1],
    'Petal Length Mean': [df2]
}, index = ['value'])
mean_data
#12번 문제 : 피벗 테이블 만들기
-
문제) 각 품종별 'Sepal Length'와 'Petal Length'의 평균을 피벗 테이블로 만들어 보세요.
-
aggfunc =
pivot_table = df.pivot_table(index='Species', values=['Sepal Length', 'Petal Length'], aggfunc='mean')
print(pivot_table)
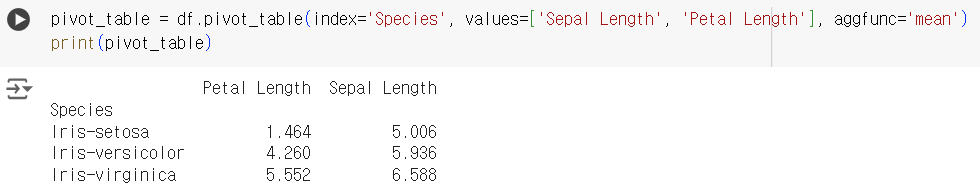
- 품종별 평균 테이블
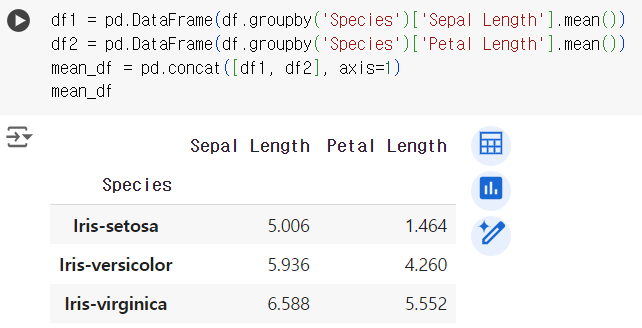
df1 = pd.DataFrame(df.groupby('Species')['Sepal Length'].mean())
df2 = pd.DataFrame(df.groupby('Species')['Petal Length'].mean())
mean_df = pd.concat([df1, df2], axis=1)
mean_df
#13번 문제 : 결측값 처리
- 문제) 'Sepal Width' 열에 임의로 결측값을 10개 추가하고, 결측값을 처리하는 방법을 두 가지 이상 적용해 보세요.
- 참고) 현재 데이터에는 결측값이 없으므로 아래와 같은 코드를 통해 임의의 결측값을 만든 dataframe을 사용하세요.
(numpy의 random 함수를 사용하기 때문에 사람마다 결측값 index의 위치가 다를 수 있습니다)
import numpy as np
# 임의로 결측값 10개 추가
iris_with_nan = iris.copy()
iris_with_nan.loc[np.random.choice(iris_with_nan.index, 10), 'Sepal Width'] = np.nan
dfn = iris_with_nan
# 결측값 처리1 (삭제)
print(dfn.isnull().sum())
dfn = dfn.dropna(subset = 'Sepal Width')
print(dfn.isnull().sum())
# 임의로 결측값 10개 추가
iris_with_nan = iris.copy()
iris_with_nan.loc[np.random.choice(iris_with_nan.index, 10), 'Sepal Width'] = np.nan
dfn = iris_with_nan
# 결측값 처리2 (대체)
print(dfn.isnull().sum())
dfn = dfn.fillna(0)
print(dfn.isnull().sum())

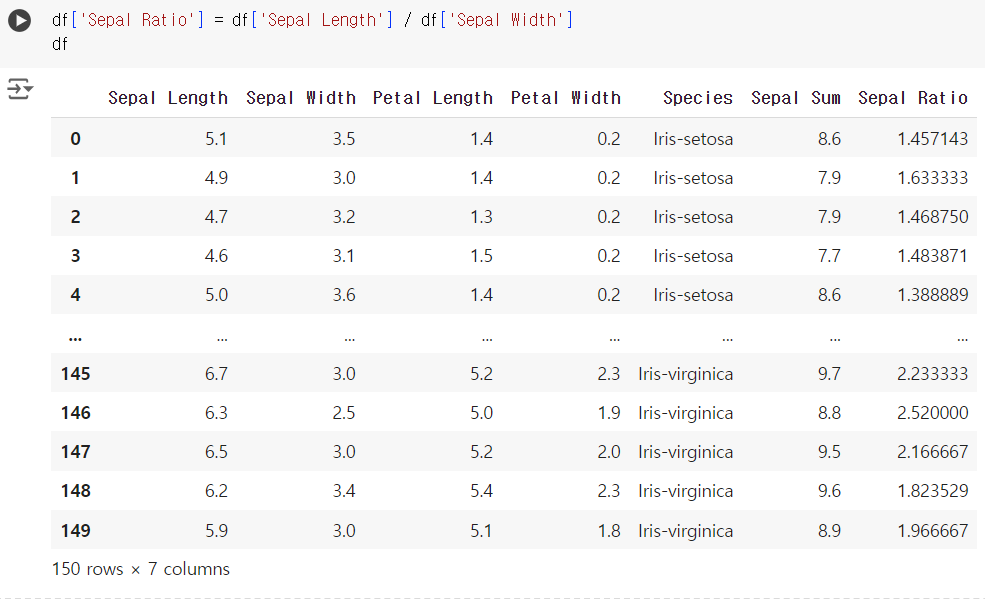
#14번 문제 : 데이터 변형
- 문제) 'Sepal Length'와 'Sepal Width'의 비율을 계산하여 새로운 열 'Sepal Ratio'를 추가하세요.
df['Sepal Ratio'] = df['Sepal Length'] / df['Sepal Width']
df
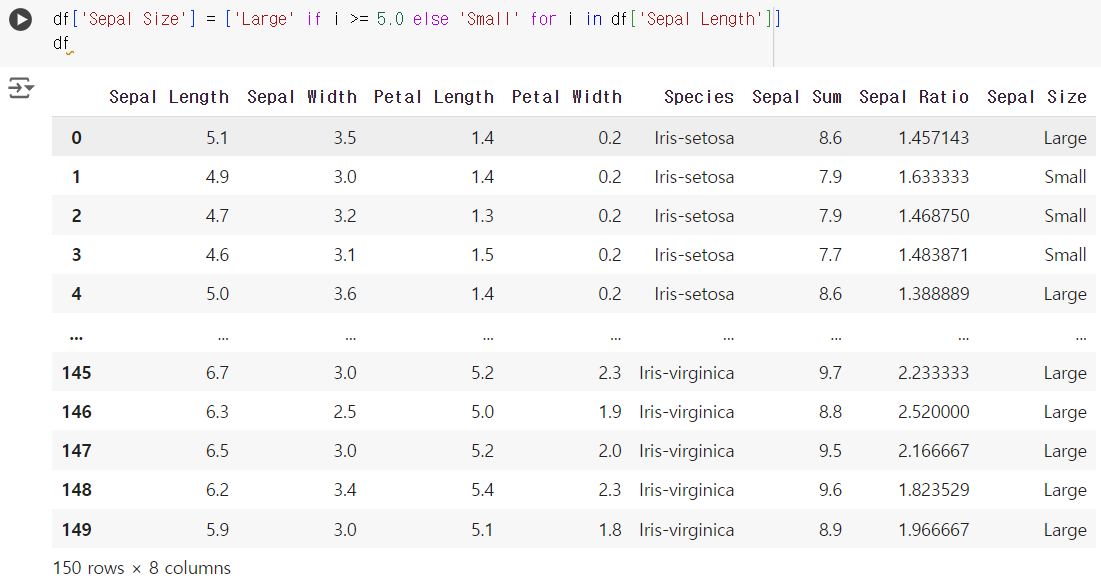
#15번 문제 : 특정 조건에 따른 새로운 열 생성
- 문제) 'Sepal Length'가 5.0 이상인 경우 'Large', 미만인 경우 'Small'을 값으로 가지는 새로운 열 'Sepal Size'를 생성하세요.
df['Sepal Size'] = ['Large' if i >= 5.0 else 'Small' for i in df['Sepal Length']]
df
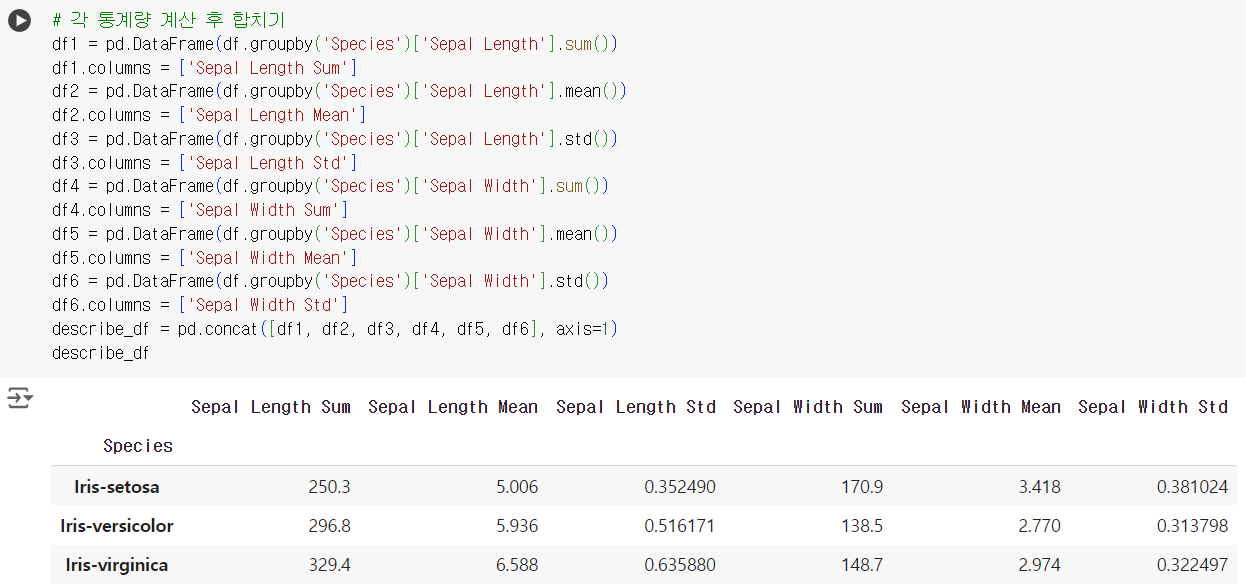
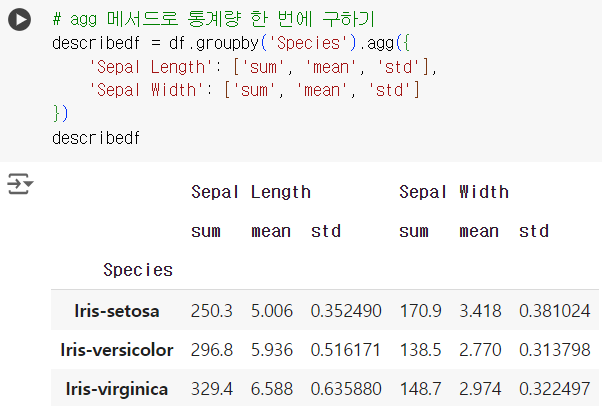
#16번 문제 : 다양한 통계량 계산
- 문제) 각 품종(Species)별로 'Sepal Length'와 'Sepal Width'의 합계, 평균, 표준편차를 계산하세요.
# 각 통계량 계산 후 합치기
df1 = pd.DataFrame(df.groupby('Species')['Sepal Length'].sum())
df1.columns = ['Sepal Length Sum']
df2 = pd.DataFrame(df.groupby('Species')['Sepal Length'].mean())
df2.columns = ['Sepal Length Mean']
df3 = pd.DataFrame(df.groupby('Species')['Sepal Length'].std())
df3.columns = ['Sepal Length Std']
df4 = pd.DataFrame(df.groupby('Species')['Sepal Width'].sum())
df4.columns = ['Sepal Width Sum']
df5 = pd.DataFrame(df.groupby('Species')['Sepal Width'].mean())
df5.columns = ['Sepal Width Mean']
df6 = pd.DataFrame(df.groupby('Species')['Sepal Width'].std())
df6.columns = ['Sepal Width Std']
describe_df = pd.concat([df1, df2, df3, df4, df5, df6], axis=1)
describe_df
# agg 메서드로 통계량 한 번에 구하기
describedf = df.groupby('Species').agg({
    'Sepal Length': ['sum', 'mean', 'std'],
    'Sepal Width': ['sum', 'mean', 'std']
})
describedf
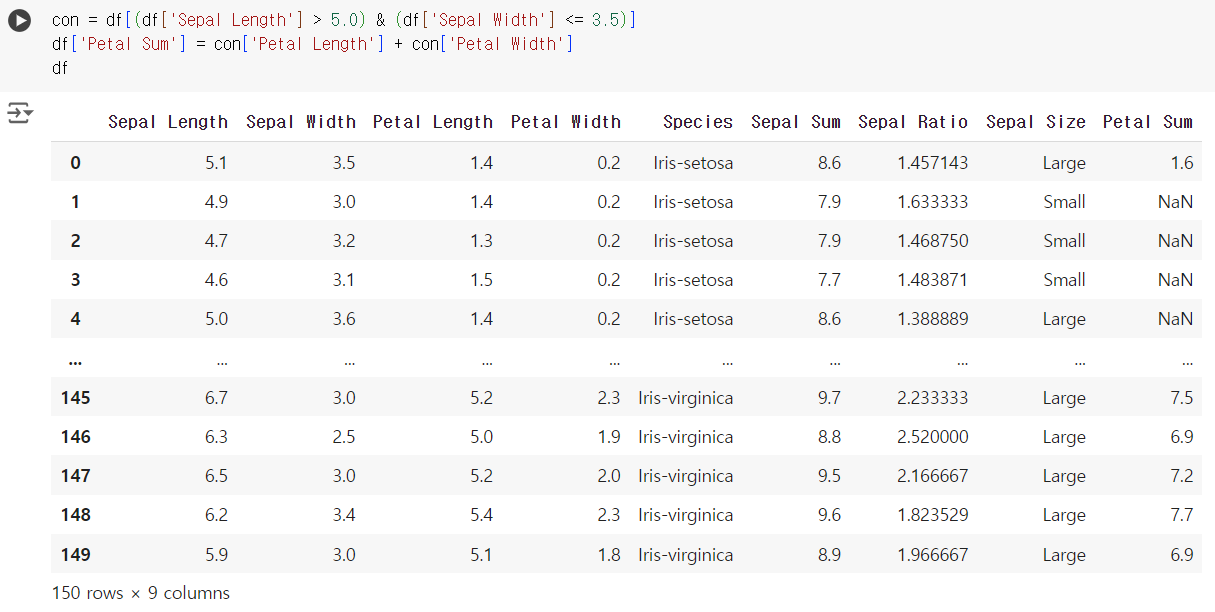
#17번 문제 : 복잡한 조건 필터링
- 문제) 'Sepal Length'가 5.0 이상이고 'Sepal Width'가 3.5 이하인 데이터만 선택하고, 이 데이터의 'Petal Length'와 'Petal Width'의 합을 새로운 열 'Petal Sum'으로 추가하세요.
con = df[(df['Sepal Length'] > 5.0) & (df['Sepal Width'] <= 3.5)]
df['Petal Sum'] = con['Petal Length'] + con['Petal Width']
df
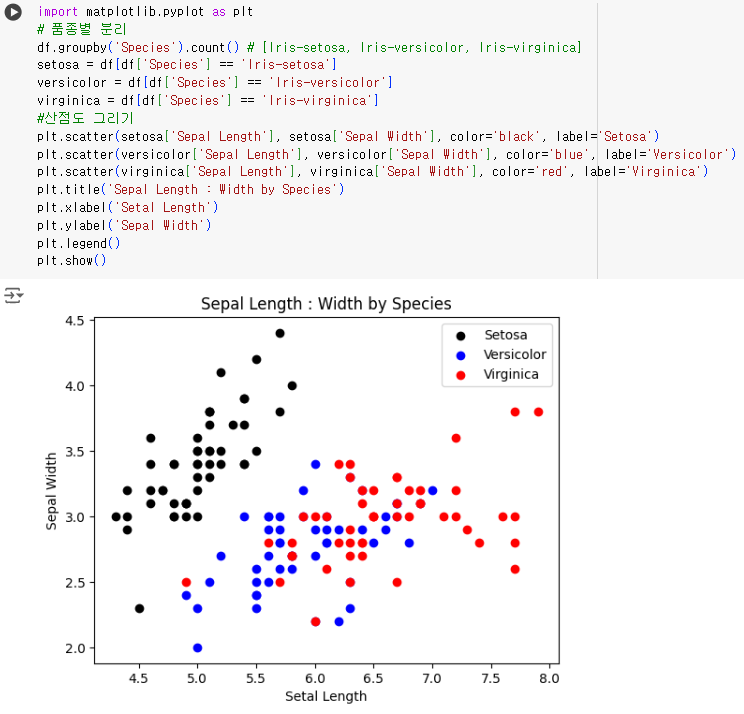
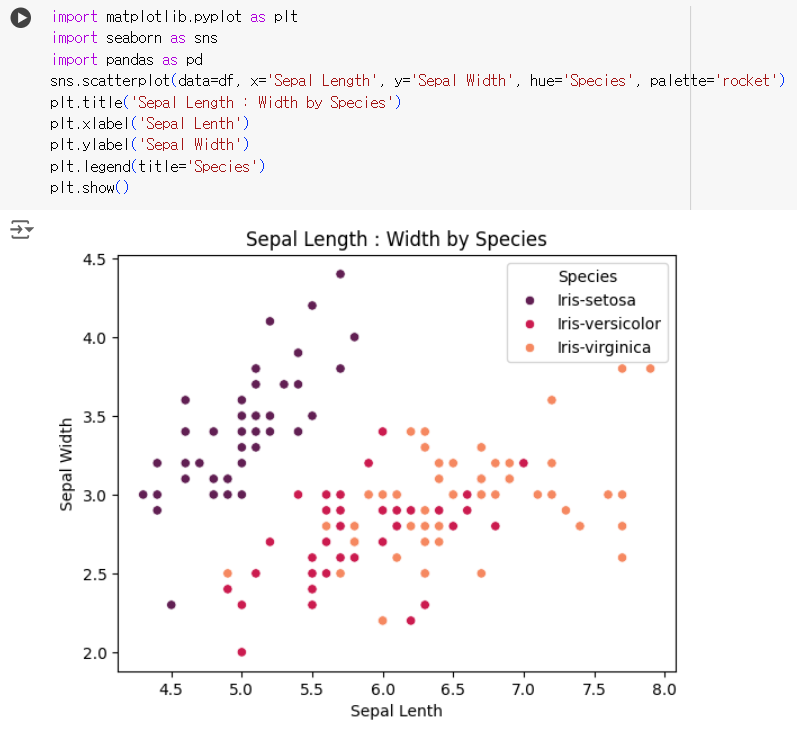
#18번 문제 : 산점도 그리기
- 문제) 'Sepal Length'와 'Sepal Width'의 관계를 나타내는 산점도를 그리세요. 각 품종별로 다른 색상을 사용하세요.
import matplotlib.pyplot as plt
# 품종별 분리
df.groupby('Species').count() # [Iris-setosa, Iris-versicolor, Iris-virginica]
setosa = df[df['Species'] == 'Iris-setosa']
versicolor = df[df['Species'] == 'Iris-versicolor']
virginica = df[df['Species'] == 'Iris-virginica']
#산점도 그리기
plt.scatter(setosa['Sepal Length'], setosa['Sepal Width'], color='black', label='Setosa')
plt.scatter(versicolor['Sepal Length'], versicolor['Sepal Width'], color='blue', label='Versicolor')
plt.scatter(virginica['Sepal Length'], virginica['Sepal Width'], color='red', label='Virginica')
plt.title('Sepal Length : Width by Species')
plt.xlabel('Setal Length')
plt.ylabel('Sepal Width')
plt.legend()
plt.show()
# seaborn 라이브러리의 scatterplot을 사용해서
# hue = '칼럼' 인자를 사용하면 해당 컬럼의 고유값들을 다르게 표현해준다!!
import matplotlib.pyplot as plt
import seaborn as sns
import pandas as pd
sns.scatterplot(data=df, x='Sepal Length', y='Sepal Width', hue='Species', palette='rocket')
plt.title('Sepal Length : Width by Species')
plt.xlabel('Sepal Lenth')
plt.ylabel('Sepal Width')
plt.legend(title='Species')
plt.show()
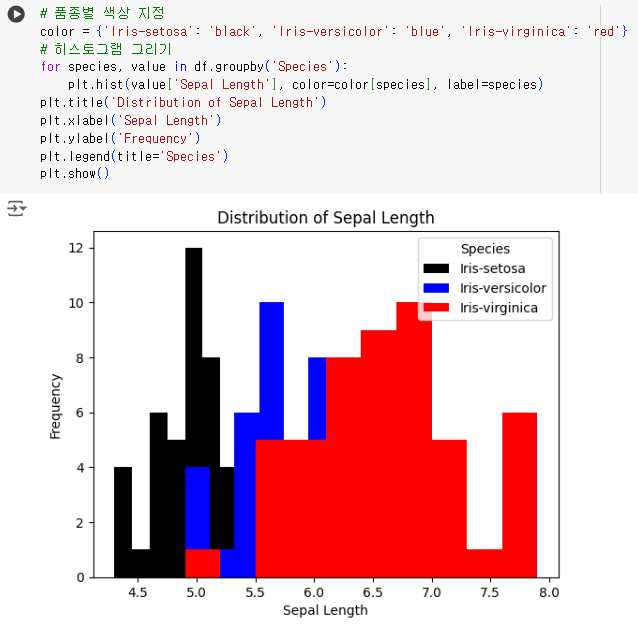
#19번 문제 : 히스토그램 그리기
- 문제) 'Sepal Length'의 분포를 나타내는 히스토그램을 그리세요. 각 품종별로 다른 색상을 사용하세요.
# 품종별 색상 지정
color = {'Iris-setosa': 'black', 'Iris-versicolor': 'blue', 'Iris-virginica': 'red'}
# 히스토그램 그리기
for species, value in df.groupby('Species'):
    plt.hist(value['Sepal Length'], color=color[species], label=species)
plt.title('Distribution of Sepal Length')
plt.xlabel('Sepal Length')
plt.ylabel('Frequency')
plt.legend(title='Species')
plt.show()
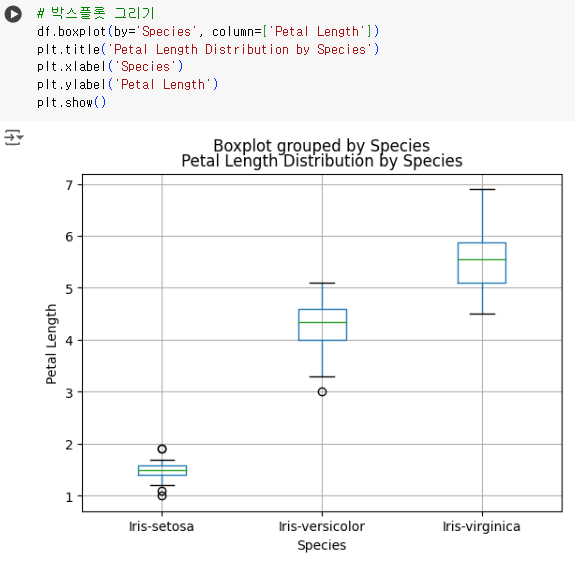
#20번 문제 : 박스플롯 그리기
- 문제) 각 품종별로 'Petal Length'의 분포를 나타내는 박스플롯을 그리세요.
# 박스플롯 그리기
df.boxplot(by='Species', column=['Petal Length'])
plt.title('Petal Length Distribution by Species')
plt.xlabel('Species')
plt.ylabel('Petal Length')
plt.show()

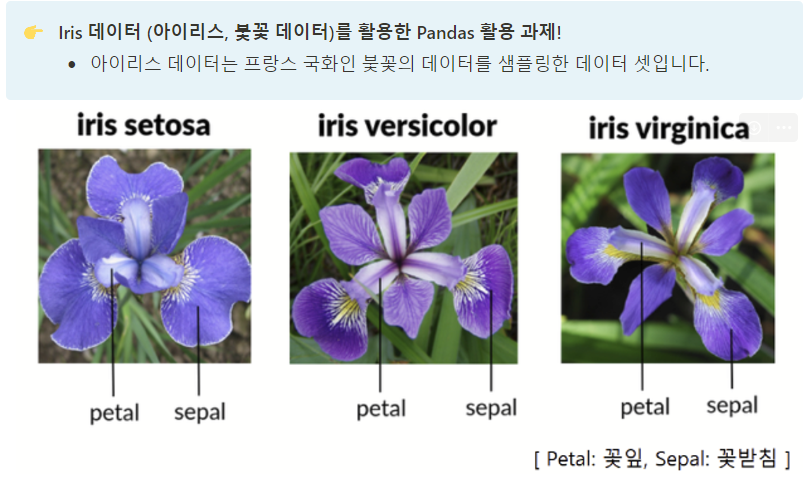
커피 좋아하는 데이터 꿈나무