
#INTRO
좋은 생각좋은 생각좋은 생각좋은 생각좋은 생각

#코드카타
-
PYTHON
-
시간 변환 함수
- "HH" 형식의 시간을 분 단위로 변환하는
time_to_minutes(time)함수 생성
- "HH" 형식의 시간을 분 단위로 변환하는
def time_to_minutes(time):
    hours, minutes = map(int, time.split(":"))
return hours * 60 + minutes- 예약 시간 변환 및 정렬
- 주어진 예약 시간을 시작 시간과 종료 시간(청소시간 10분 포함)으로 변환한 후,
bookings리스트에 저장 - 예약을 시작 시간 기준으로 정렬
- 주어진 예약 시간을 시작 시간과 종료 시간(청소시간 10분 포함)으로 변환한 후,
bookings = []
for start, end in book_time:
    start_time = time_to_minutes(start)
    end_time = time_to_minutes(end) + 10
    bookings.append((start_time, end_time))
bookings.sort()- 힙을 이용한 객실 관리
- 객실의 종료 시간을 관리하는 최소 힙
rooms를 사용 - 각 예약의 시작 시간과 종료 시간을 순회하면서,
현재 시작 시간 전에 종료되는 객실이 있으면 해당 객실을 재사용하고,
그렇지 않으면 새로운 객실이 필요 - 현재 예약의 종료 시간을 힙에 추가하여,
새로운 객실 또는 재사용된 객실의 종료 시간을 갱신
- 객실의 종료 시간을 관리하는 최소 힙
rooms = []

for start, end in bookings:
	# 힙이 비어 있지 않고(rooms),
    # 힙의 최솟값(rooms[0], 즉 가장 빨리 끝나는 객실의 종료 시간)이
    # 현재 예약의 시작 시간(start)보다 작거나 같으면, 객실 재사용
	# heappop(rooms)를 통해 가장 빨리 끝나는 객실의 종료 시간을 힙에서 제거,
    # 해당 객실이 새로운 예약에 재사용된 것을 의미
    if rooms and rooms[0] <= start:
        heappop(rooms)
    heappush(rooms, end)
- 최소 힙(우선순위 큐) : 최소 힙을 사용하여 항상 가장 빨리 끝나는 객실의 종료 시간을 쉽게 접근할 수 있다.
- 객실 재사용 : 현재 예약의 시작 시간 전에 종료되는 객실이 있다면 해당 객실을 재사용한다.
- 종료 시간 갱신 : 현재 예약의 종료 시간을 힙에 추가하여, 새로운 객실 또는 재사용된 객실의 종료 시간을 갱신한다.
- 결과 반환
- 필요한 객실의 수는 힙에 남아있는 종료 시간의 수와 동일
return len(rooms)#커머스 데이터 분석 실무 (라이브 세션)
#최종 프로젝트 진행
- 고객 분류 시도 (RFM 분석)
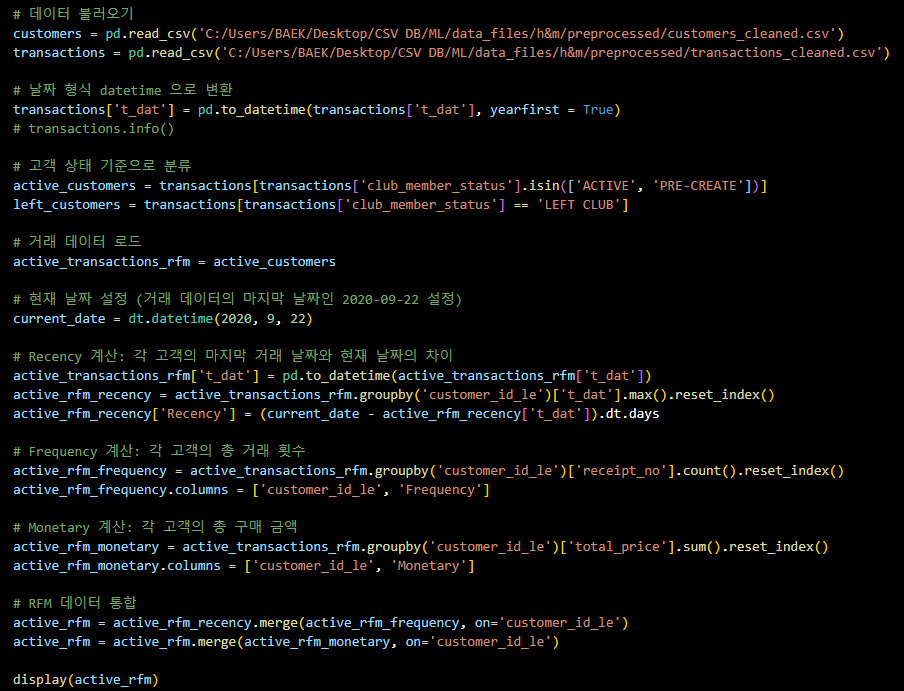
# 데이터 불러오기
customers = pd.read_csv('C:/Users/BAEK/Desktop/CSV DB/ML/data_files/h&m/preprocessed/customers_cleaned.csv')
transactions = pd.read_csv('C:/Users/BAEK/Desktop/CSV DB/ML/data_files/h&m/preprocessed/transactions_cleaned.csv')
# 날짜 형식 datetime 으로 변환
transactions['t_dat'] = pd.to_datetime(transactions['t_dat'], yearfirst = True)
# transactions.info()
# 고객 상태 기준으로 분류
active_customers = transactions[transactions['club_member_status'].isin(['ACTIVE', 'PRE-CREATE'])]
left_customers = transactions[transactions['club_member_status'] == 'LEFT CLUB']
# 거래 데이터 로드
active_transactions_rfm = active_customers
# 현재 날짜 설정 (거래 데이터의 마지막 날짜인 2020-09-22 설정)
current_date = dt.datetime(2020, 9, 22)
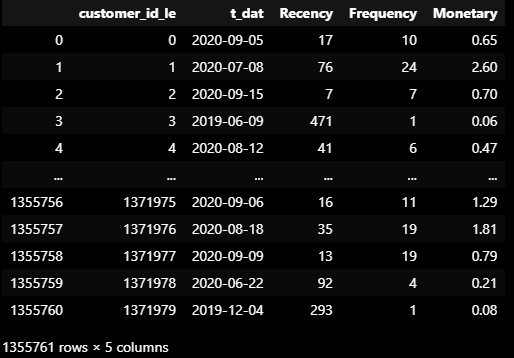
# Recency 계산: 각 고객의 마지막 거래 날짜와 현재 날짜의 차이
active_transactions_rfm['t_dat'] = pd.to_datetime(active_transactions_rfm['t_dat'])
active_rfm_recency = active_transactions_rfm.groupby('customer_id_le')['t_dat'].max().reset_index()
active_rfm_recency['Recency'] = (current_date - active_rfm_recency['t_dat']).dt.days
# Frequency 계산: 각 고객의 총 거래 횟수
active_rfm_frequency = active_transactions_rfm.groupby('customer_id_le')['receipt_no'].count().reset_index()
active_rfm_frequency.columns = ['customer_id_le', 'Frequency']
# Monetary 계산: 각 고객의 총 구매 금액
active_rfm_monetary = active_transactions_rfm.groupby('customer_id_le')['total_price'].sum().reset_index()
active_rfm_monetary.columns = ['customer_id_le', 'Monetary']
# RFM 데이터 통합
active_rfm = active_rfm_recency.merge(active_rfm_frequency, on='customer_id_le')
active_rfm = active_rfm.merge(active_rfm_monetary, on='customer_id_le')
display(active_rfm)RFM 계산 결과
- 고객 분류 기준 :
club_member_status의 상태가ACTIVE, PRE-CREATE인 고객을
정상 활동 상태의 고객으로 판단하고 해당 고객들을 RFM 분석을 통한 분류 시도

- 사분위수 기준 RFM 세그먼트 시도
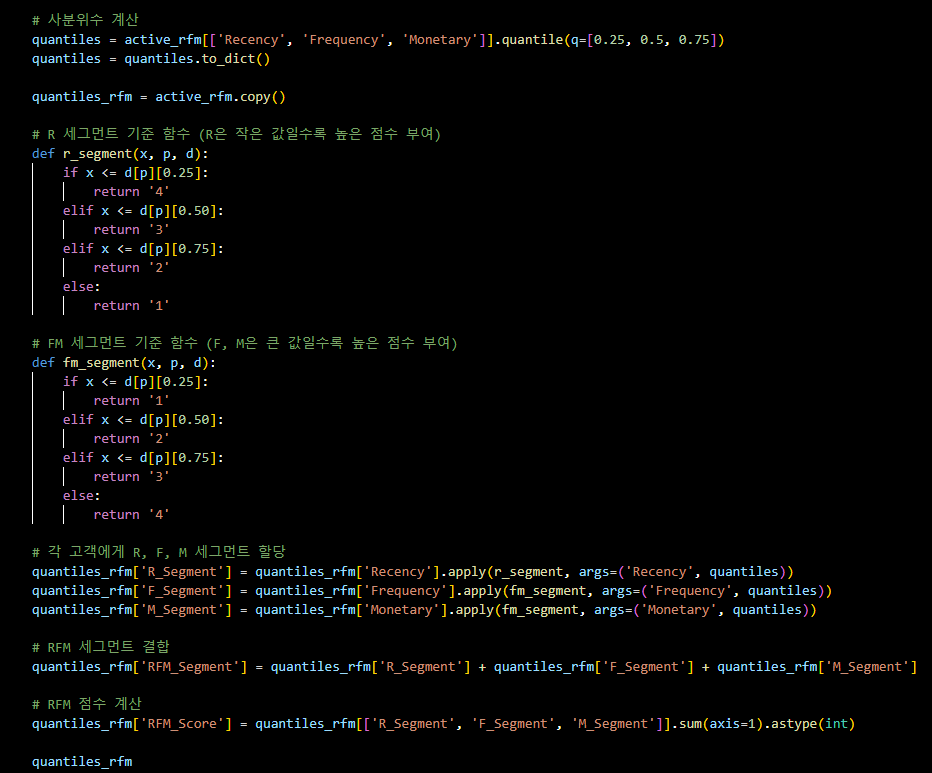
# 사분위수 계산
quantiles = active_rfm[['Recency', 'Frequency', 'Monetary']].quantile(q=[0.25, 0.5, 0.75])
quantiles = quantiles.to_dict()
quantiles_rfm = active_rfm.copy()
# R 세그먼트 기준 함수 (R은 작은 값일수록 높은 점수 부여)
def r_segment(x, p, d):
if x <= d[p][0.25]:
return '4'
elif x <= d[p][0.50]:
return '3'
elif x <= d[p][0.75]:
return '2'
else:
return '1'
# FM 세그먼트 기준 함수 (F, M은 큰 값일수록 높은 점수 부여)
def fm_segment(x, p, d):
if x <= d[p][0.25]:
return '1'
elif x <= d[p][0.50]:
return '2'
elif x <= d[p][0.75]:
return '3'
else:
return '4'
# 각 고객에게 R, F, M 세그먼트 할당
quantiles_rfm['R_Segment'] = quantiles_rfm['Recency'].apply(r_segment, args=('Recency', quantiles))
quantiles_rfm['F_Segment'] = quantiles_rfm['Frequency'].apply(fm_segment, args=('Frequency', quantiles))
quantiles_rfm['M_Segment'] = quantiles_rfm['Monetary'].apply(fm_segment, args=('Monetary', quantiles))
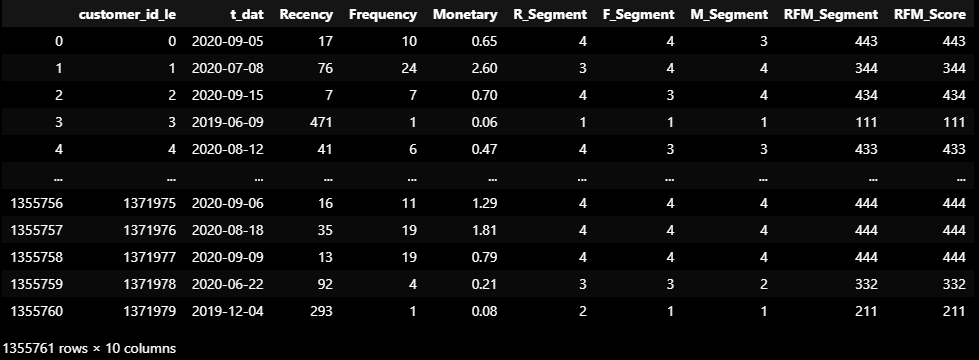
# RFM 세그먼트 결합
quantiles_rfm['RFM_Segment'] = quantiles_rfm['R_Segment'] + quantiles_rfm['F_Segment'] + quantiles_rfm['M_Segment']
# RFM 점수 계산
quantiles_rfm['RFM_Score'] = quantiles_rfm[['R_Segment', 'F_Segment', 'M_Segment']].sum(axis=1).astype(int)
quantiles_rfmRFM 분류 결과
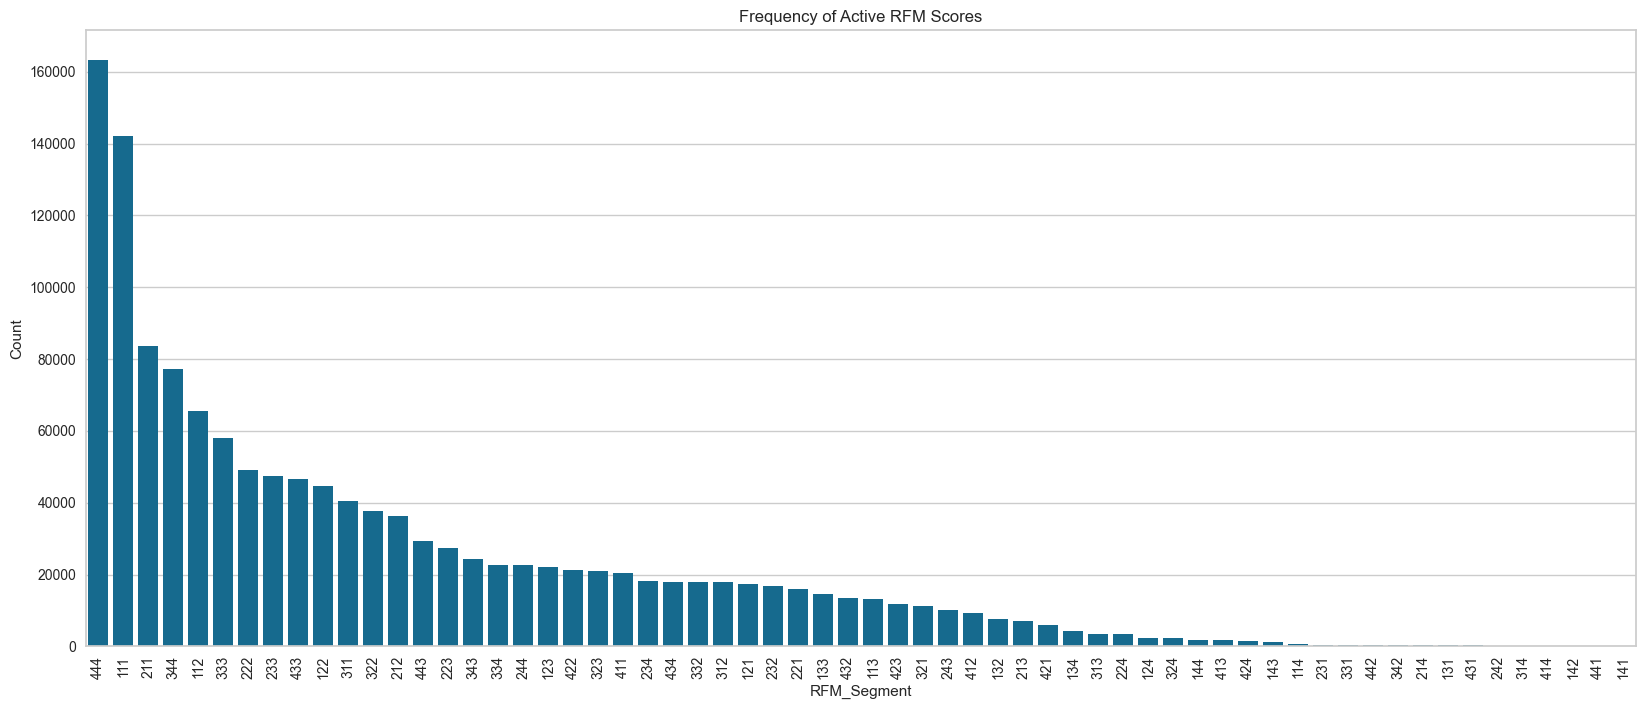
- RFM 시각화
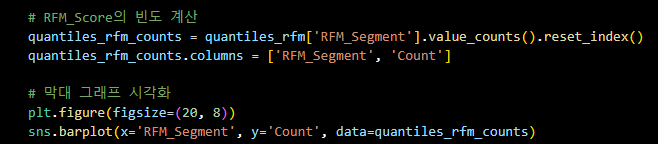
# RFM_Score의 빈도 계산
quantiles_rfm_counts = quantiles_rfm['RFM_Segment'].value_counts().reset_index()
quantiles_rfm_counts.columns = ['RFM_Segment', 'Count']

# 막대 그래프 시각화
plt.figure(figsize=(20, 8))
sns.barplot(x='RFM_Segment', y='Count', data=quantiles_rfm_counts)
plt.title('Frequency of Left RFM Scores')
plt.xlabel('RFM_Segment')
plt.ylabel('Count')
plt.xticks(rotation=90)
plt.show()
RFM 분포 시각화 결과
+) RFM 분석 간 등급을 부여하는 기준과 과정에 대한 의문
- Recency 점수, 등급 부여에 대한 기준을 어떻게 할 것인가?
- Recency 기준을 절대적 기준으로 나누는 것과 정량적 기준 (분포)로 나누는 것, 어떻게?
7일 단위 기준 분포
(4주차, 12주차, 42주차)에서 데이터가 튀는 구간에 대한 것을 기준으로 R 등급 나누기 시도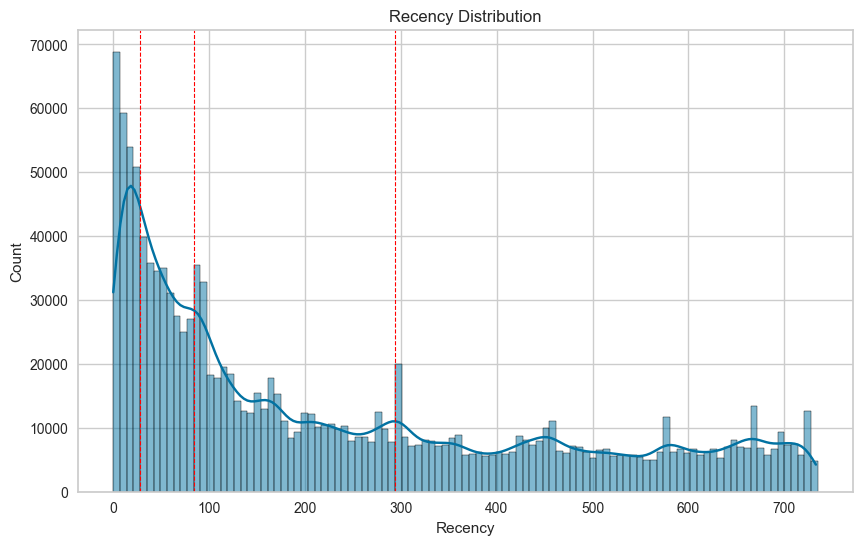
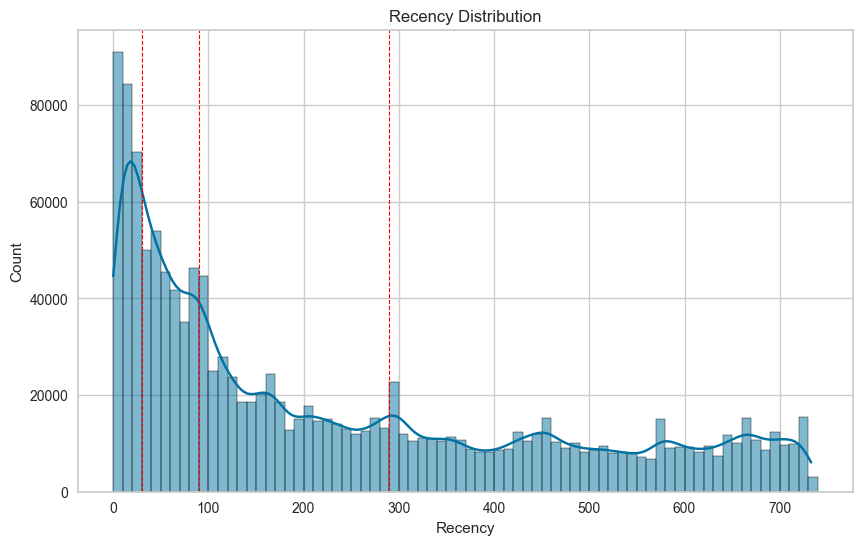
10일 단위 기준 분포
(30일, 90일, 290일)에서 데이터가 튀는 구간에 대한 것을 기준으로 R 등급 나누기 시도
POINT : RFM 분석
1. Recency 분석 시 Recency의 패턴(튀는 값)을 가지고 그룹을 나누는 것은 의미가 없다.
(Recency는 유동적이라서, 일회성이든 정기적이든 튀는 것을 체킹하는 것은 중요하지 않다.)
2. Recency 분석 보다 Monetary 분석이 선행되는것이 더 낫다.
(결국 얼마나 가치있는 고객인지 정의하는 것은 Monetary)
3. 정답이 없기 때문에 우선 고객을 qcut(균등분할)을 통해 그룹을 나눠보고,
(우리 고객의 상위 10%는 평균주기가 몇이고, 매출이 몇이고, 빈번도는 몇이고)
특성이 잘 보이지 않는다면 세분화 시도
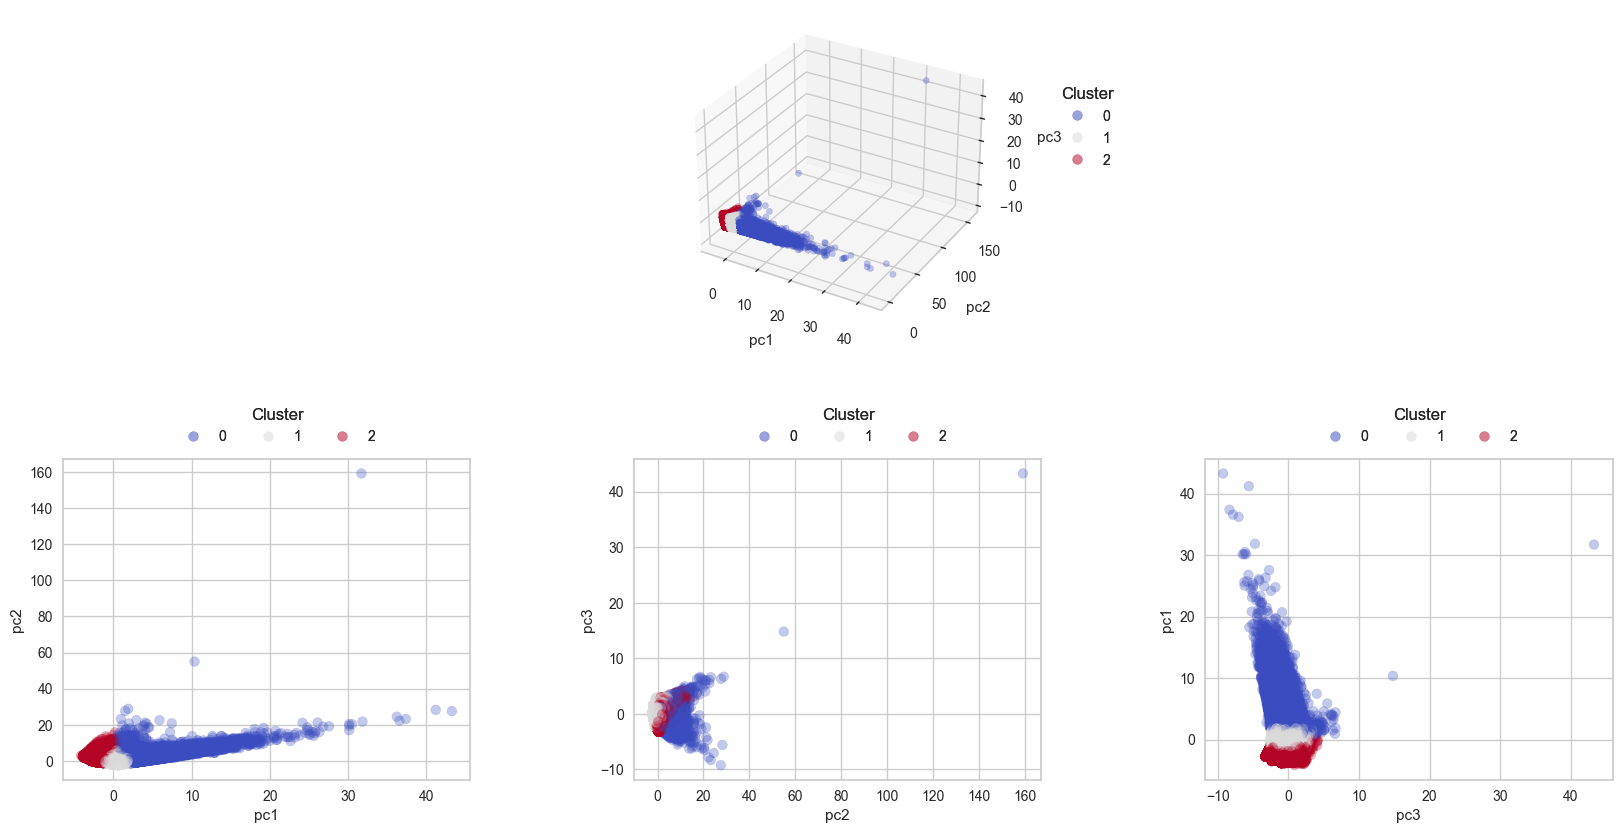
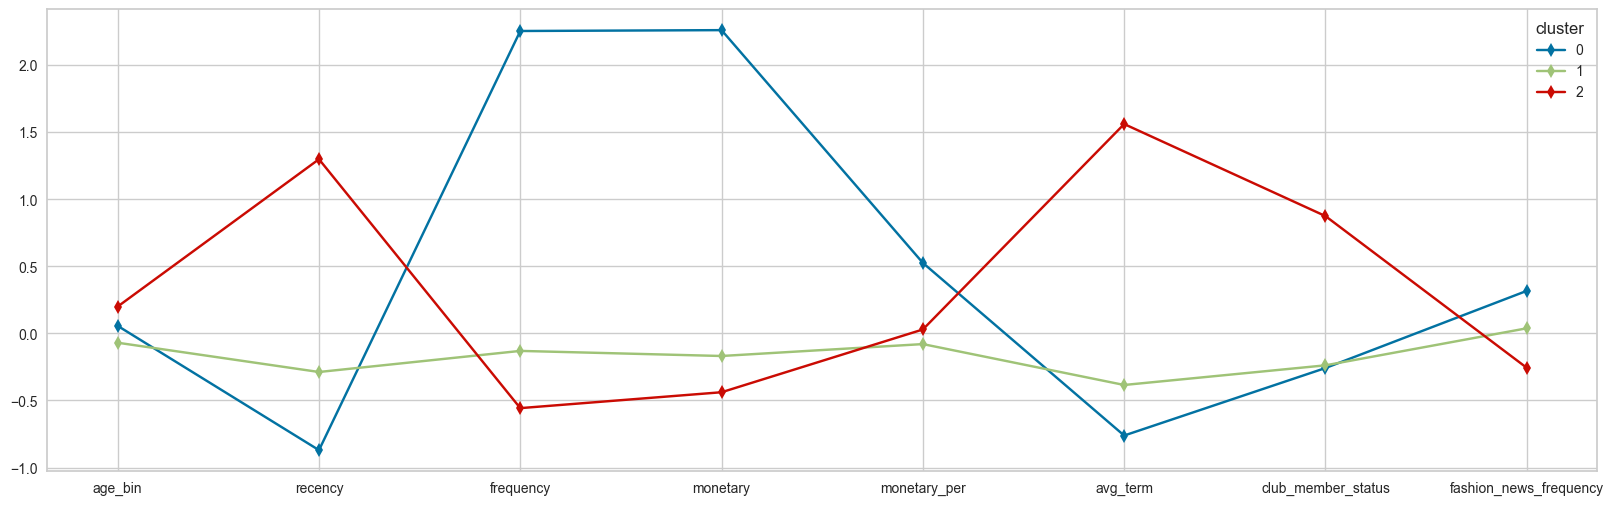
+) RFM 점수를 변수로 활용하여 K-means 클러스터링을 진행한 팀원의 결과
- 3개의 군집화가 적합할 것으로 예상
0번: 방문 주기와 빈도 는 1번 군집에 비해 많이 차이나지만, 소비금액은 유사
→ 간헐적 방문 + 대량 소비1번: 방문 주기가 가장 짧으며, 높은 소비금액 보유
→ 수시 방문 + 소량 소비2번: 일회성 방문객으로, 소비금액이 낮고 방문주기가 매우 긴 형태
→ 가장 열위한 RFM 지표 보유

결과
- RFM 분석으로 고객을 분류한 결과
- RFM 수치를 활용한 Kmeans 등의 클러스터링 분석 결과
위 두 군집 결과를 대조하여 분류가 잘 되었는지,
어떤 방법이 분류가 더 잘 되었는지 등을 비교하여 최적의 고객 분류하기
#OUTRO
오늘의 한 줄.
할 수 있다..!

커피 좋아하는 데이터 꿈나무