This article is for personal use to review self-organizing map, which is an unsupervised learning technique.
What is Self-organizing Map (SOM)?
According to Wikipedia, we get the following definition about self-organizing map.
A self-organizing map (SOM) or self-organizing feature map (SOFM) is an unsupervised machine learning technique used to produce a low-dimensional (typically two-dimensional) representation of a higher dimensional data set while preserving the topological structure of the data.
However, this definition might give the wrong impression that SOM only works in low dimensions, like two dimensions. It is possible to create higher-dimensional representations than two-dimensional ones, but two-dimensional representations are popular because of their visual effectiveness and the ability to represent correlation between nodes in the grids.
In this article, we will try to use SOM to cluster colors in the image without updating nearby nodes for speed and simplicity. Before we begin, let me tell you that the K-means algorithm is faster and better for clustering than SOM. Also, SOM is not an algorithm that is used a lot these days due to its slow nature. However, I think SOM is worth mentioning when we are learning about the history of unsupervised learning.
Color quantization
Each pixel in the image has the information in RGB format, which is an integer value for the intensity of each red, green, and blue color from 0 to 255. This means that there are more than 10 million colors that a display can represent. However, there are not that many images that actually have all those colors. Therefore, what color quantization does is reduce the number of colors that an image has and compress the memory size of the image by representing those colors as integer indexes and saving only those indexed colors as floats.
This technology was frequently used for early color computers and game consoles. However, due to the development of graphic processors and memory, color quantization is rarely used these days.
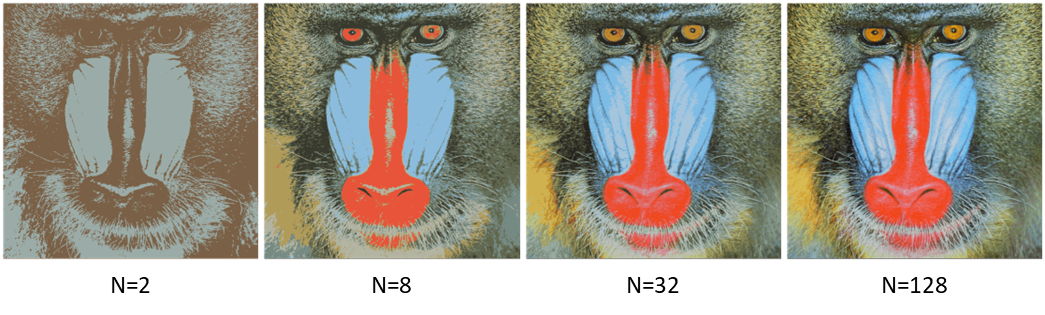
The above image shows the result of color quantization for the famous baboon image for N clusters. N=32 already shows pretty good quantized color results. The code for this is as below.
import numpy as np
import matplotlib.pyplot as plt
from tqdm.notebook import tqdm_notebook, tnrange
import cv2


CLUSTERS = 128  #  reduce image into n colors
DIMENSIONS = 3  #  r, g, b
LEARNING_RATE = 0.1

img = cv2.imread('baboon.jpg', cv2.IMREAD_COLOR)

IMAGE_WIDTH = img.shape[1]
IMAGE_HEIGHT = img.shape[0]
DATA_NUMBER = IMAGE_WIDTH * IMAGE_HEIGHT

W = np.random.random_sample((CLUSTERS, DIMENSIONS)) * 255   # Weights
X = np.reshape(img, (DATA_NUMBER, DIMENSIONS))              # Data

# need to randomly shuffle the data for good training
Y = np.take(X,np.random.permutation(X.shape[0]),axis=0)

for datum in tqdm_notebook(range(DATA_NUMBER),desc = "training"):
    E = np.sum((Y[datum] - W)**2, axis=-1) # calculate errors for each cluster
    winner_index = np.argmin(E)            # choose the cluster that has the minimum error
    k = (1-datum/DATA_NUMBER)              # reduce the learning rate over time

    W[winner_index] = W[winner_index] + LEARNING_RATE*k*(Y[datum]-W[winner_index])

W = W.astype(int) # change float to int

for datum in tqdm_notebook(range(DATA_NUMBER), desc="inference"):
    E = np.sum((X[datum] - W)**2, axis=-1) # calculate errors for each cluster
    winner_index = np.argmin(E)            # choose the cluster that has the minimum error
    X[datum] = W[winner_index]             # select the closest cluster

img = np.reshape(X, (IMAGE_HEIGHT, IMAGE_WIDTH, DIMENSIONS))

plt.figure(figsize=(10,10))
plt.imshow(img[:,:,::-1]);
plt.axis('off')
The code is pretty straight-forward. You can see from the code that this is unsupervised learning and does not use back propagation. However, one caution is that the order of the data has to be well randomized so that even a small number of data points can well represent the whole dataset. When you do color quantization without randomizing the order, you are not going to get good results and will have a skewed colored result. If the data is well mixed, you can only train with, say, 1000 observations and still get a good result with reduced training time. For the baboon image, it takes about 8 seconds to train and do inference, whereas it will take less than a second for the K-means algorithm, even with numpy implementation.