overview
이번 프로젝트는, 예전에 했었던 기억, 여러 블로그에서 공통적으로 뽑는 내용, 그리고 GPT 와 처음으로 진행할 예정이며, 딥러닝을 인정하기 위한.. 프로젝트.. 하.. 분하네..
with opencv
여러 블로그 등에 많이 나와 있는 방법을 적용해 보겠다.

객체 탐지를 해보자.
pixel distribution
import cv2
import seaborn as sns

src = cv2.imread(IMG_PATH)
src_gray = cv2.cvtColor(src, cv2.COLOR_BGR2GRAY)

sns.histplot(src_gray.reshape(-1,))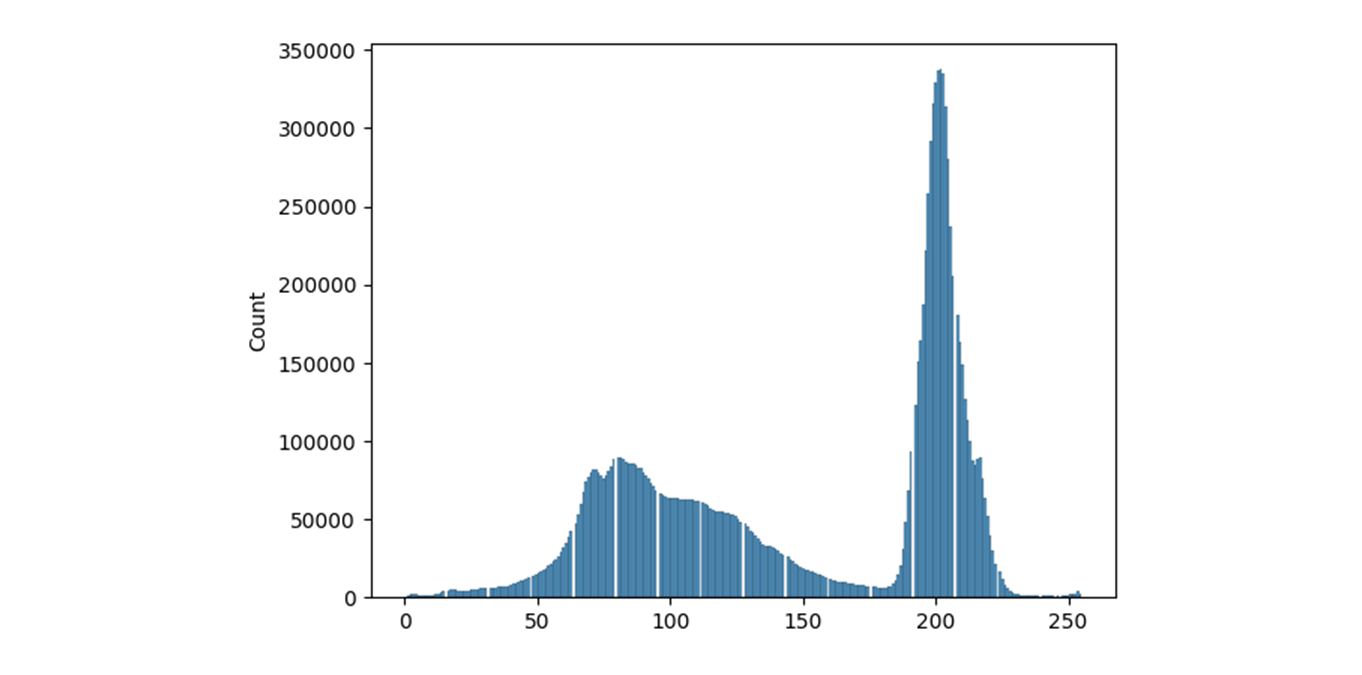
rgb2gray
from matplotlib import pyplot as plt

fig = plt.figure(figsize=(10,10))

plt.subplot(1, 2, 1)
plt.imshow(cv2.cvtColor(src_gray, cv2.COLOR_BGR2RGB))

plt.subplot(1, 2, 2)
plt.imshow(cv2.cvtColor(src, cv2.COLOR_BGR2RGB))

plt.show()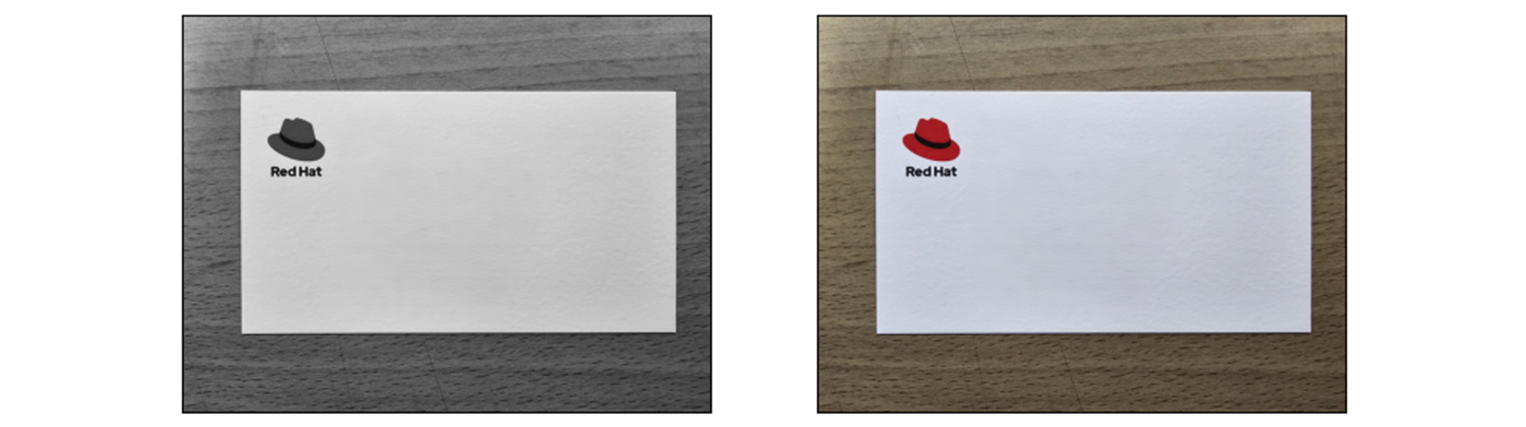
threshold
import copy

src = cv2.imread(IMG_PATH)
src_gray = cv2.cvtColor(src, cv2.COLOR_BGR2GRAY)

comp_1 = copy.deepcopy(src_gray)
comp_2 = copy.deepcopy(src_gray)
comp_3 = copy.deepcopy(src_gray)

## threshold : Binary + OTSU
th_val, src_bin = cv2.threshold(src_gray, 0, 255, cv2.THRESH_BINARY | cv2.THRESH_OTSU)
print("Auto threshold:", th_val)

fig = plt.figure(figsize=(10,10))-
threshold value
Auto threshold: 146.0 -
1st pic :
th_val이하는 0comp_1[comp_1 <= th_val] = 0 ax1 = fig.add_subplot(1, 4, 1) ax1.imshow(cv2.cvtColor(comp_1, cv2.COLOR_BGR2RGB)) -
2nd pic :
th_val초과는 255comp_2[comp_2 > th_val] = 255 ax2 = fig.add_subplot(1, 4, 2) ax2.imshow(cv2.cvtColor(comp_2, cv2.COLOR_BGR2RGB)) -
3rd pic :
th_val이하는 0,th_val초과는 255comp_3[comp_3 <= th_val] = 0 comp_3[comp_3 > th_val] = 255 ax3 = fig.add_subplot(1, 4, 3) ax3.imshow(cv2.cvtColor(comp_3, cv2.COLOR_BGR2RGB)) -
4th pic :
cv2.threshold사용._, src_bin = cv2.threshold(src_gray, 0, 255, cv2.THRESH_BINARY | cv2.THRESH_OTSU) ax4 = fig.add_subplot(1, 4, 4) ax4.imshow(cv2.cvtColor(src_bin, cv2.COLOR_BGR2RGB))

- cv2.THRESH_OTSU:
- 임계값을 자동으로 결정한다. 일반적으로 grayscale 이미지에서 사용 된다.
- 이진화하기 전에 이미지의 히스토그램을 분석하여 최적의 임계값을 찾는다.
3rd pic 과 4th pic 이 같아 보인다. 146.0 을 기준으로 분석해보자.
sns.histplot(comp_1.reshape(-1,), ax=axes[0])
sns.histplot(src_bin.reshape(-1,), ax=axes[1])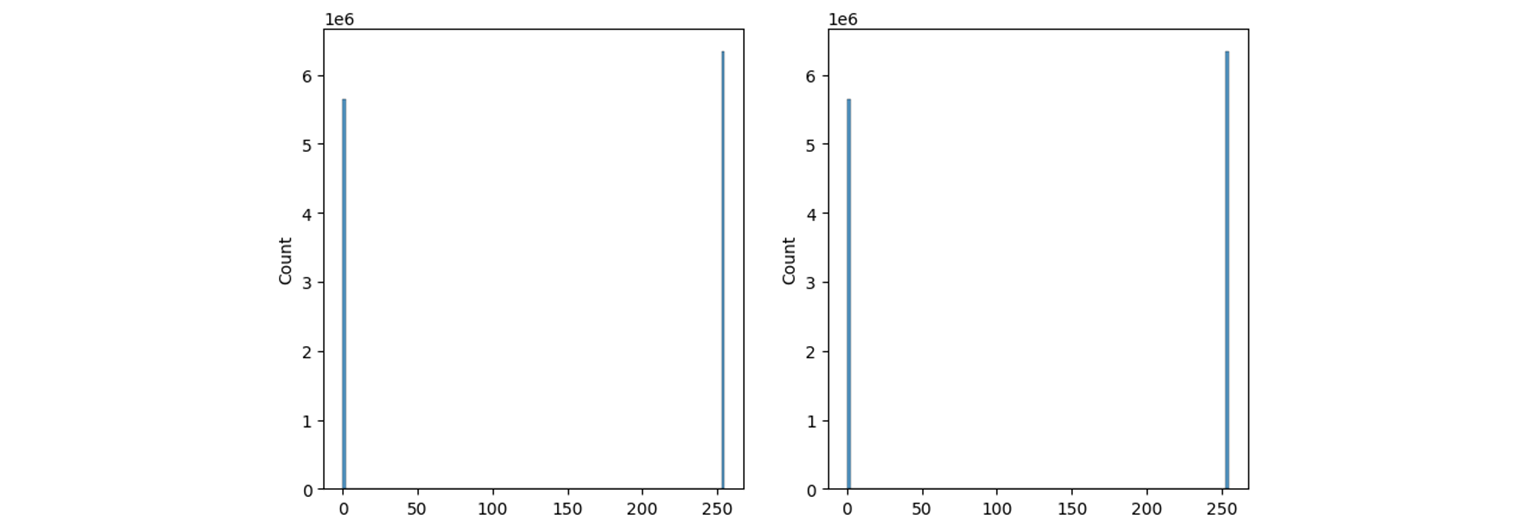
두 막대 역시 같아 보인다. 실제 값을 비교해보면
np.count_nonzero(comp_3 == 0) == np.count_nonzero(src_bin == 0)

# True
True 값이 나온다.
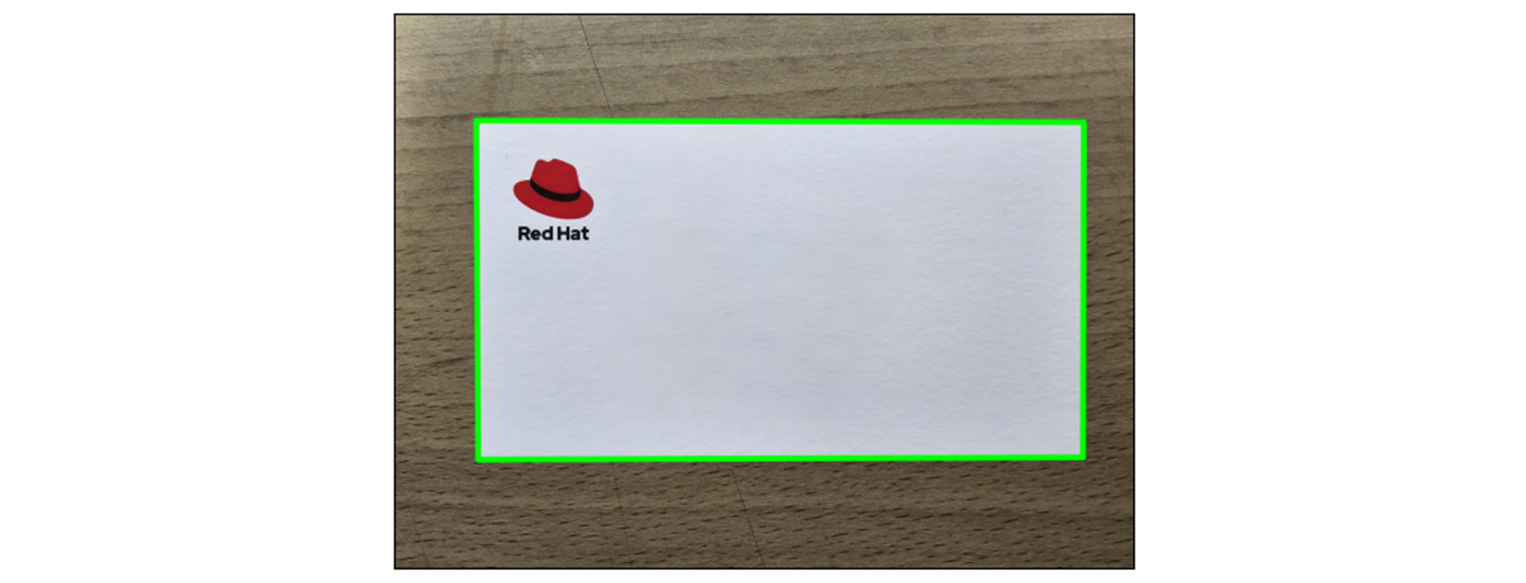
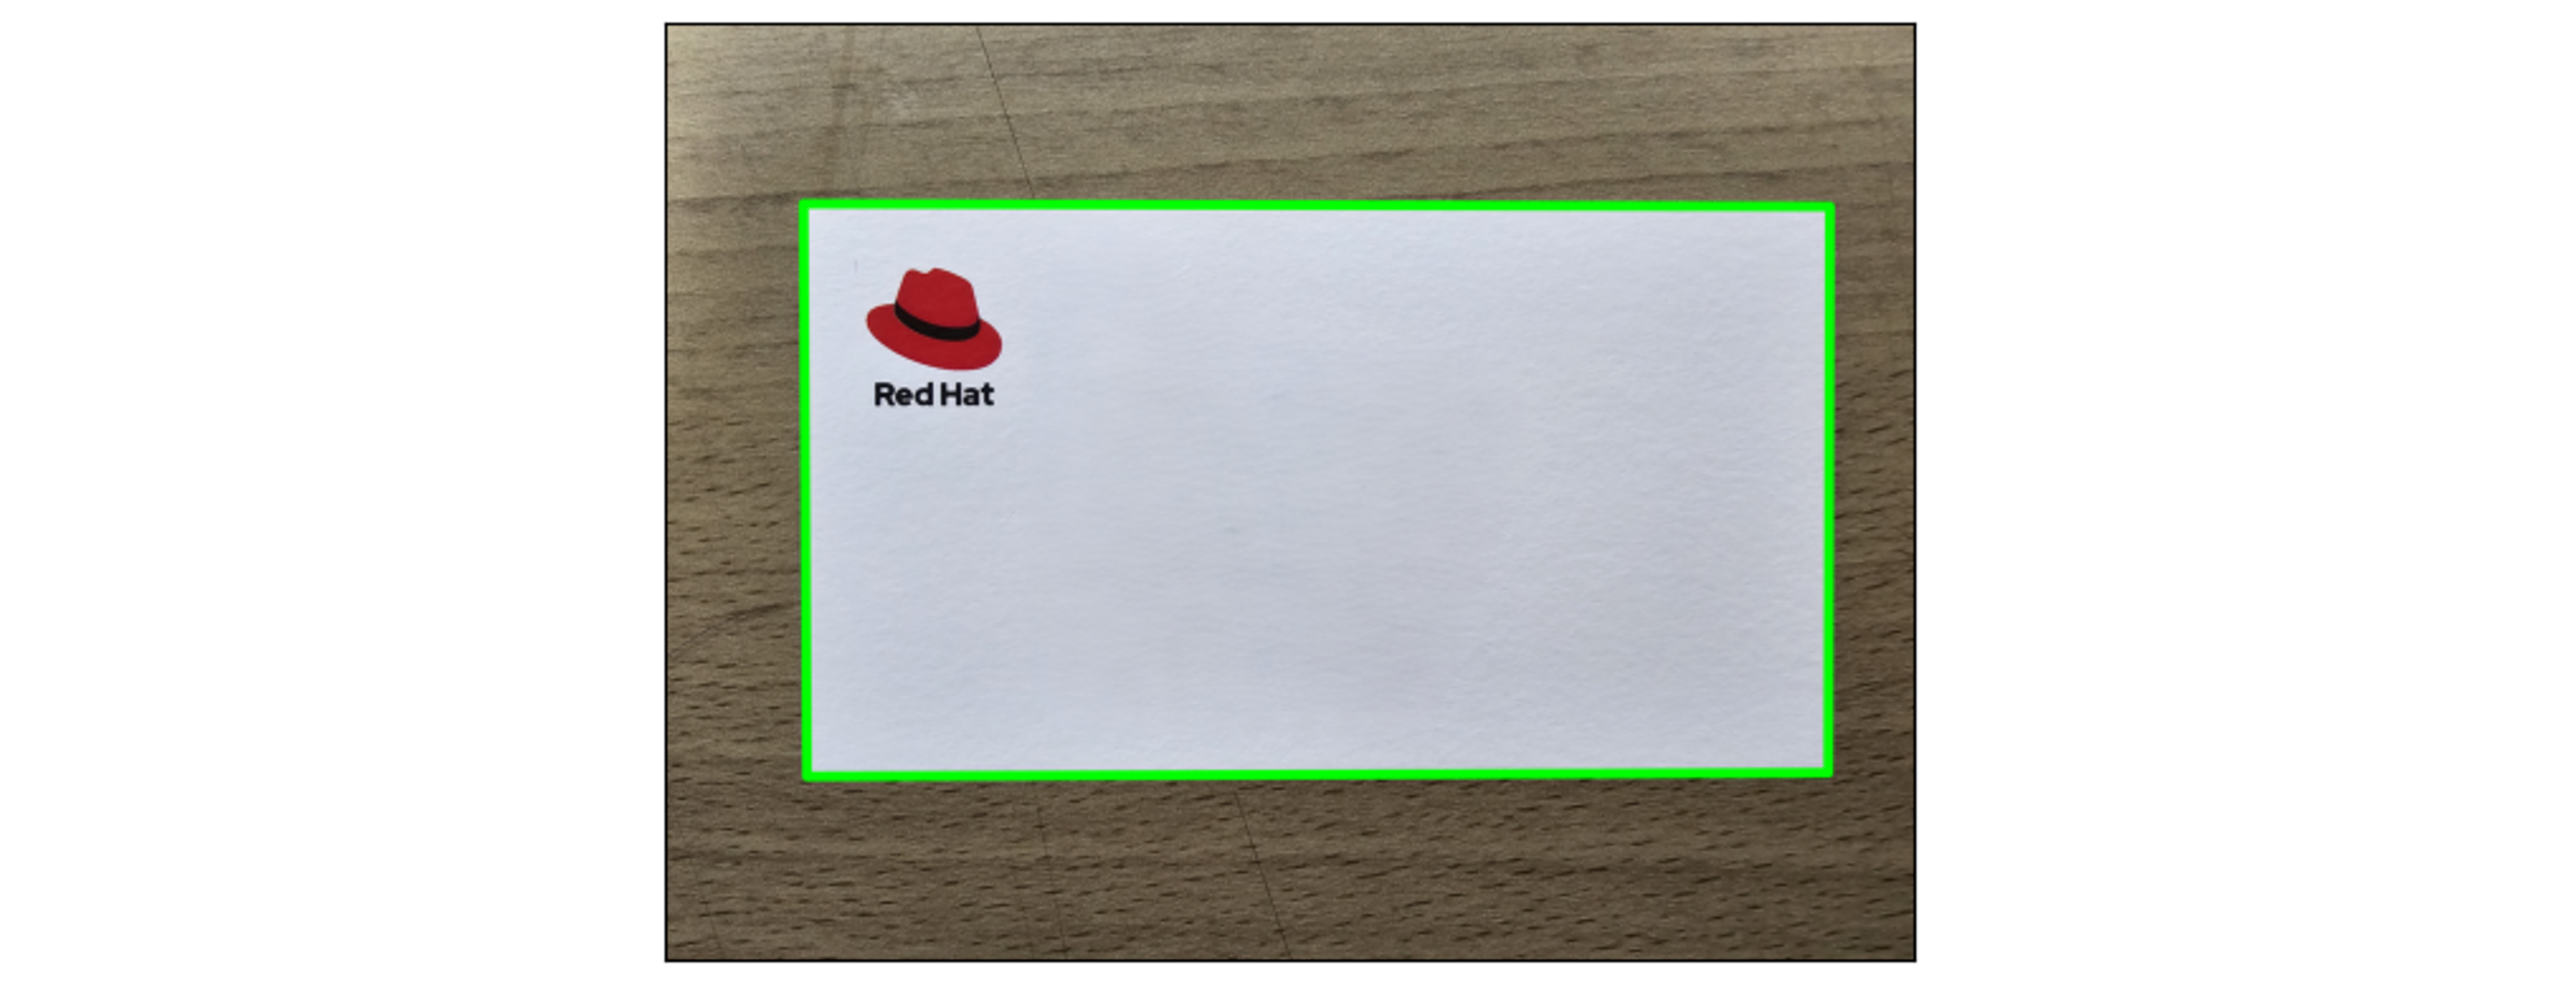
find contour
# Contour detection
contours, _ = cv2.findContours(src_bin, cv2.RETR_EXTERNAL, cv2.CHAIN_APPROX_NONE)

for contour in contours:
    # Ignore small object
    if cv2.contourArea(contour) < 20000:
        continue

    # Contour approximation
    epsilon = 0.02 * cv2.arcLength(contour, True)
    approx = cv2.approxPolyDP(contour, epsilon, True)

    # If approximated as a rectangle, draw the contour.
    if len(approx) == 4:
        cv2.polylines(src, [approx],
                isClosed=True,
                color=(0, 255, 0),
                thickness=30,
                lineType=cv2.LINE_AA
)-
findCountours
- 함수를 사용하여 윤곽선을 검출
-
arcLength
- 주어진 곡선 또는 윤곽선의 길이를 계산하는데 사용.
- 주로 contour approximation 등의 작업에서 곡선의 길이를 계산할 때 사용.
-
epsilon
- 근사화 정확도 epsilon은 윤곽선의 둘레 길이의 2%로 설정한다.
- 원래 곡선과 근사화된 곡선 간의 최대 거리. 작은 값을 사용하면 더 정밀하게 근사되고, 큰 값을 사용하면 더 단순하게 근사화 된다.
-
approxPolyDP
- detected contour 를 단순화 한다.
- 주어진 곡선을 지정된 정확도로 approximation 하여 다각형으로 변환한다.
-
polylines
- drawContours 로 그릴 수 있지만, polylines 사용하여 다각형을 그린다.
- 주어진 점들을 연결하여 다각형이나 선을 그리는데 사용한다.
plt.imshow(cv2.cvtColor(src, cv2.COLOR_BGR2RGB))
plt.xticks([])
plt.yticks([])
plt.show()