리액트를 사용해 차트를 그릴 때 chart.js, Recharts 등의 라이브러리를 선택적으로 사용하면 간편하게 작업을 마칠 수 있다. 하지만 라이브러리의 자유도가 높지 않다면 SVG를 활용해 커스텀 차트를 만들 수 있다.
완성된 토이 프로젝트 Repo(Typescript & Styled-component 사용)
https://github.com/dabin219/React-Typescript-Infinite-Scroll-SVG-chart
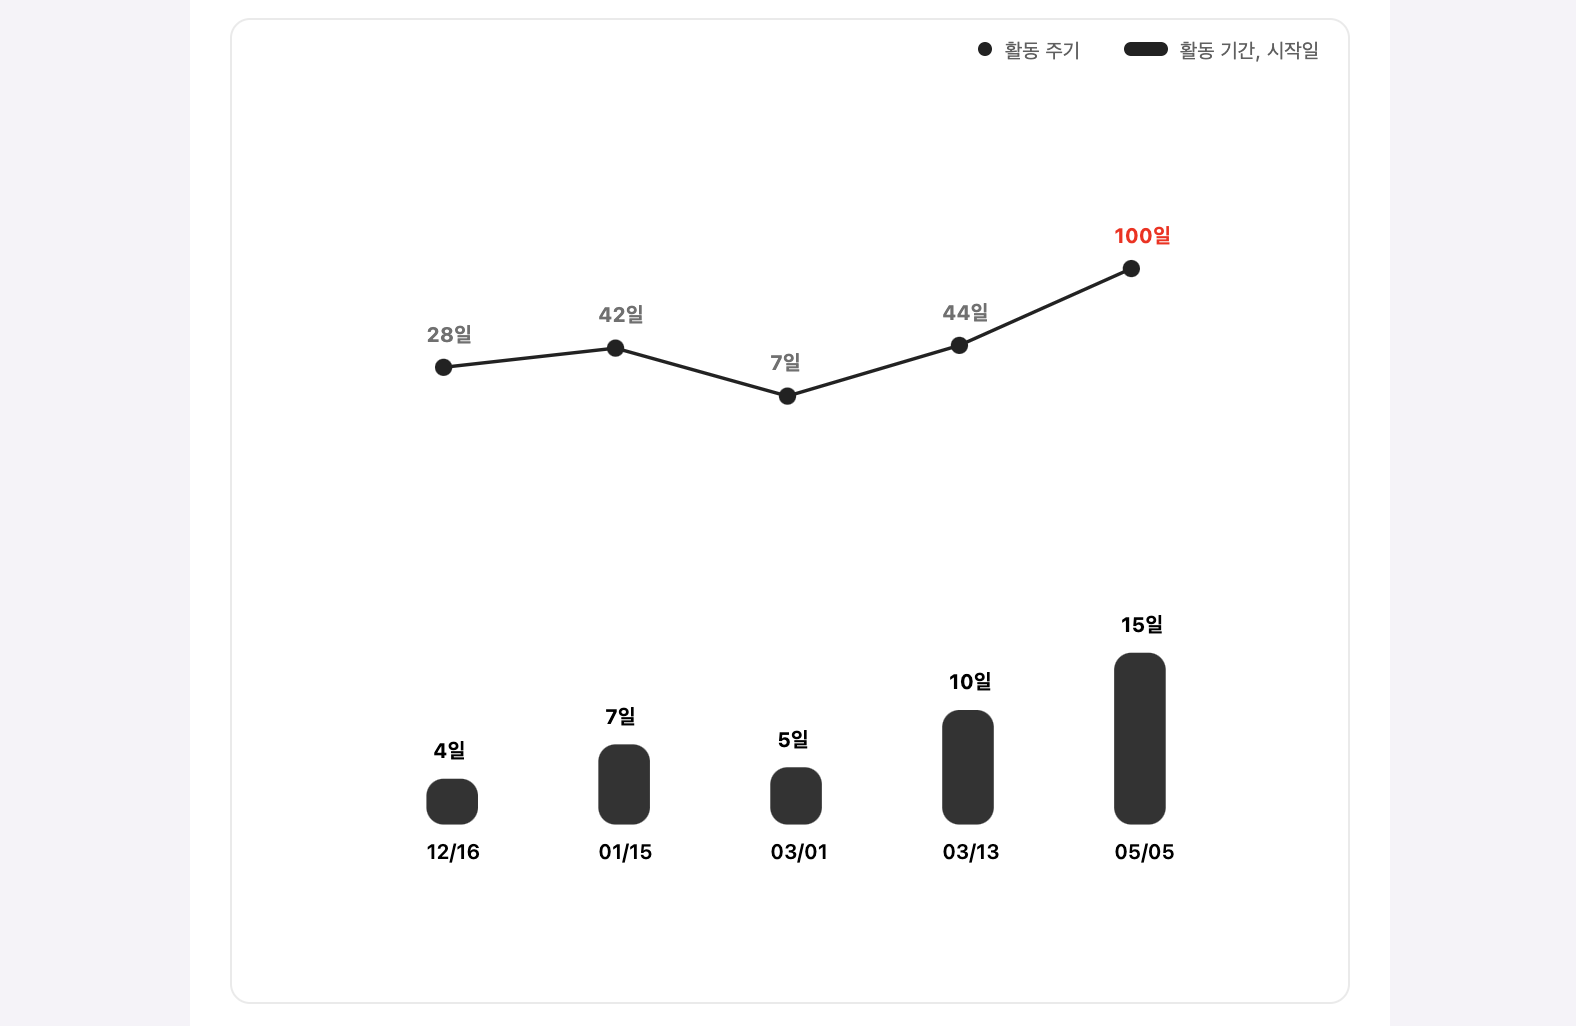
bar graph
//report page(최상위 컴포넌트)
 <BarChart>
   {data.map((info, index) => {
     const chartHeight = 100;
     const barWidth = 30;
     const barMargin = 70;
     const barHeight = (info.period / longestPeriod) * 100;
     return (
       <Bar
         key={info.period}
         x={index * (barWidth + barMargin) + 20}
         y={chartHeight - barHeight}
         width={barWidth}
         height={
           info.period === longestPeriod ? chartHeight : barHeight
         }
         startDate={info.startDate}
         period={info.period}
       />
     );
   })}
</BarChart>
//BarChart.tsx
interface chartProps {
children: React.ReactNode;
}
function BarChart({ children }: chartProps): JSX.Element {
return (
<svg
viewBox={`0 -40 556 220`}
width="100%"
height="100%"
preserveAspectRatio="xMidYMax meet"
>
{children}
</svg>
);
}//Bar.tsx
interface barProps {
x: number;
y: number;
width: number;
height: number;
startDate: string;
period: number;
}
function Bar({
x,
y,
width,
height,
startDate,
period,
}: barProps): JSX.Element {
const changeDateForm = (date: string) => {
const dateArr = date.split("-");
return dateArr && dateArr[1] + "/" + dateArr[2];
};
return (
<>
<rect
x={x}
y={y}
rx={10}
ry={10}
width={width}
height={height}
fill={"rgb(51, 51, 51)"}
/>
<Period x={x + 4} y={y - 12}>
{period + "일"}
</Period>
<Date x={x} y={120}>
{changeDateForm(startDate)}
</Date>
</>
);
}
export default Bar;line graph
interface pointsProps {
  x: number;
  y: number;
}

interface line {
  x1: number;
  x2: number;
  y1: number;
  y2: number;
}

interface lineGraphProps {
  points: pointsProps[];
  data: data[];
}

function LineGraph({ points, data }: lineGraphProps): JSX.Element {
  const lines = points.reduce(
    (result: line[], point: pointsProps, index: number) => {
      if (index === 0) return [];
      const previous = points[index - 1];
      const line = { x1: previous.x, y1: previous.y, x2: point.x, y2: point.y };
      return [...result, line];
    },
    []
  );

  return (
    <svg viewBox={`0 -40 556 140`} width="100%" height="100%">
      {lines.map(({ x1, x2, y1, y2 }) => (
        <GraphLine x1={x1} x2={x2} y1={y1} y2={y2} />
      ))}

      {points.map(({ x, y }: any, index) => {
        return (
          <>
            <GraphCircle cx={x} cy={y} r="5" />
            <Text
              x={x - 10}
              y={y - 15}
              isLastIndex={points.length === index + 1}
            >
              {data[index].cycle + "일"}
            </Text>
          </>
        );
      })}
    </svg>
  );
}

const GraphLine = styled.line`
  stroke: rgb(34, 34, 34);
  stroke-width: 2;
`;

const GraphCircle = styled.circle`
  fill: rgb(34, 34, 34);
`;

const Text = styled.text<{ isLastIndex: boolean }>`
  fill: ${(props) => (props.isLastIndex ? "#f00" : "rgb(112, 112, 112)")};
`;

모르는것투성이