▶ 기초 프로젝트 데이터 분석
1. 고객별 지출 비용 환산
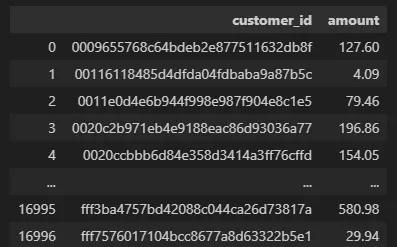
customer_id의 유니크 값 기준으로 총 지출group
# 고객당 총 지출 비용 환산
customer_amount = transcript.groupby('customer_id')['amount'].sum().reset_index()
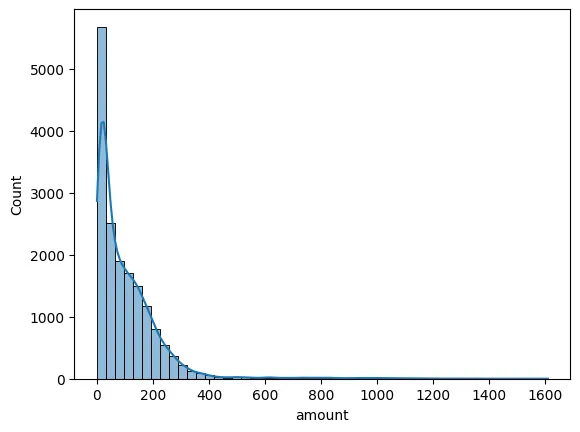
# hisoplot 활용하여 값 분포 조회
sns.histplot(data = customer_amount, x = 'amount', bins = 50, kde=True)- 결과 테이블
- 값 분포 그래프
2. 지출 구간 Group화 진행
- 100달러 단위로 구간을 나누고 총 매출 대비 매출 비율 계산
특정 구간의 고객들이 전체 매출에서 얼마나 많은 비중의 매출을 내고 있는지 확인하는 작업 진행
# 지출 금액 구간 컬럼 생성
customer_amount['지출 금액 구간'] = pd.cut(customer_amount['amount'], bins=range(0, int(customer_amount['amount'].max())+ 100, 100), right=False)
# 각 구간별 매출 비중 집계
total_amount = customer_amount['amount'].sum()
bins_amount = customer_amount.groupby('지출 금액 구간').sum('amount')
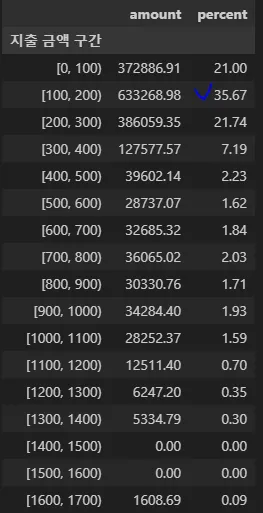
bins_amount['percent'] = round(bins_amount/total_amount * 100,2)
bins_amount- 총 지출 100~200 달러 미만에 해당하는 고객들이 전체 매출의 35% 가량 발생 시키고 있음
- 총 지출 0 ~ 300 미만에 해당하는 고객 → 전체 매출의 78.41%
- 결과 테이블
3. 지출 금액 0 ~ 300 달러 구간 프로모션 데이터 분석
# 총 지출 금액 300달러 미만인 고객 필터링
filt_amount = customer_amount[customer_amount['amount'] < 300]

# 필터링 고객 id 기준으로 transcript 테이블 머지
trans_filt_amount = pd.merge(filt_amount, transcript, how = 'left', on = 'customer_id')

# amount_x 컬럼명 수정
trans_filt_amount = trans_filt_amount.rename(columns={'amount_x':'total_amount'})

# event type이 view인 행만 조회
trans_filt_view = trans_filt_amount.loc[trans_filt_amount['event'] == 'offer viewed']

# event type이 completed인 행만 조회
trans_filt_completed = trans_filt_amount.loc[trans_filt_amount['event'] == 'offer completed']

# 프로모션 정보 테이블과 view 테이블 머지
promotion_view = pd.merge(trans_filt_view, portfolio, how='left', on='offer_id')

# offer type의 고유값 개수 조회
print(promotion_view['channels'].value_counts(), promotion_view['offer_type'].value_counts())

# 프로모션 정보 테이블과 completed 테이블 머지
promotion_completed = pd.merge(trans_filt_completed, portfolio, how='left', on='offer_id')

# offer type의 고유값 개수 조회
print(promotion_completed['channels'].value_counts(), promotion_completed['offer_type'].value_counts())- 조회 수 연산
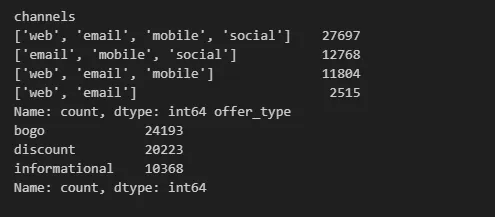
web, email, mobile, social 채널의 프로모션의 조회수가 가장 높음BOGO 타입의 프로모션 조회수가 가장 높음
- 완료 수 연산
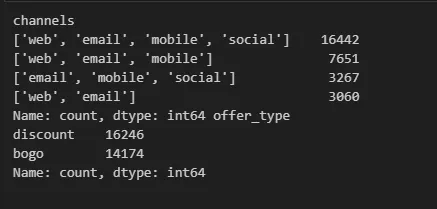
web, email, mobile, social 채널의 프로모션의 완료 수가 가장 많음Discouunt 타입의 프로모션 완료 수가 가장 많음
4. 지출 금액 100 ~ 200 달러 구간 프로모션 데이터 분석
# 총 지출 금액 100-200달러 미만인 고객 필터링
filt_amount = customer_amount[(customer_amount['amount'] >=100)&(customer_amount['amount'] < 200)]

# 필터링 고객 id 기준으로 transcript 테이블 머지
trans_filt_amount = pd.merge(filt_amount, transcript, how = 'left', on = 'customer_id')

# amount_x 컬럼명 수정
trans_filt_amount = trans_filt_amount.rename(columns={'amount_x':'total_amount'})

# event type이 view인 행만 조회
trans_filt_view = trans_filt_amount.loc[trans_filt_amount['event'] == 'offer viewed']

# event type이 completed인 행만 조회
trans_filt_completed = trans_filt_amount.loc[trans_filt_amount['event'] == 'offer completed']

# 프로모션 정보 테이블과 view 테이블 머지
promotion_view = pd.merge(trans_filt_view, portfolio, how='left', on='offer_id')

# offer type의 고유값 개수 조회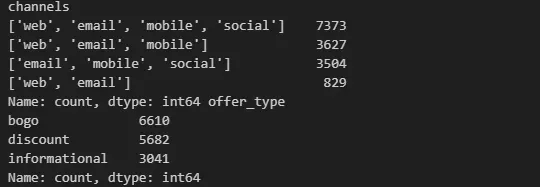
print(promotion_view['channels'].value_counts(), promotion_view['offer_type'].value_counts())- 조회 수 계산
web, email, mobile, social 채널의 프로모션의 조회수가 가장 높음BOGO 타입의 프로모션 조회수가 가장 높음
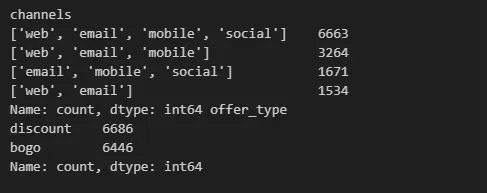
- 완료 수 계산
web, email, mobile, social 채널의 프로모션의 완료 수가 가장 많음Discouunt 타입의 프로모션 완료 수가 가장 많음
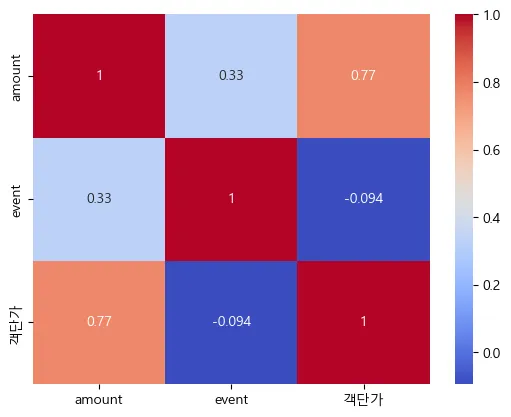
5. 결제 횟수, 객단가, 총 결제 금액 간 상관관계 분석
- 구매 빈도 + 객단가 계산 코드
# 고객당 총 지출 비용 환산 (전체 기간 기준)
customer_amount = transcript.groupby('customer_id')['amount'].sum().reset_index()
# 고객당 총 결제 횟수 계산
customer_trans_count= transcript[transcript['event']=='transaction'].groupby('customer_id')['event'].count().reset_index()
# 테이블 머지
merge_table = pd.merge(customer_amount, customer_trans_count, on='customer_id')
# 객단가 계산 - 구매 기록 없는 고객 제외
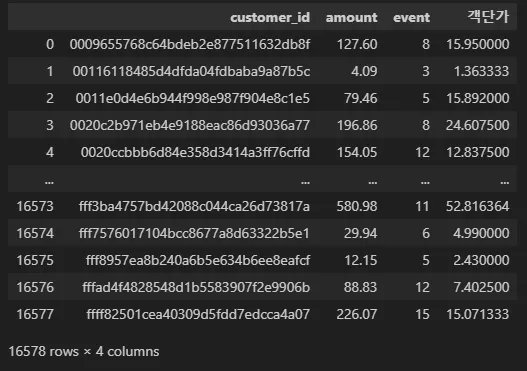
merge_table['객단가'] = merge_table['amount'] / merge_table['event']
merge_table-
구매 횟수 + 객단가 계산 테이블
-
Heatmap 시각화
-
상관관계 분석 코드
columns = merge_table[['amount', 'event', '객단가']]

corr_matrix = columns.corr()
corr_matrix

sns.heatmap(corr_matrix, annot = True, cmap='coolwarm')
[ 객단가 - 총 결제 금액 간의 상관 계수 ]
⇒0.77강한 양적 상관 관계
6. 총 지출 금액 상위 N% 고객의 지출 조회
# 상위 10% 기준 계산 - 구매 기록 없는 고객 제외
threshold_10 = merge_table['amount'].quantile(0.90)

# 상위 20% 기준 계산 - 구매 기록 없는 고객 제외
threshold_20 = merge_table['amount'].quantile(0.80)

# 상위 10% 고객 필터링 - 1,622명
top_10_percent = merge_table[merge_table['amount'] >= threshold_10]

# 상위 10% 고객 지출 / 전체 매출 - 35%
(top_10_percent['amount'].sum()/transcript['amount'].sum()) * 100

# 상위 20% 고객 필터링 - 3,240명
top_20_percent = merge_table[merge_table['amount'] >= threshold_20]

# 상위 20% 고객 지출 / 전체 매출 - 53%
(top_20_percent['amount'].sum()/transcript['amount'].sum()) * 100- 상위 10% 고객의 매출이 전체 매출의 35% 차지
→min: 229.37 /max: 1608.69 - 상위 20% 고객의 매출이 전체 매출의 53% 차지
→min: 170.66 /max: 1608.69
