판다스는 Matplotlib 라이브러리의 기능을 일부 내장하고 있음
plot() 메소드를 적용하고 kind 옵션으로 그래프의 종류 선택 가능
1) 선그래프
import pandas as pd

df = pd.read_excel('/남북한발전전력량.xlsx')

df_ns = df.iloc[[0,5],3:]
df_ns.index = ['South', 'North']
# 행 인덱스 변경
df_ns.columns = df_ns.columns.map(int)
# 문자열로 저장되어 있는 연도 값을 정수형으로 변경
print(df_ns.head())
print('\n')

df_ns.plot()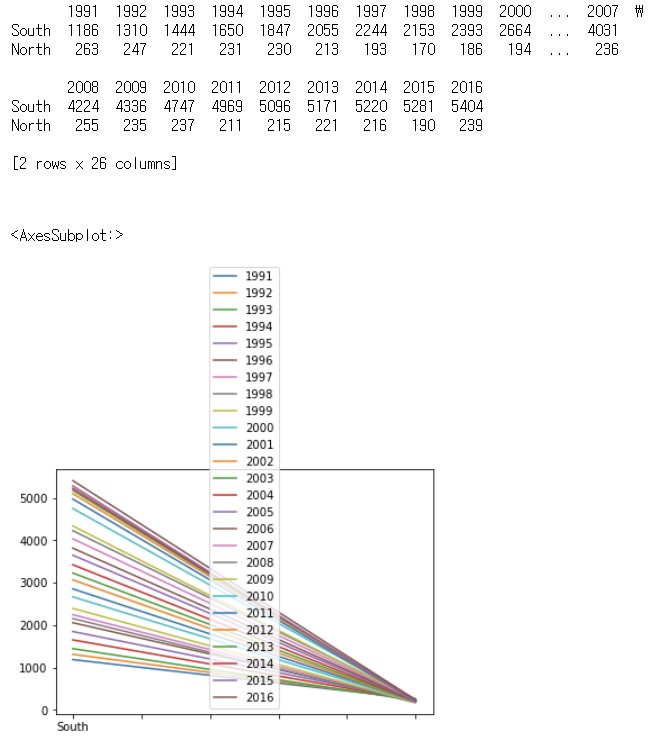
tdf_ns = df_ns.T
# 행, 열 전치하여 다시 그리기
tdf_ns.plot()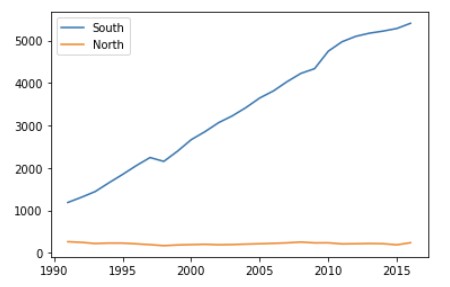
2) 막대 그래프
tdf_ns.plot(kind = 'bar')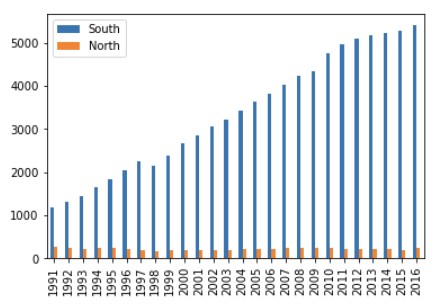
3) 히스토그램
히스토그램의 x축 : 발전량을 일정한 간격을 갖는 여러 구간으로 나눈 것
히스토그램의 y축 : 연갈 발전량이 x축에서 나눈 발전량 구간에 속하는 연도의 수를 빈도로 나타낸 것
tdf_ns.plot(kind = 'hist')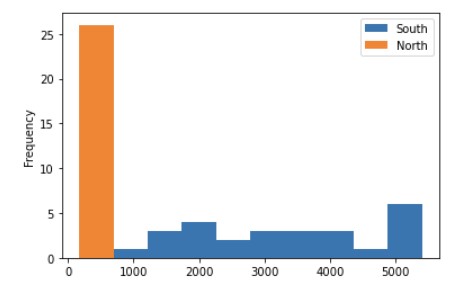
4) 산점도
import pandas as pd

df = pd.read_csv('./auto-mpg.csv', header = None)
df.columns = ['mpg', 'cylinders', 'displacement', 'horsepower', 'weight', 'acceleration', 'model year', 'origin', 'name']

df.plot(x = 'weight', y = 'mpg', kind = 'scatter')
# weight와 mpg 사이의 상관관계를 볼 수 있음
# 무게가 클수록 연비는 낮아지는 경향 (음의 상관관계)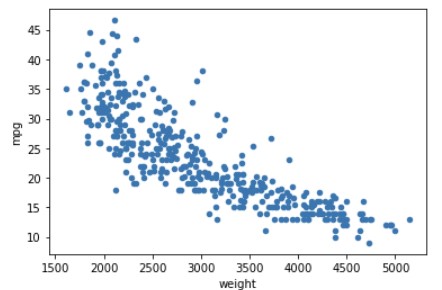
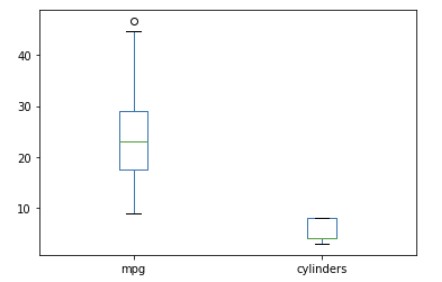
5) 박스 플롯
각 변수들의 데이터가 퍼져 있는 정도를 확인할 때 쓰임
df[['mpg', 'cylinders']].plot(kind = 'box')
# mpg와 cylinders 데이터가 어떤 범위에 퍼져있는지 확인 가능
# o는 이상치