누락 데이터가 NaN으로 표시되지 않는 경우도 있음
** 해당 값을 NaN으로 치환해야함
df.replace('?', np.nan, inplace = True)1) 누락 데이터 확인
import seaborn as sns

df = sns.load_dataset('titanic')
df.info()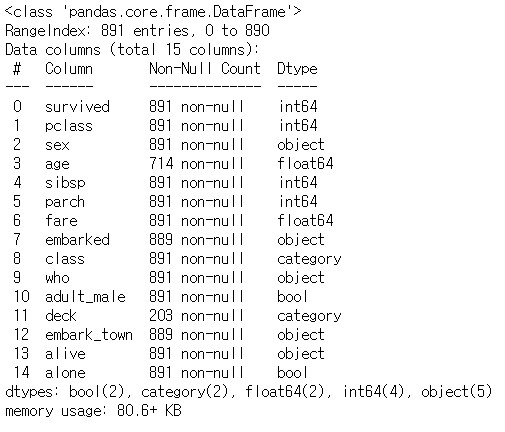
age, embarked, deck, embark_town 컬럼에 NULL 값이 존재함을 알 수 있음
nan_deck = df['deck'].value_counts(dropna = False)
# 누락된 데이터를 함께 확인하기 위해서는 반드시 dropna = False

print(nan_deck)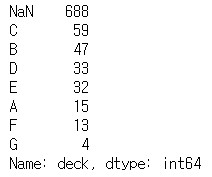
print(df.head().isnull())
# 상위 5개의 행에 대해 nan값 존재여부 확인
# isnull() 의 경우, nan 값이면 True
# notnull() 의 경우, nan 값이면 False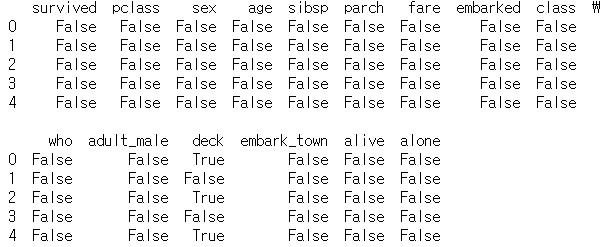
print(df.isnull().sum(axis = 0))
# 열별 nan값의 수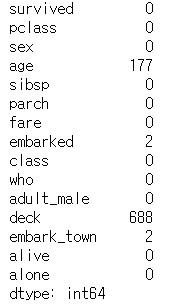
2) 누락 데이터 제거
import seaborn as sns

df = sns.load_dataset('titanic')

missing_df = df.isnull()
# nan 값이 포함되어 있는 데이터 선택

for col in missing_df.columns:
    missing_count = missing_df[col].value_counts()
    # 열별로 nan 값인 데이터 수 구하기
    try:
        print(col, ': ', missing_count[True])
        # nan 값이 있으면 개수 출력
    except:
        print(col, ': ', 0)
        # nan 값이 없으면 0 출력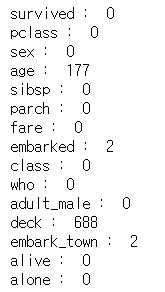
df_thresh = df.dropna(axis =1, thresh = 500)
# nan 값이 500개 이상인 열을 모두 삭제

print(df_thresh.columns)
df_age = df.dropna(subset = ['age'], how = 'any', axis = 0)
# age 열에 nan이 있으면 삭제
# how = 'any' 의 경우, nan 값이 하나라도 존재하면 삭제한다는 뜻
# how = 'all' 의 경우, 모든 데이터가 nan 값이면 삭제한다는 뜻
3) 누락 데이터 치환 - 평균 ver.
import seaborn as sns

df = sns.load_dataset('titanic')

mean_age = df['age'].mean(axis = 0)
# age 열의 평균값 (nan 제외)

df['age'].fillna(mean_age, inplace = True)
# age 열 중, nan 값인 데이터를 평균으로 대체
4) 누락 데이터 치환 - 최빈 ver.
import seaborn as sns

df = sns.load_dataset('titanic')

most_freq = df['embark_town'].value_counts(dropna = True).idxmax()
# embark_town 열의 최빈값 구하기

df['embark_town'].fillna(most_freq, inplace = True)
# embark_town 열 중, nan 값인 데이터를 최빈값으로 대체
5) 누락 데이터 치환 - 이웃 ver.
import seaborn as sns

df = sns.load_dataset('titanic')

df['embark_town'].fillna(method = 'ffill', inplace = True)
# embark_town 열 중, nan 값인 데이터를 바로 직전 데이터로 대체
# method = 'bfill'을 사용하면 nan 값인 데이터 바로 직후 데이터로 대체
