- Folium 설치 방법
아나콘다 프롬프트를 실행한 후,
conda install -c conda-forge folium 입력
1) 지도 만들기
import folium

seoul_map = folium.Map(location = [37.55, 126.98], zoom_start = 12)
# 위도, 경도 수치를 입력하면 그 지점을 중심으로 지도를 보여줌
# zoom_start 를 통해 확대 비율 조절

seoul_map.save('./seoul.html')
# 지도 저장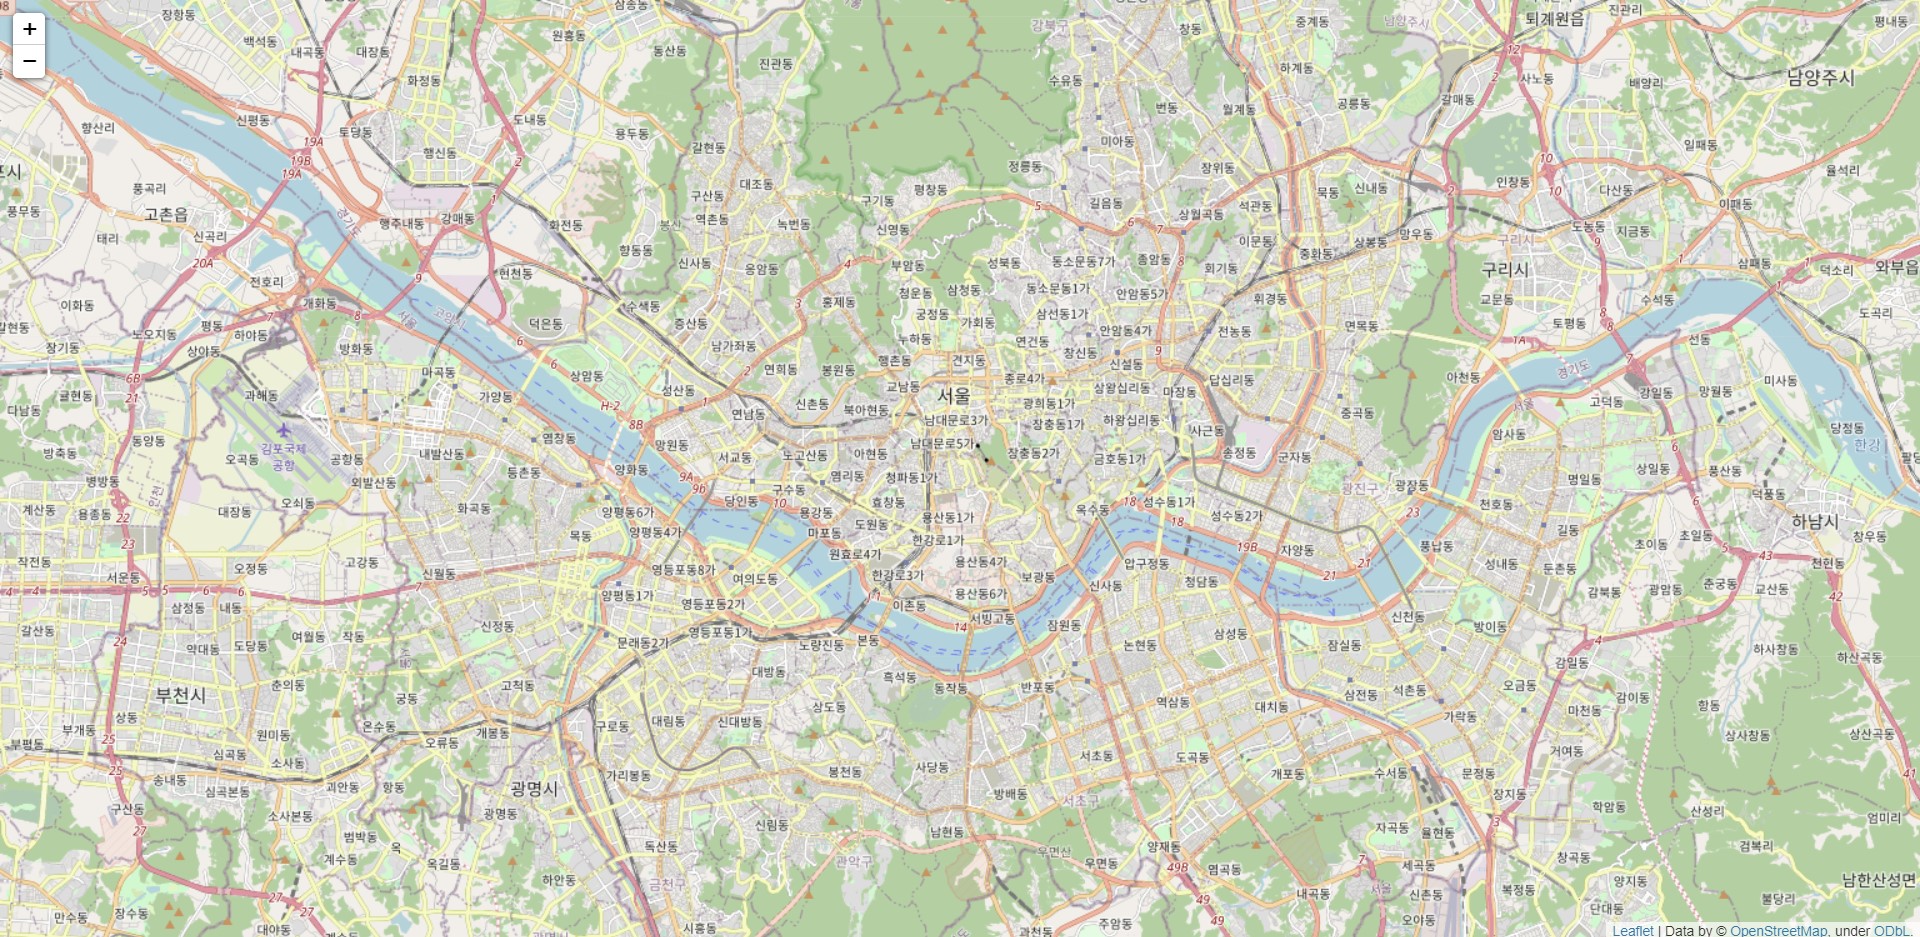
2) 지도 스타일 적용하기
import folium

seoul_map = folium.Map(location = [37.55, 126.98], tiles = 'Stamen Terrain', zoom_start = 12)
# 위도, 경도 수치를 입력하면 그 지점을 중심으로 지도를 보여줌
# zoom_start 를 통해 확대 비율 조절

seoul_map.save('./seoul2.html')
# 지도 저장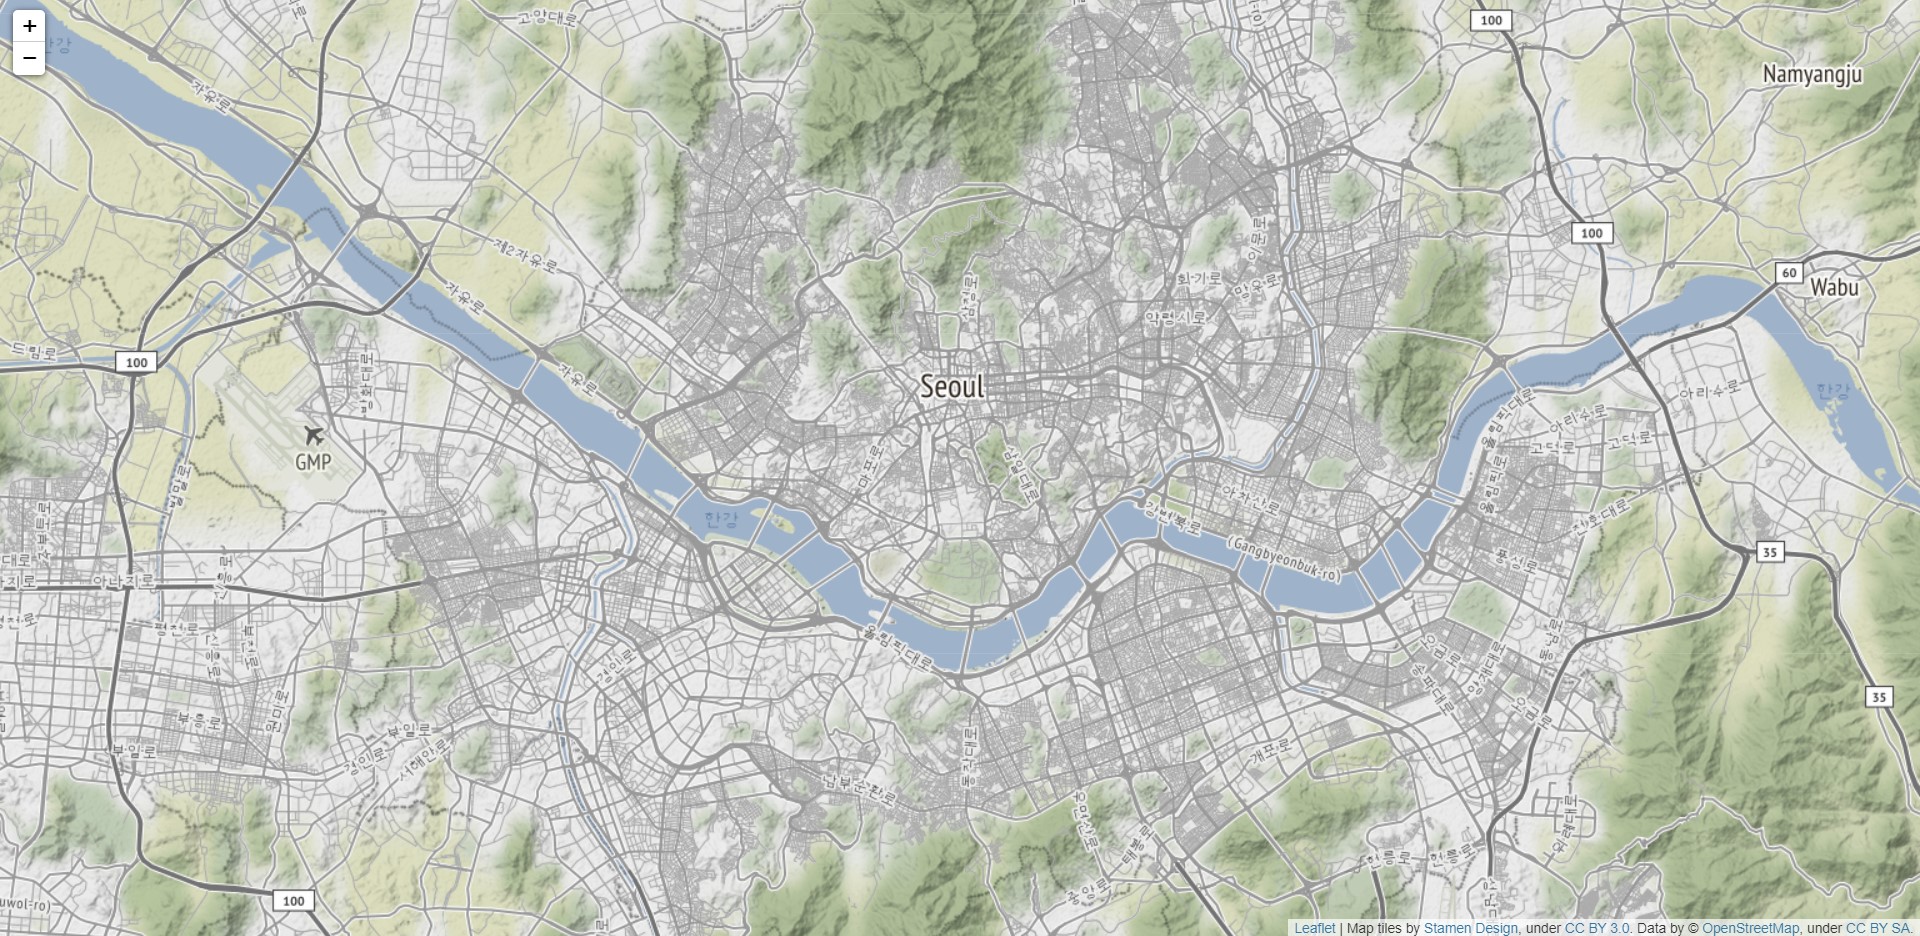
3) 지도에 마커 표시하기
import pandas as pd
import folium

df = pd.read_excel('./서울지역 대학교 위치.xlsx')

seoul_map = folium.Map(location = [37.55, 126.98], tiles = 'Stamen Terrain', zoom_start = 12)

for name, lat, lng in zip(df.index, df.위도, df.경도):
    folium.Marker([lat, lng], popup = name).add_to(seoul_map)
# 대학교 위치 정보를 Marker로 표시

seoul_map.save('./seoul_colleges.html')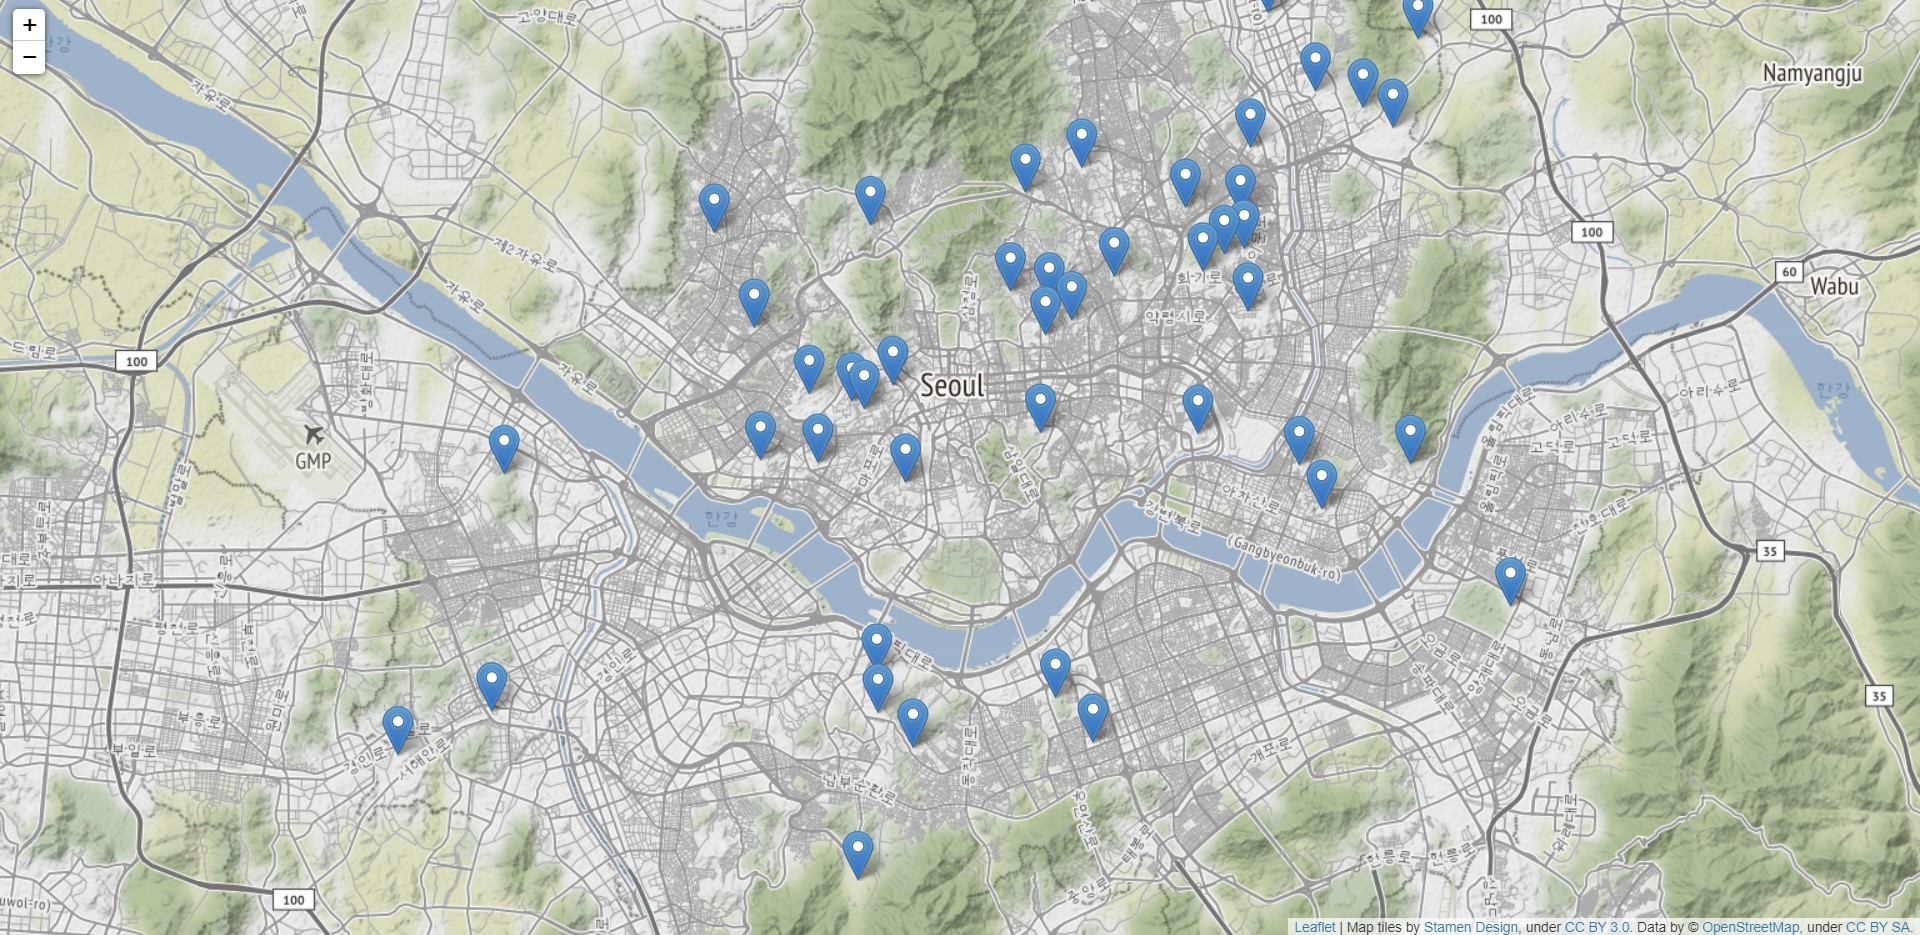
import pandas as pd
import folium

df = pd.read_excel('./서울지역 대학교 위치.xlsx')

seoul_map = folium.Map(location = [37.55, 126.98], tiles = 'Stamen Terrain', zoom_start = 12)

for name, lat, lng in zip(df.index, df.위도, df.경도):
    folium.CircleMarker([lat, lng],
                        radius = 10,
                        color = 'brown',
                        fill = True,
                        fill_color = 'coral',
                        fill_opacity = 0.7,
                        popup = name).add_to(seoul_map)
# 대학교 위치 정보를 CircleMarker로 표시
# popup = name은 해당 마커를 클릭하면 지정한 열의 값이 보임

seoul_map.save('./seoul_colleges.html')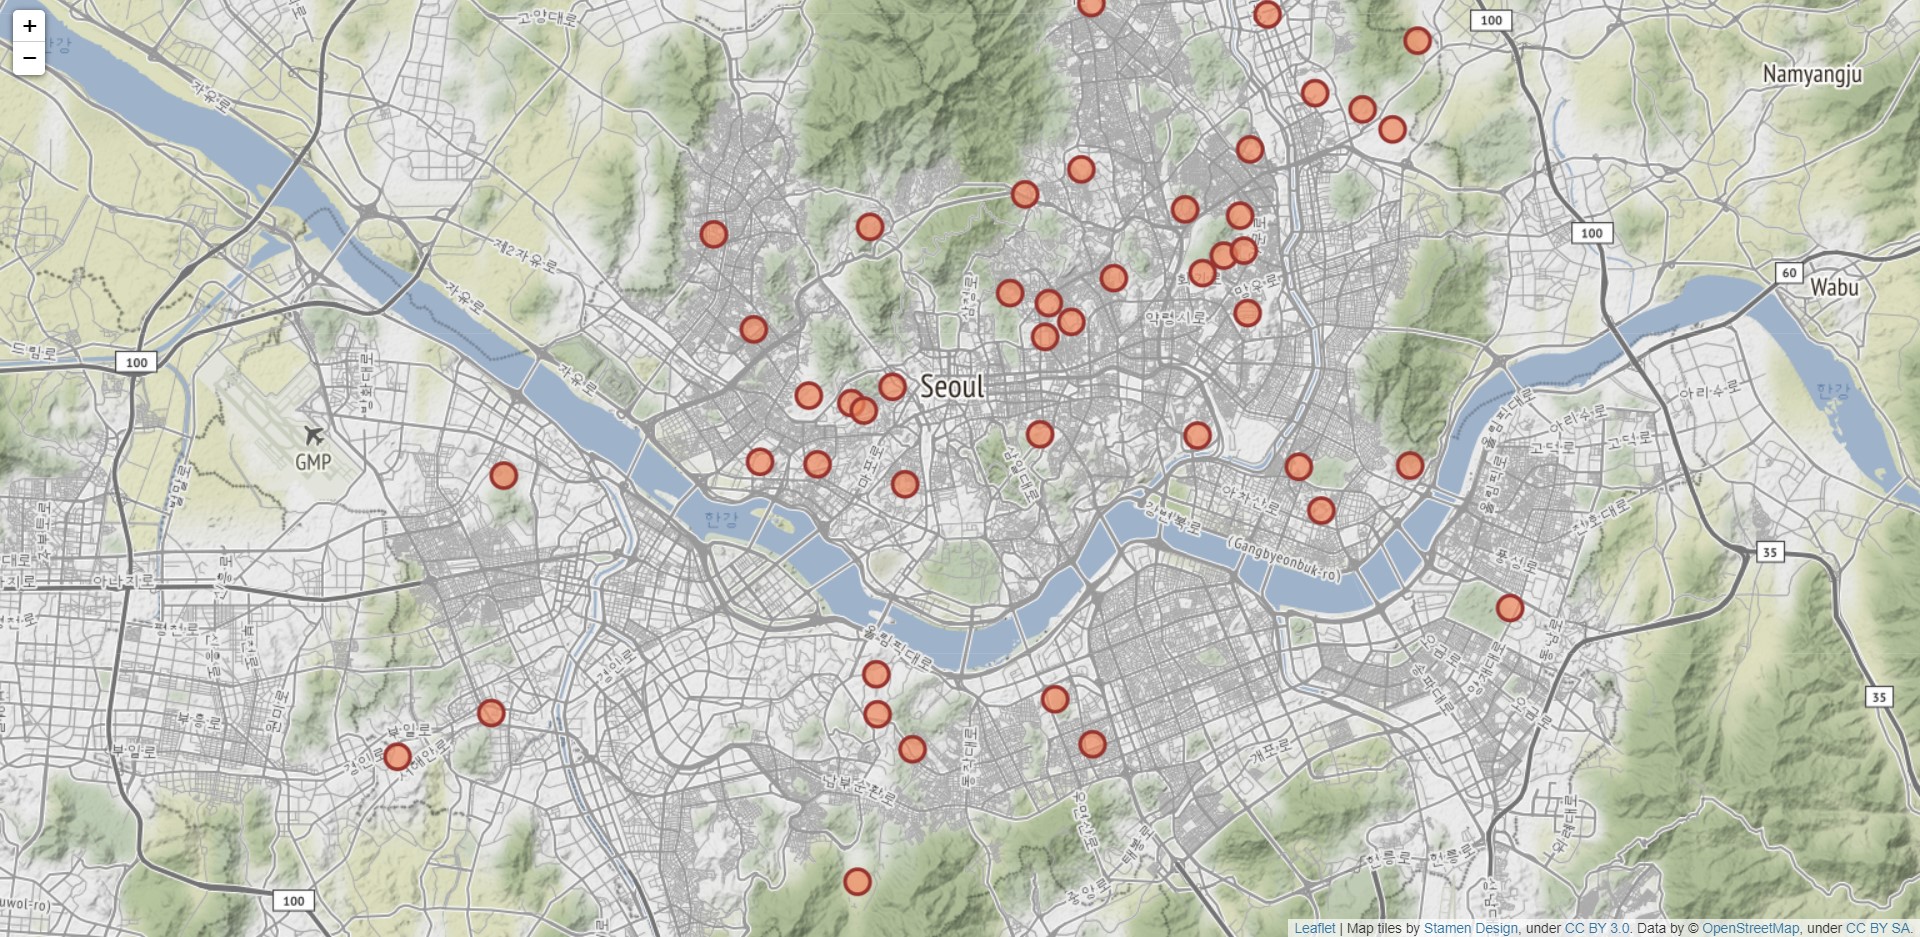
+) 팝업 박스 크기 조절
import pandas as pd
import folium

df = pd.read_excel('./서울지역 대학교 위치.xlsx')

seoul_map = folium.Map(location = [37.55, 126.98], tiles = 'Stamen Terrain', zoom_start = 12)

for name, lat, lng in zip(df.name, df.위도, df.경도):
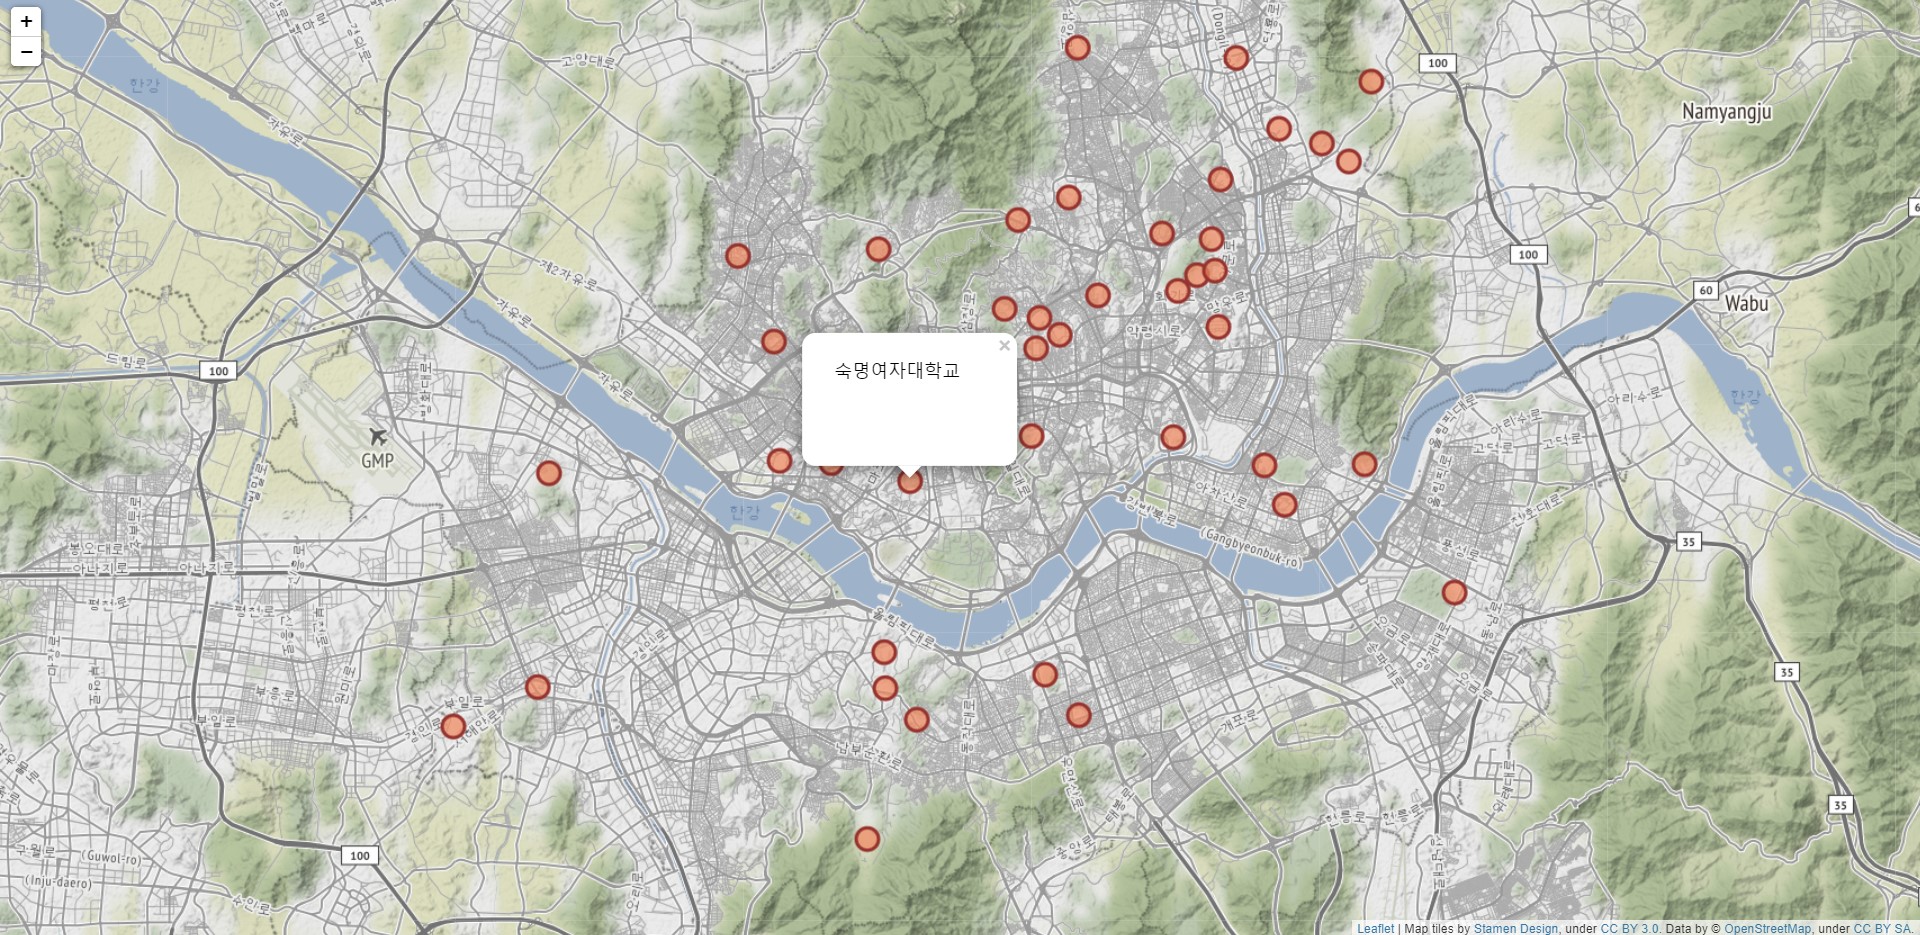
    iframe = folium.IFrame(name)
    popup = folium.Popup(iframe, min_width=150, max_width=150)
    # popup 크기 설정

    folium.CircleMarker([lat, lng],
                        radius = 10,
                        color = 'brown',
                        fill = True,
                        fill_color = 'coral',
                        fill_opacity = 0.7,
                        popup = popup).add_to(seoul_map)
# 대학교 위치 정보를 CircleMarker로 표시
# popup = name은 해당 마커를 클릭하면 지정한 열의 값이 보임

seoul_map.save('./seoul_colleges.html')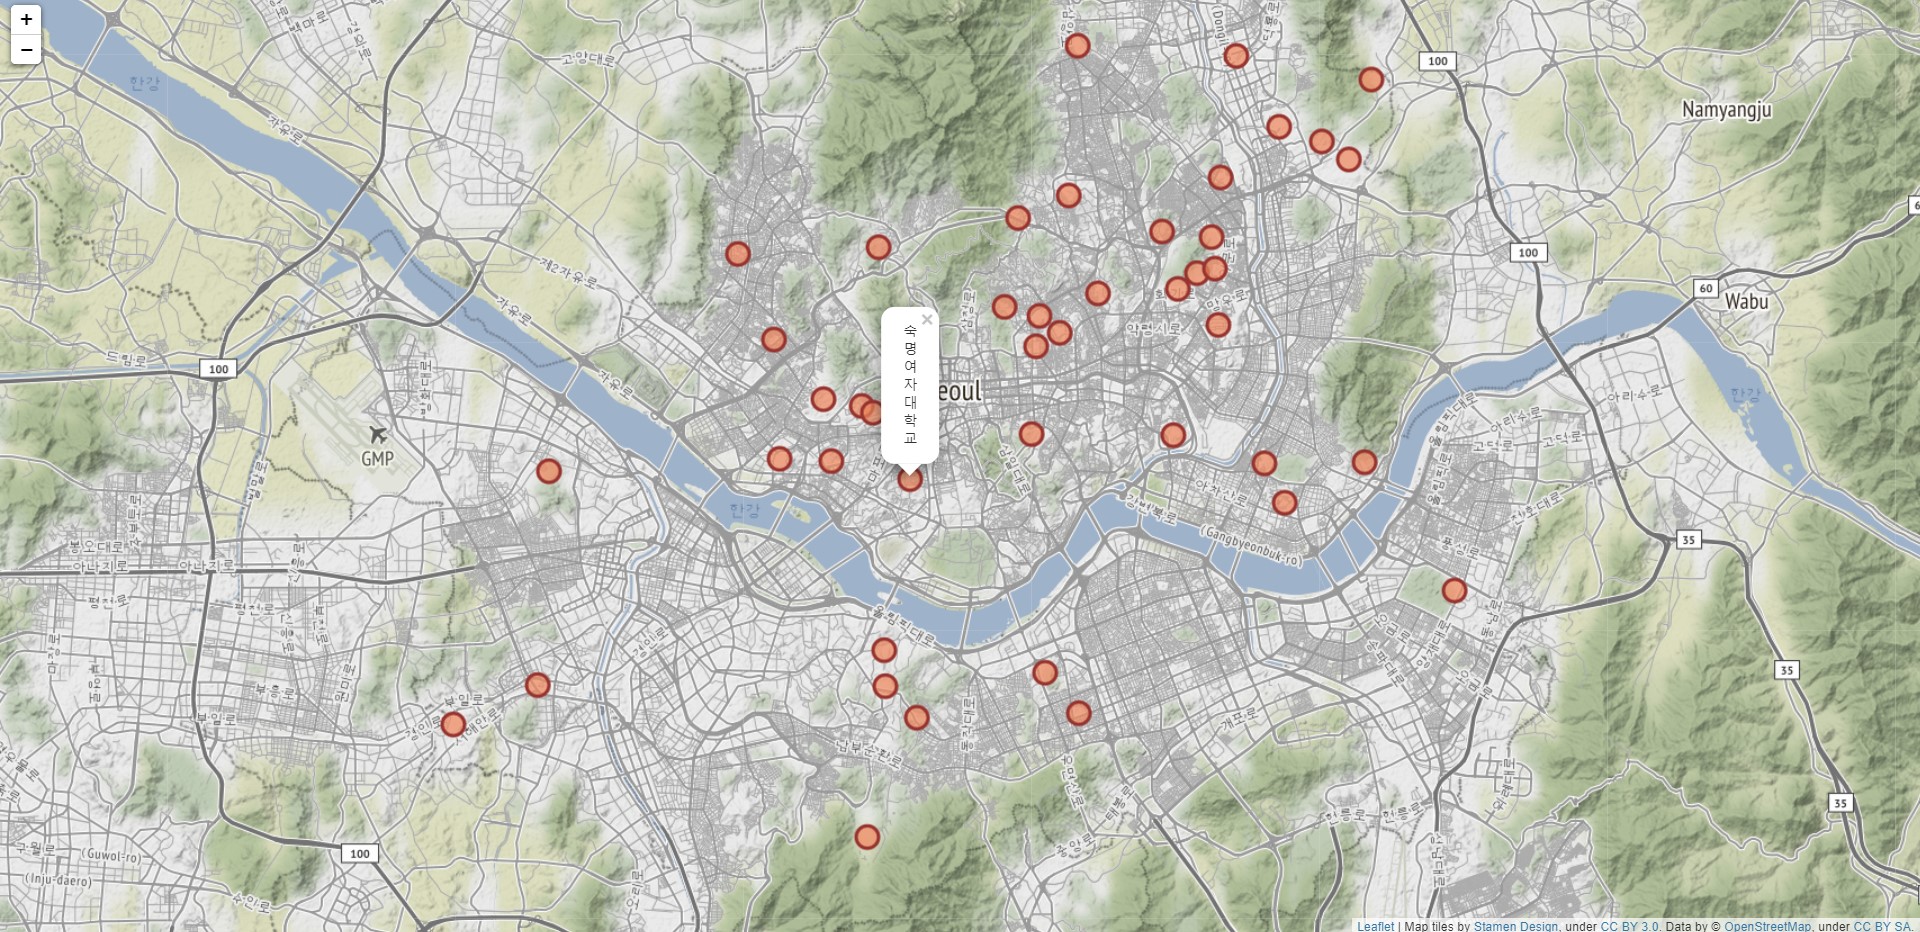
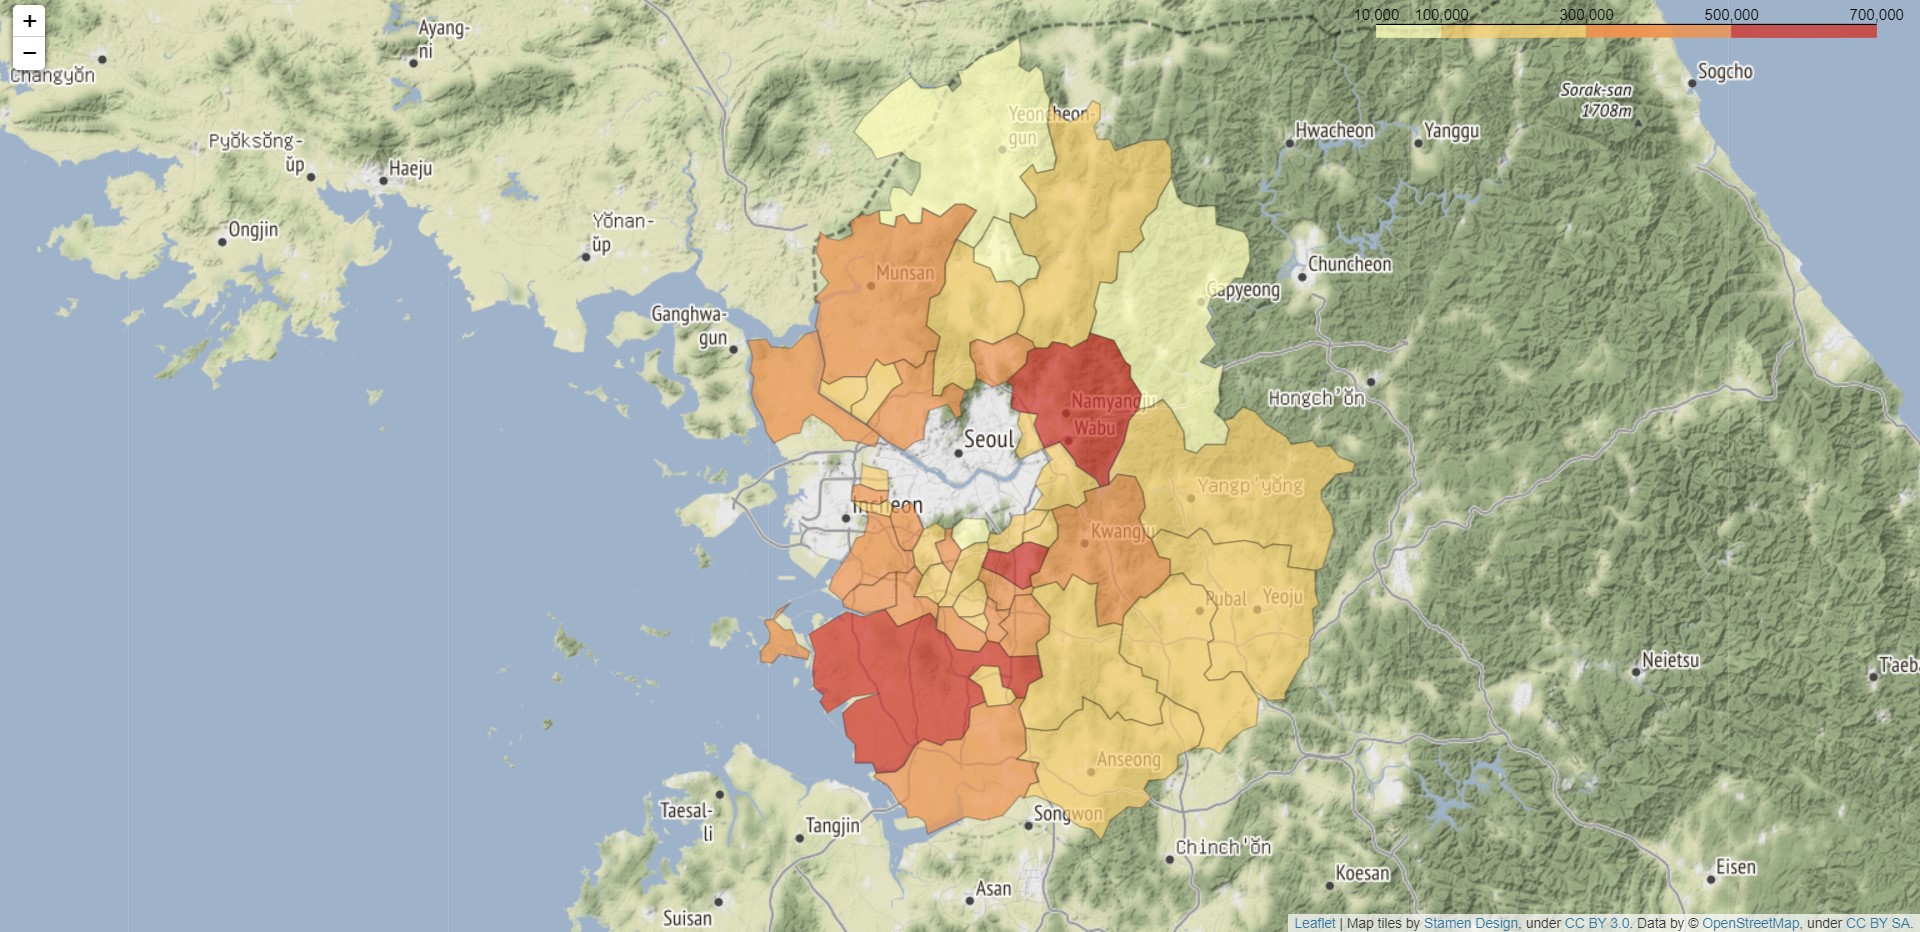
4) 지도 영역에 단계구분도(Choropleth Map) 표시하기
import pandas as pd
import folium
import json

file_path = './경기도인구데이터.xlsx'
df = pd.read_excel(file_path, index_col = '구분')
df.columns = df.columns.map(str)

geo_path = './경기도행정구역경계.json'
try:
    geo_data = json.load(open(geo_path, encoding = 'utf-8'))
except:
    geo_data = json.load(open(geo_path, encoding = 'utf-8-sig'))

g_map = folium.Map(location = [37.5502, 126.982],
                  tiles = 'Stamen Terrain', zoom_start = 9)

year = '2007'
# 출력할 년도 선택

folium.Choropleth(geo_data = geo_data, # 지도 경계
                 data = df[year], # 표시하려는 데이터
                 columns = [df.index, df[year]], # 열 지정
                 fill_color = 'YlOrRd', fill_opacity = 0.7, line_opacity = 0.3,
                 threshold_scale = [10000, 100000, 300000, 500000, 700000],
                 key_on = 'feature.properties.name',).add_to(g_map)

g_map.save('./gyeonggi_population_'+year+'.html')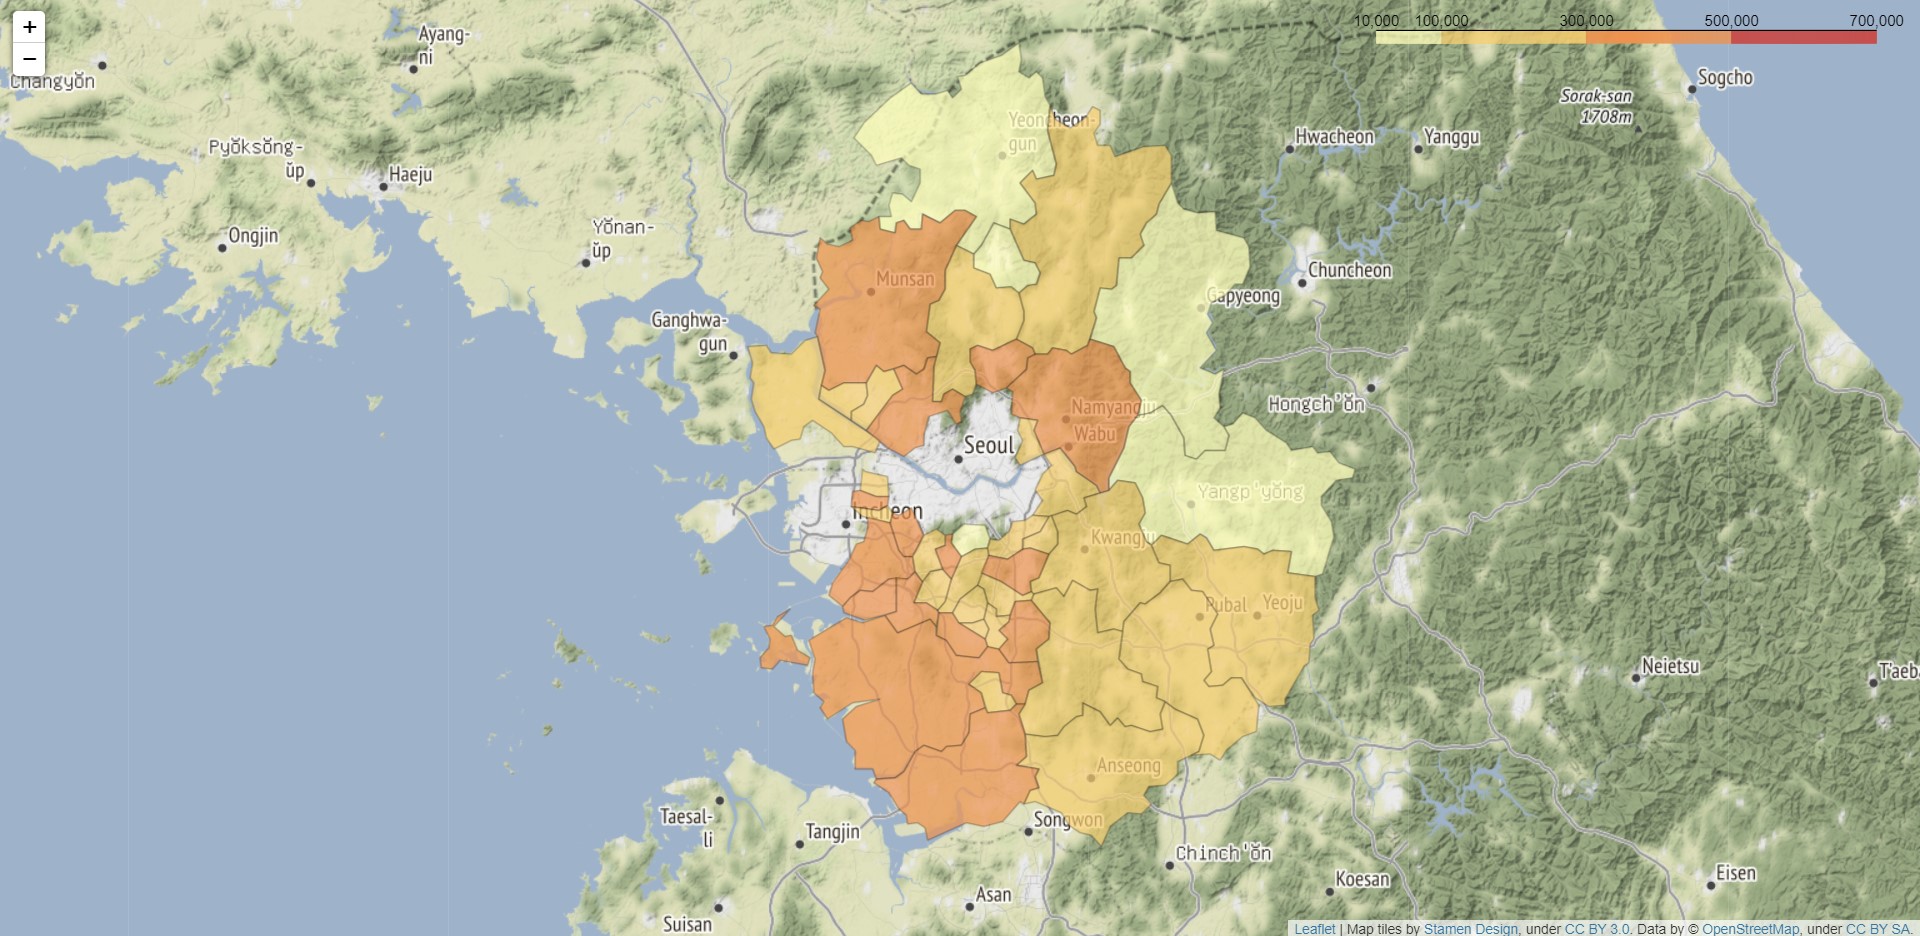
+) 2017년도 버전
