
import pandas as pd
import numpy as np
import matplotlib.pyplot as plt
5 x 6 데이터프레임 만들기
np.random.seed(123)

df1 = pd.DataFrame(np.random.randint(100,200,30).reshape(5,6)
df1.columns = list('ABCDEF')
df1.loc[2,'C'] = np.NAN

print(df1)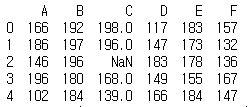
print(df1.dtypes))
# A      int32
# B      int32
# C    float64
# D      int32
# E      int32
# F      int32
# dtype: object

print(df1.describe())
#                 A           B           C           D           E           F
# count    5.000000    5.000000    4.000000    5.000000    5.000000    5.000000
# mean   159.200000  189.800000  175.250000  152.400000  174.600000  147.800000
# std     37.298794    7.496666   27.777389   24.572342   11.802542   14.515509
# min    102.000000  180.000000  139.000000  117.000000  155.000000  132.000000
# 25%    146.000000  184.000000  160.750000  147.000000  173.000000  136.000000
# 50%    166.000000  192.000000  182.000000  149.000000  178.000000  147.000000
# 75%    186.000000  196.000000  196.500000  166.000000  183.000000  157.000000
# max    196.000000  197.000000  198.000000  183.000000  184.000000  167.000000
결측치
- 확인
isna(),isnull()
df1.isna().sum()

# A    0
# B    0
# C    1
# D    0
# E    0
# F    0
# dtype: int64- 결측치 처리
dropna()fillna()
# dropna()
print(df1.dropna())  # Nan 이 있는 열 삭제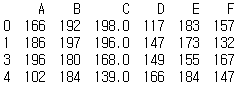
# fillna()
df1['C'] = df1['C'].fillna(df1['C'].mean())
print(df1)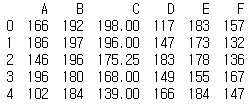
DataFrame.drop
print(df1.drop(['A','C','E'], axis=1))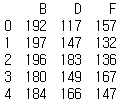
DataFrame.insert
print(df1.insert(0, 'DxF', df1['D']*df1['F']))
# None
insert 함수는 replace = True 작업을 하기 때문에, print 하면 None 이 반환 된다.
df1 을 출력해보면, 0번째 column으로 들어갔다.
print(df1)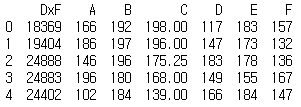
pandas concatenate
1. column 명이 똑같은 2개의 DataFrame concat
df1 = pd.DataFrame(np.random.randint(100,200,30).reshape(5,6))
df1.columns = list('ABCDEF')

df2 = pd.DataFrame(np.random.randint(10,100,30).reshape(5,6))
df2.columns = list('ABCDEF')

print(df1)
print(df2)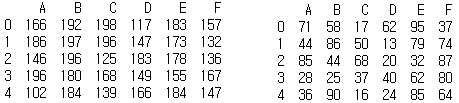
pd.concat((df1,df2))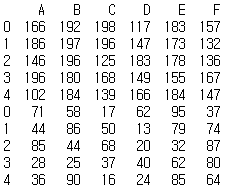
pd.concat((df1,df2),ignore_index = True)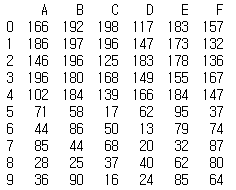
pd.concat((df1,df2),axis = 1)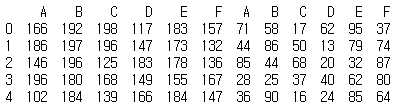
pd.concat((df1,df2),axis=1, ignore_index = True)
2. column 명이 다른 2개의 DataFrame concat
df2.columns = list('EFGHIJ')

print(df1)
print(df2)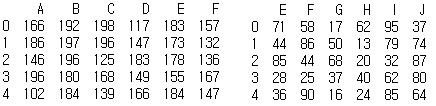
pd.concat((df1,df2))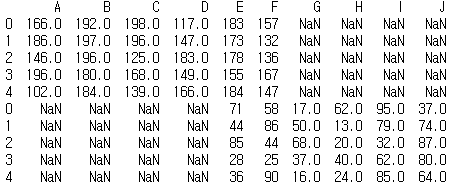
join
기본값은 join = 'outer'
join = 'inner' : 교집합만 출력
pd.concat((df1,df2), join = 'inner')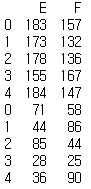
DataFrame.T
new_sample = pd.Series([10,20,30,40,50,60], index = list('ABCDEF'), name = 'new_sample')
print(new_sample)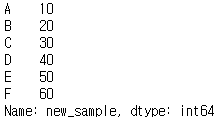
print(new_sample.to_frame().T)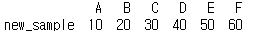
print(pd.concat((df1, new_sample.to_frame().T), ignore_index = True))

데이터 분석 / 데이터 사이언티스트 / AI 딥러닝