
🌞 seaborn 이란 ?
Seaborn 은 matplotlib 기반의 시각화 라이브러리이다. 유익한 통계 그래픽을 그리기 위한 고급 인터페이스를 제공한다.
🛻 Figure-level vs axes-level functions
seaborn에는 figure level과 axes level의 function이 나누어져 있다.
- figure level : figure + axes
- axes level : axes 만 반환 -> figure 을 따로 그려줘야 함 !

⌨️ hue (색깔) / style (marker 모양) / size (marker 크기) 옵션
seaborn 은 hue, style, size 옵션으로 categorical var 를 효과적으로 표현할 수 있다.
⌨️ 설치
!pip install seaborn🛻 relplot
import numpy as np
import pandas as pd
import matplotlib.pyplot as plt
import seaborn as sns
» seaborn 안에 내장되어 있는 'tip' dataset 으로 다양한 relplot을 그려보자.
pd_tips = sns.load_dataset('tips')
pd_tips.head()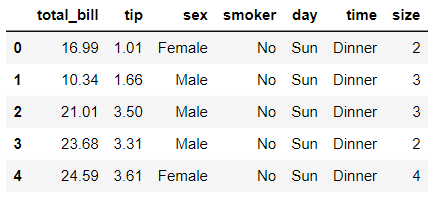 .
.
.
.
.
⌨️ scatterplot : default plot
sns.relplot(data=pd_tips, x ='total_bill', y='tip', hue = 'sex' , style = 'smoker', size = 'size')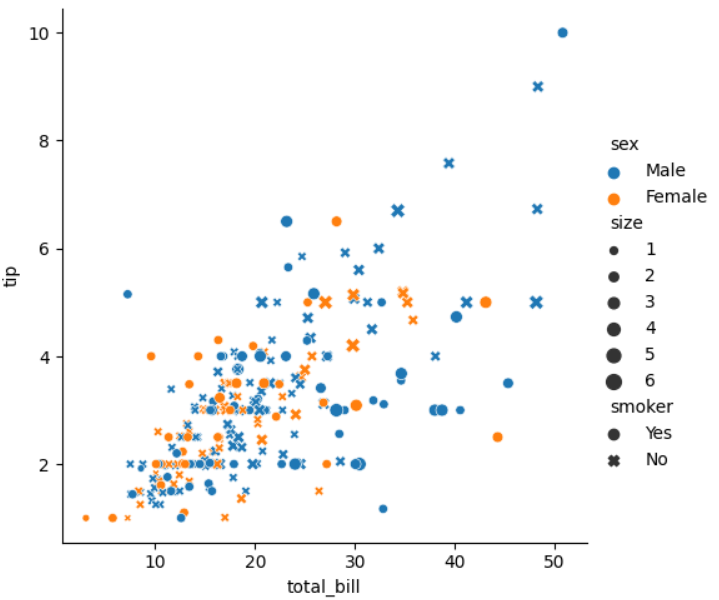
.
.
» categorical var 을 기준으로 행, 열 나누기
sns.relplot(data = pd_tips, x = 'total_bill', y = 'tip', col = 'sex', row = 'smoker')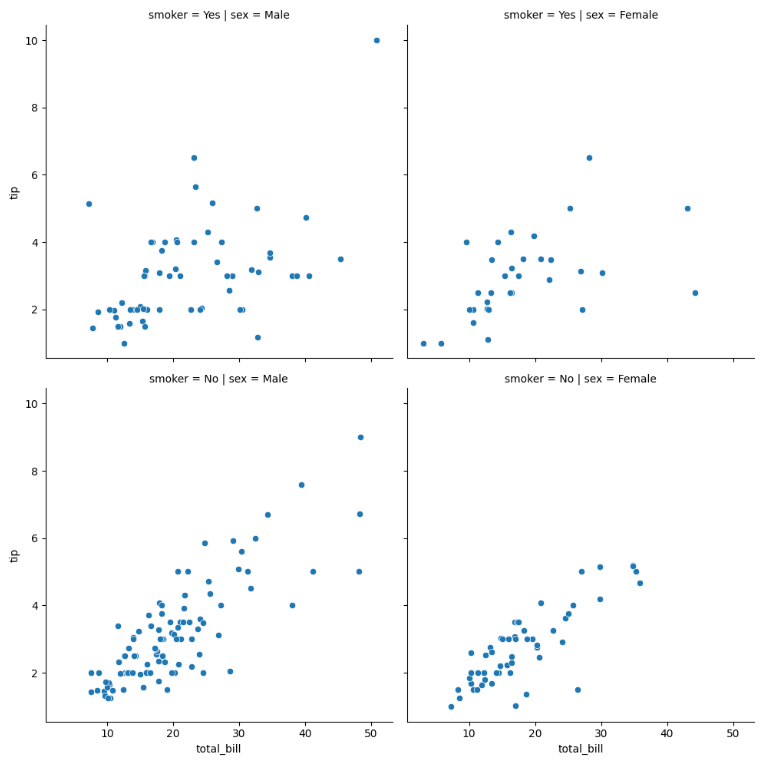
.
.
.
⌨️ lineplot
kind = 'line'
sns.relplot(dtata = pd_tips , x = 'total_bill', y = 'tip' , kind = 'line')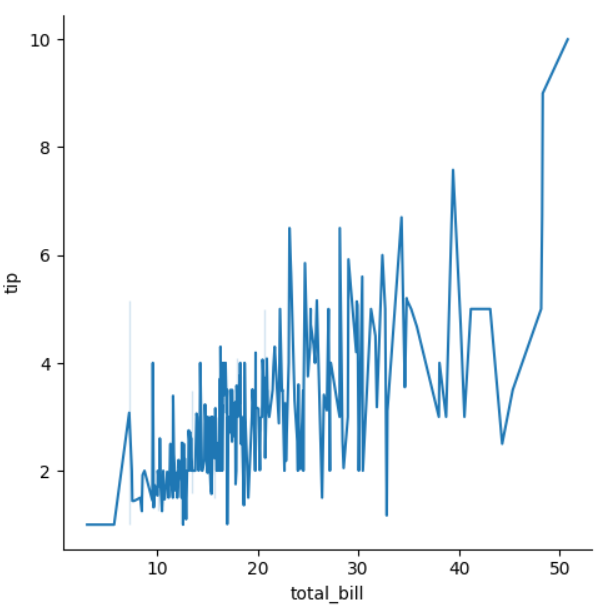 .
.
.
⌨️ figure level vs axe level
x = sns.relplot(data = pd_tips, x = 'total_bill', y = 'tip')
print(type(x))

# <class 'seaborn.axisgrid.FacetGrid'>
x 는 FacetGrid라는 객체로 figure과 axe를 모두 가지고 있다.
따라서, x.figure, x.axes를 통해 확인이 가능하다.
x.axes 는 numpy.ndarray 형태이다.
print(x.figure)  # Figure(500x500)
print(x.axes)    # [[<Axes: xlabel='total_bill', ylabel='tip'>]]

print(type(x.figure))  # <class 'matplotlib.figure.Figure'>
print(type(x.axes)) # <class 'numpy.ndarray'>x.figure을 'fig' 변수에 담고,fig.suptitle로 plot에 title을 달 수 도 있다.
fig = x.figure
fig.suptitle('my relplot')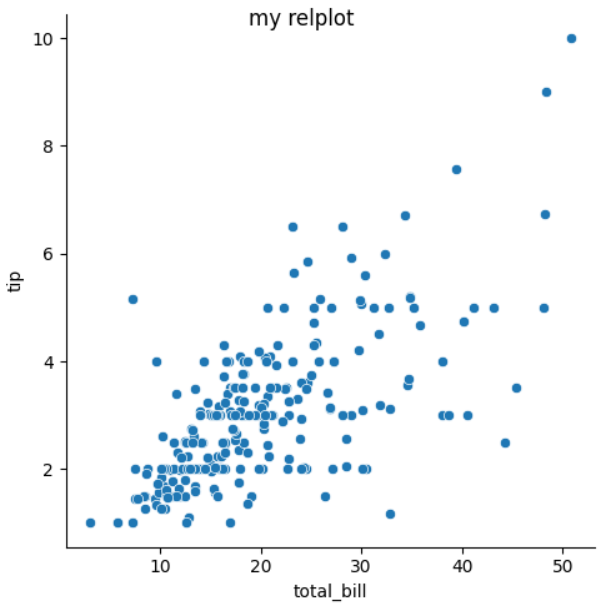 .
.
.
x.axes는 ndarray 형태로 있기 때문에,x.axes[0,0]을 통해 직접적으로 axe를 잡을 수 있다.
print(type(x.axes[0,0])) # <class 'matplotlib.axes._axes.Axes'>axe = x.axes[0,0]
axe.set_xticklabels(list(' abced'), rotation = 45)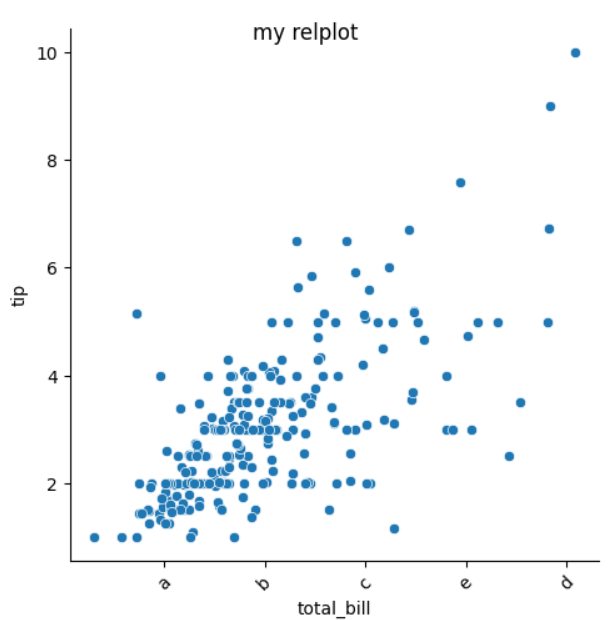 .
.
.
sns.scatterplot은 axe level이라서 figure을 자동으로 만들어주지 않기 때문에,plt.subplots을 통해 먼저 figure을 그려주어야 한다.- 또한, axe만 취급하기 때문에, 특정한 figure 에 그려넣을 수 있도록 지정할 수 있다.
- axe level 인
sns.linplot의type함수 반환값은 axe 이다.
fig, axes = plt.subplots(2,2) # (2,2) figure을 먼저 그려주기
sns.scatterplot(data = pd_tips, x = 'total_bill', y ='tip', ax = axes[0,1])
x = sns.lineplot(data = pd_tips, x = 'total_bill', y ='tip', ax = axes[1,0]) # ->
print(type(x))  # 반환값 : axe

데이터 분석 / 데이터 사이언티스트 / AI 딥러닝