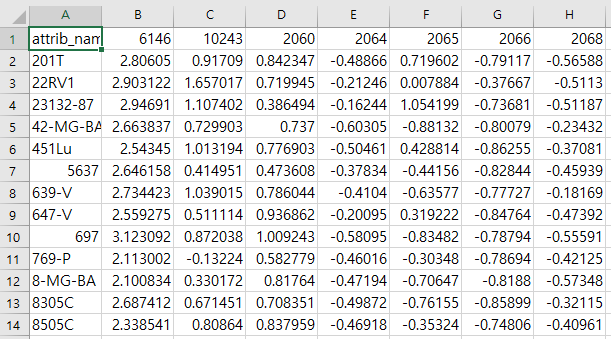
cell line과 gene으로 구성된 GDSC expression 데이터
import random
import numpy as np
import pandas as pd

df = pd.read_csv('expr_methy_total\P_TCGA_methy_7466_3231.csv',index_col=0,delimiter=',')
df

colors = [sns.xkcd_rgb[random.choice(list(sns.xkcd_rgb.keys()))] for _ in range(len(df.columns))]
plt.figure(figsize=(8, 6))

for gene in range(len(df.columns)):
    print(df.columns[gene])

    data_col = np.array(df[df.columns[gene]])

    mean_col1 = np.mean(data_col)
    std_dev_col1 = np.std(data_col)

    sns.histplot(data_col, kde=True, color=colors[gene])

    x_col1 = np.linspace(mean_col1 - 3 * std_dev_col1, mean_col1 + 3 * std_dev_col1, 100)
    y_col1 = (1.0 / (std_dev_col1 * np.sqrt(2 * np.pi))) * np.exp(-0.5 * ((x_col1 - mean_col1) / std_dev_col1) ** 2)
    plt.plot(x_col1, y_col1, label=str(df.columns[gene]), color=colors[gene])


plt.title('Gaussian Distributions of GDSC methylation')
plt.xlabel('Value')
plt.ylabel('Probability Density')
plt.legend()
plt.grid(True)

plt.show()

cell line과 gene으로 구성된 GDSC methylation 데이터
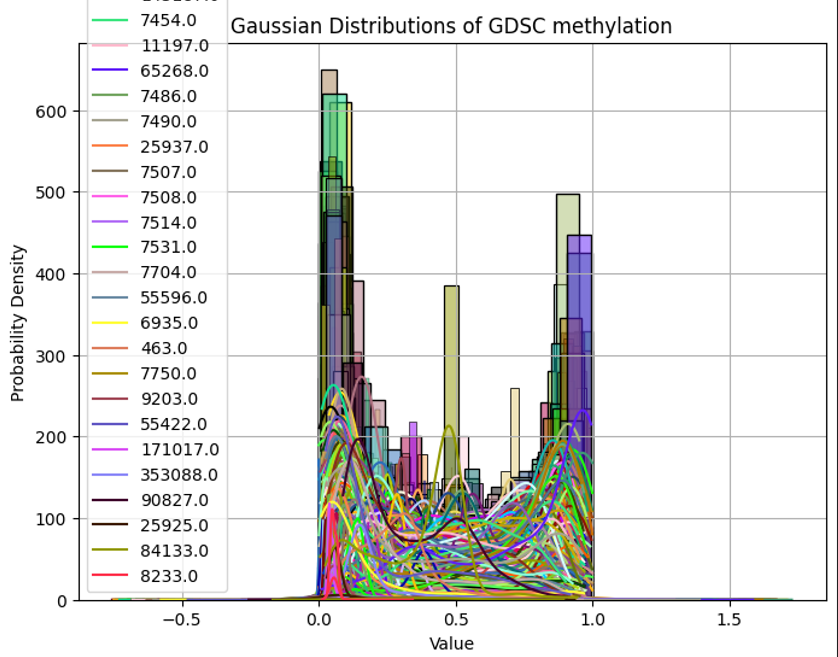
두 데이터의 분포가 다름을 확인할 수 있다.

ddochi
정똥치 화이팅!