이제 elk에 대한 hello world는 끝난 거 같아서
logstash를 보고 있어요
udemy의 Frank Kane 형님 강의를 정리했어요
출처: https://www.udemy.com/course/elasticsearch-7-and-elastic-stack/
Logstash, Filebeat 비교
예전에는 logstash 뿐이 없었지만, 더 가벼운 filebeat가 있습니다. logstash로 부하를 많이 주면 웹서버가 내려갈 수 도 있지만, filebeat는 가용성/확장성 측면에서 이점이 많다고 해요. ELK stack이라고 불리게된 이유도 ELKB라고 하면 어감이 이상하다고 하니, filebeat가 그만큼 강력하다고 볼 수 있죠
Logstash
- 데이터 집계, 변환, 저장
The Elastic Stack (also known as the ELK Stack) is used across a variety of use cases — from observability to security, from enterprise search to business analytics. Join us as we go over the basics and show you how to get started using the Elastic Stack for your log and metrics analytics — the first steps on the path to observability.
Filebeat
- 부하가 덜 감, 확장이 용이
Filebeat is a lightweight shipper for forwarding and centralizing log data. Installed as an agent on your servers, Filebeat monitors the log files or locations that you specify, collects log events, and forwards them either to Elasticsearch or Logstash for indexing.
-
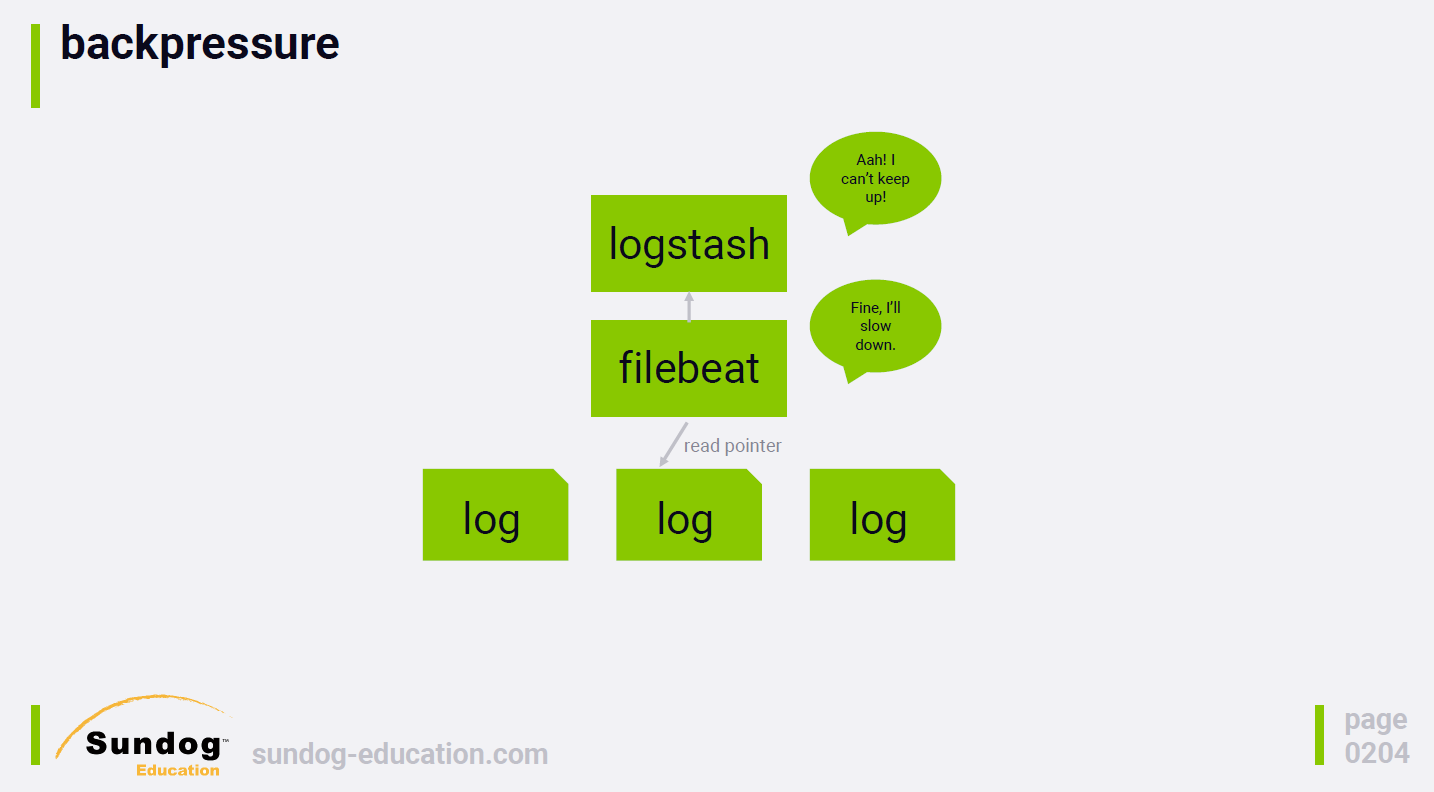
아래처럼 backpressure도 조절할 수 있어요
(source: sundog-education, udemy elasticsearch 7.0)
-
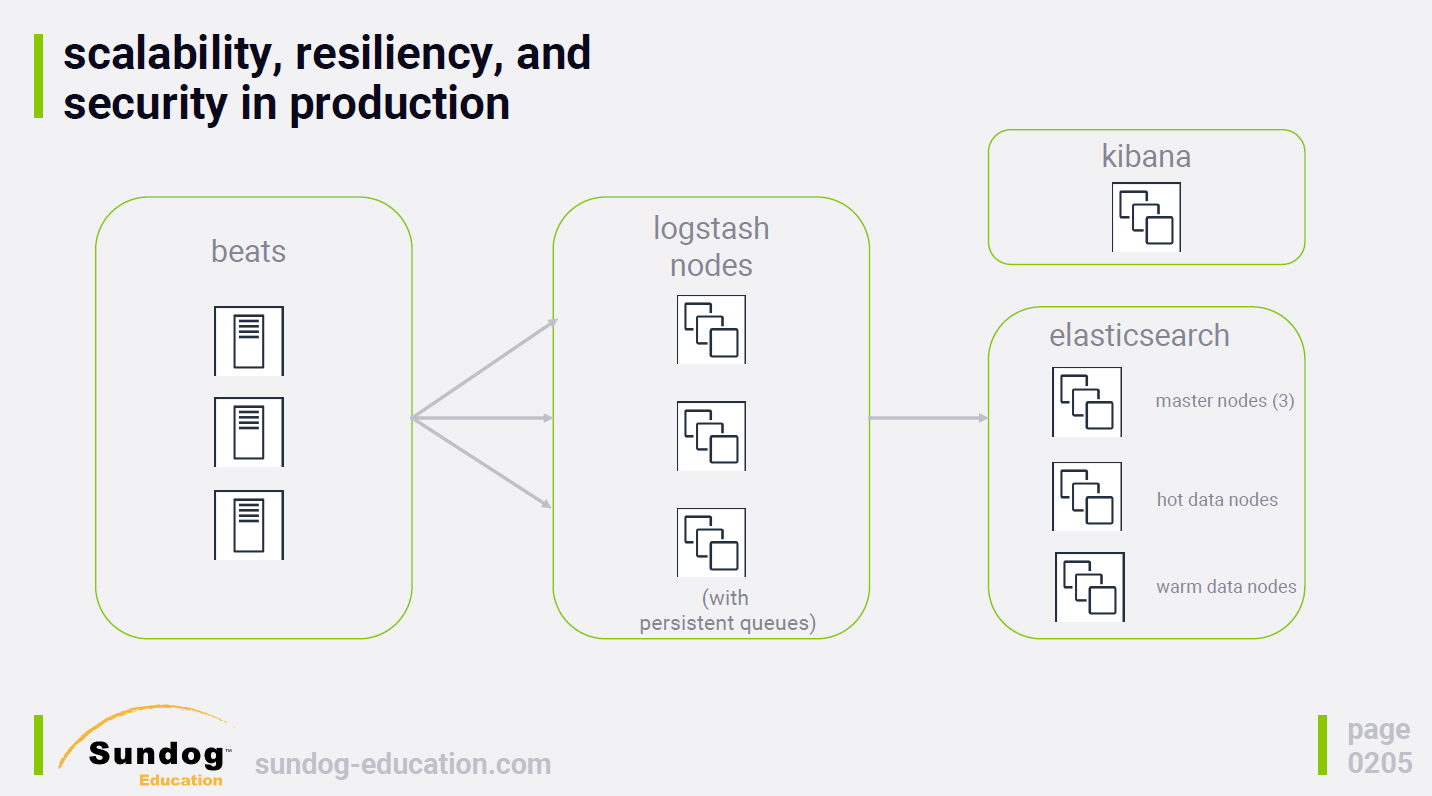
안전성 측면에서도, persistence que가 있기 떄문에 최소 한번은 전송을 보장합니다.
(source: sundog-education, udemy elasticsearch 7.0)
Logstash, Filebeat 정리
- 실습하면서 예시를 정리해봤어요
Logstash(grok)
csv, jdbc, json, log 파일을 indexing 해봤는데 거의 비슷하더라고요
그러던 중 grok 이라는 거를 보다가 재밌어서 정리해보려고요. 공식 문서에 들어가면 grok 말고도 여러 필터가 있어요
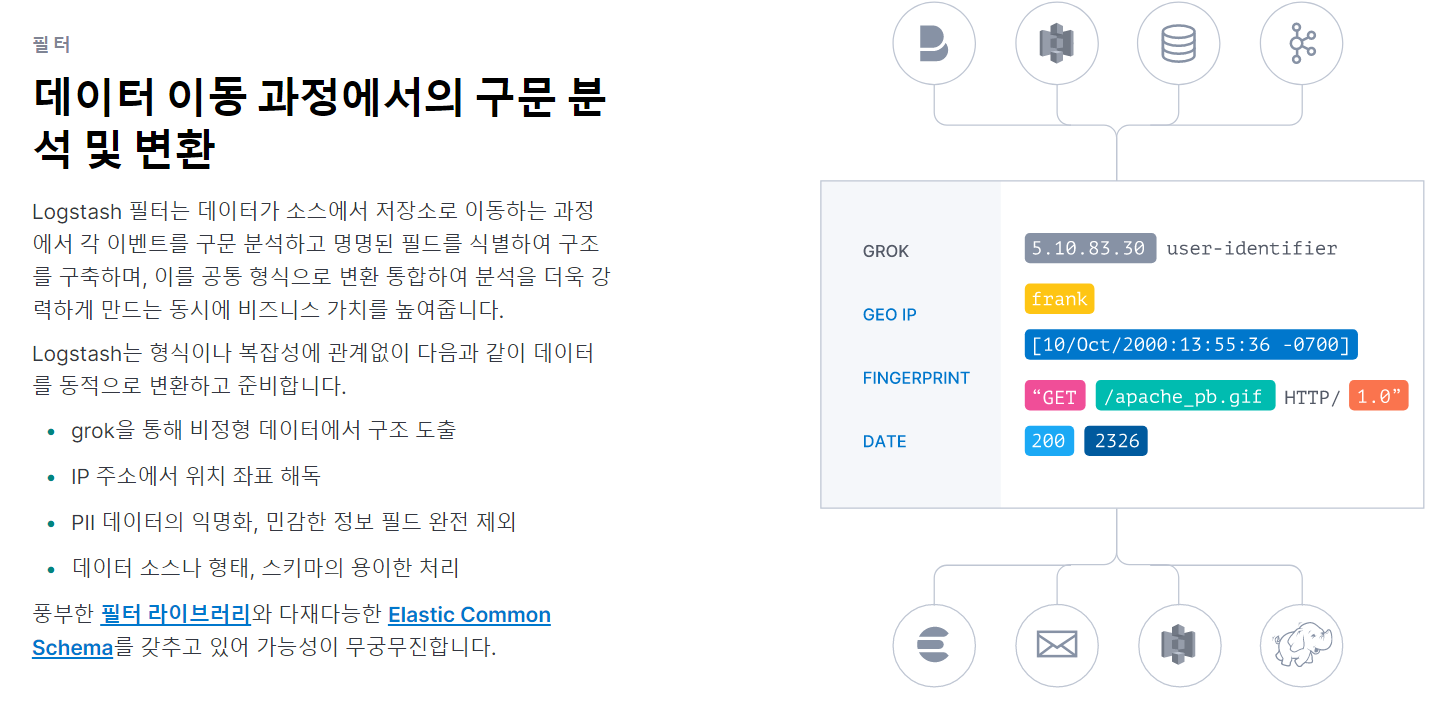
grok은 이미 저장되어 있는 패턴
쉽게 말해서, 특정 값을 %{AAAA:변수} 로 입력하면 알아서 정리를 해주는 거에요
샘플 로그 분석하기
먼저 아래와 같은 로그를 분서할거에요
2020-10-11T09:49:35Z INFO variable server value is tomcat
-
sample_log
time : 2020-10-11T09:49:35Z
loglevel : INFO
나머지 : variable server value is tomcat -
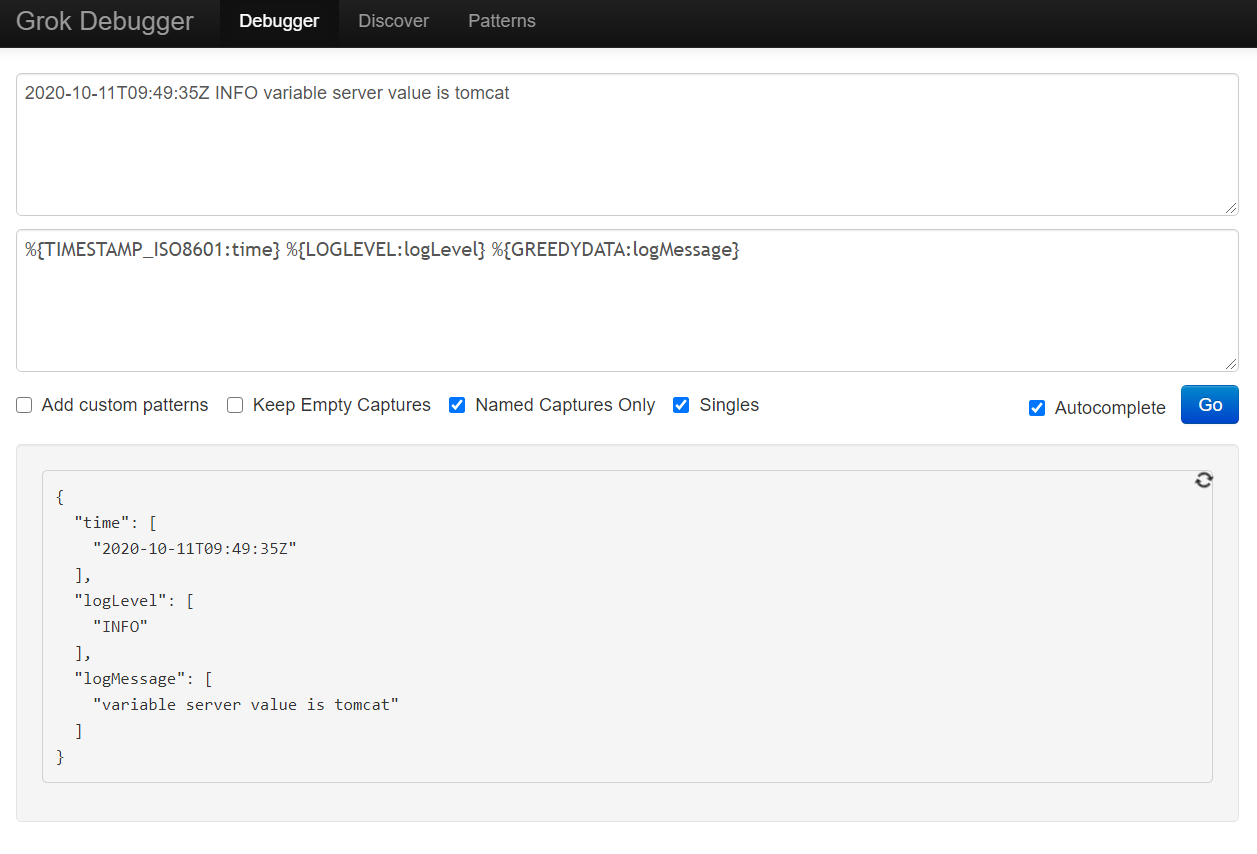
grok 패턴
%{TIMESTAMP_ISO8601:time}
%{LOGLEVEL:logLevel}
%{GREEDYDATA:logMessage} -
grok debugger(test)
(https://grokdebug.herokuapp.com/)
실제 코드
-
grok filter 없이 logstash로 넣으면
"message" : "2020-06-04T06:56:04Z DEBUG initializing
-
grok filter 로 넣으면
"time" : "2020-06-04T06:56:04Z",
"logLevel" : "DEBUG",
"logMessage" : "initializing checksum",
"message" : "2020-06-04T06:56:04Z DEBUG initializing checksum" -
logstash.conf
//Timetstamp, loglevel, greedydata로 나누기
filter {
	grok {
		match => {
          "message" => [
            '%{TIMESTAMP_ISO8601:time} %{LOGLEVEL:logLevel} %{GREEDYDATA:logMessage}'
          ]
        }
    }
}
Filebeat
가볍다고 이야기하니, 그런줄 알지만 최소 한번 도착은 보장하고 알아서 부하도 분산해준다니 물건인 것 같다.
설정도 간단해요. 설정 파일 내에 경로를 쓰고 실행하면 됩니다.
저는 아래 var.paths 부분을 샘플 로그로 수정했어요
filebeat 설치(ubunuto 18.0.4)
sudo apt-get install filebeat
sudo systemctl restart elasticsearch.service
샘플 로그데이터
wget http://media.sundog-soft.com/es/access_log
(copyright: sundog-education)
설정 수정
sudo mv apache.yml.disabled apache.yml
sudo nano /etc/filebeat
# Module: apache
# Docs: https://www.elastic.co/guide/en/beats/filebeat/7.8/filebeat-module-apache.html

 module: apache
  # Access logs
  access:
    enabled: true

    # Set custom paths for the log files. If left empty,
    # Filebeat will choose the paths depending on your OS.
    var.paths: ["/home/student/logs/access*"]

  # Error logs
  error:
    enabled: true

    # Set custom paths for the log files. If left empty,
    # Filebeat will choose the paths depending on your OS.
    var.paths: ["/home/student/logs/error*"]
실행
sudo systemctl start filebeat.service
만약 위도우에서 수정한다면
.\filebeat.exe -c .\filebeat.yml -e -v