1.학습한 내용
Machine Learning
-
아이리스 꽃 구별하기 모델
-
데이터에 이름을 붙이는 작업 = 라벨링(시간,돈이 많이 든다)
-
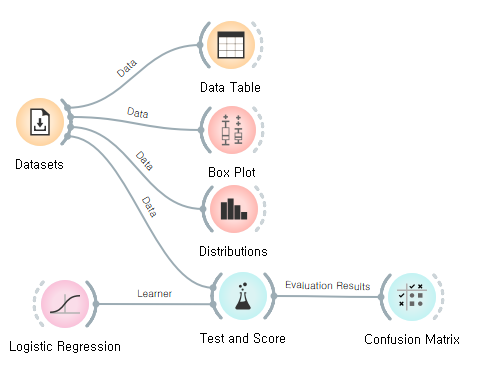
Logistic Regression = 중간 선을 가지고 그룹을 나누어 분류
-
Test and Score, Confusion Matrix 평가지표
①Precision(정밀도) = true라 분류한 것 중 실제 true인 비율
②Recall(재현율) = 실제 true인것 중 모델이 true라 예측한 비율
③F1 score = Precision, Recall 조화평균
④Accuracy(CA, 정확도)
⑤AUC = ROC 그래프 아래의 면적, 여러 임계치들 기준, Recall fallout의 변화를 시각화
(fallout = false인 data중 모델이 true라고 예측한 비율) -
CA = 100%인 모델?
=> 새로운 데이터에 대해서는 형편없을 수 있다
=> 너무 딱맞을 때 overfit
=> 너무 클 때 underfit (학습 자체가 너무 떨어진다)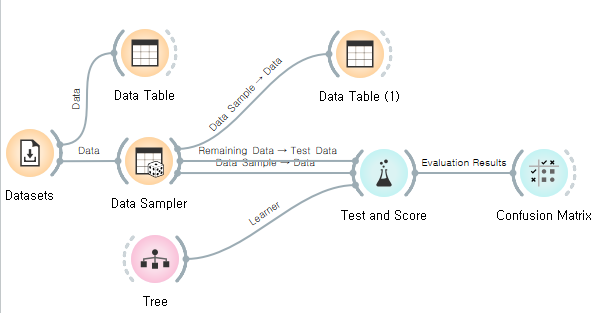
-
cross validation
=> 표본 데이터의 크기가 작을 때 사용
=> subset = 지정 단위로 쪼개서 숫자를 매겨 각각을 테스트, 각각 결과를 대조 결합 결론
Deep Learning
- 이미지 분석 모델
- 아나콘다를 통해 jupyter notebook 활성화
import requests
import matplotlib.pyplot as plt
from PIL import Image
from io import BytesIO
import json
subscription_key = '234a97e32f8447c19fbf3836053ff32c'
vision_base_url = 'https://daeguaivision00.cognitiveservices.azure.com/vision/v2.0/'
analyze_url = vision_base_url + 'analyze'
image_url = 'https://img1.daumcdn.net/thumb/R1280x0/?scode=mtistory2&fname=http%3A%2F%2Fcfile22.uf.tistory.com%2Fimage%2F2129B94155A18E78060049'
response = requests.get(image_url)
image = Image.open(BytesIO(response.content))
image- 현재 이미지 불러내는것 까지 완료
- 이미지 파일은 다 압축되어있기 때문에 byte단위로 재구성이 필요하다
2. 학습내용 중 어려웠던 점.
- 아직은 실습과정이 따라가기만 하는터라 크게 어렵지는 않지만 실습에 들어가서 하려면 쉽지 않을 것 같다.
- 코드들을 어떻게, 왜 사용해야 하는지 익숙해져야 할 것 같다.
3. 해결방법
- 이전에 했던 것들을 반복해보고 깃에 깔끔하게 정리하는 걸 해봐야겠다.
4. 학습소감
- 딥러닝을 했을 때 최종적으로 도착해야할 cognitive service를 보았다. 너무 신기했고 내가 과연 저런 일들을 할 수 있는데까지 도달할 수 있을지 의문이든다. 그래도 어제보다 하나라도 나아진게 있는 오늘이었으면 좋겠다.

코딩공부중