결측치 다루기
사전준비
import numpy as np
import pandas as pd
import matplotlib
import missingno as msno
df = pd.read_csv('bike_sharing_daily.csv')
from matplotlib import pyplot as plt
결측치 분포 시각화하기
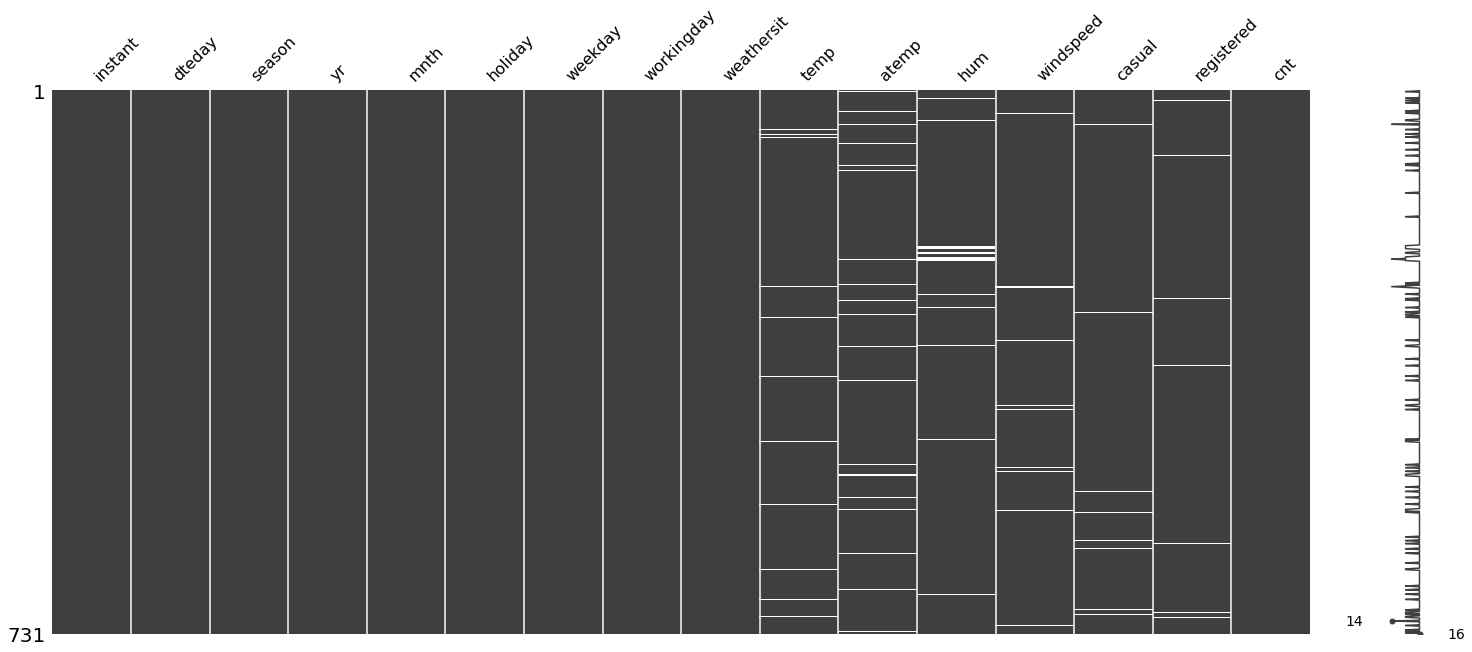
# 결측치 분포 시각화
msno.matrix(df)
plt.show()
msno.bar(df)
plt.show()

문자열 기준 결측치 확인
- 결측치가 아닌데 결측치인 경우
- 해당 컬럼에 하나라도 공백 문자열이 존재하는가
df.apply(lambda x : x.eq('').any())
결측치 버리기
- 행을 지운다
해당 행의 모든 컬럼의 값이 널인 경우
df_drop_all = df.dropna(how='all')
해당 행의 컬럼 값이 하나라도 널인 경우
df_drop_any = df.dropna(how='any')
해당 행의 특정 갯수 이상 컬럼 값이 널인경우
df_drop_thresh = df.dropna(thresh=10)
해당 행의 특정 컬럼에 대해서만 결측치 판별
df_drop_subset = df.dropna(subset=['atemp'])
결측치 채우기
- df_fill_0 = df.fillna(0)
- df_fill_min = df.fillna(df.min())
- df_fill_max = df.fillna(df.max())
- df_fill_mean = df.fillna(df.mean())
- df_fill_mode = df.fillna(df.mode())
- df_fill_median = df.fillna(df.median())
df_fill_with_column = df.fillna({'temp' : df['temp'].max()})
# method 사용
df.fillna(method='ffill')
df.fillna(method='bfill')
df.fillna(method='bfill',limit=1)

# 컬럼 선택
df['temp'].fillna(method='ffill')

# 보간법
df.interpolate(method='values')
시간
- df['dteday'] -> datetime으로 형변환
- 'dteday'를 인덱스로
df['dteday'] = pd.to_datetime(df['dteday'])
df = df.set_index('dteday')
- 시계열 데이터 - 시간에 흐름에 따라 적절히 증감한 값으로 결측치 채우기
df_fill_interpolate_time = df.interpolate(method='time')
가보자가보자~