steel_image
- 정형 데이터 -> 수치와 의미
- 요약, 축약, 평가 방법이 달라지는 것
- RLE - 29102 12 29346 24 29602 24 29858 24 30114 24
- 29102번째 픽셀부터
- 12 픽셀이 손상 부위
- 29346번째 픽셀부터
- 총 24픽셀이 손상부위
- RLE : AAAAABCEEEEE -> A5B1C1E5
- RLE - 29102 12 29346 24 29602 24 29858 24 30114 24
사전준비
import numpy as np
import pandas as pd
from matplotlib import pyplot as plt
train_df = pd.read_csv('철강이미지데이터/data/train.csv')
데이터와 이미지
- 특정 폴더의 파일 목록을 불러온다
from glob import glob
TRAIN_PATH = '철강이미지데이터/data/train_images/'
train_fns = glob(TRAIN_PATH+"*.jpg")
train_df['ClassId'].unique()
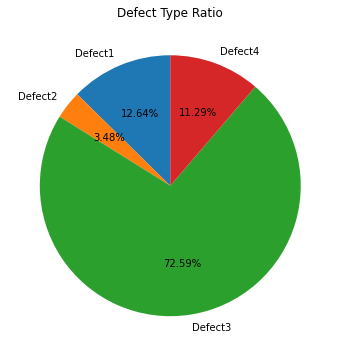
class id에 따른 손상의 종류들의 갯수
defect1_count = train_df[train_df['ClassId']==1]['EncodedPixels'].notnull().count()
defect2_count = train_df[train_df['ClassId']==2]['EncodedPixels'].notnull().count()
defect3_count = train_df[train_df['ClassId']==3]['EncodedPixels'].notnull().count()
defect4_count = train_df[train_df['ClassId']==4]['EncodedPixels'].notnull().count()
defect1_count, defect2_count, defect3_count, defect4_count
labels = ['Defect1', "Defect2", "Defect3", "Defect4"]
size_data = [defect1_count, defect2_count, defect3_count, defect4_count]
fig = plt.figure(figsize=(12,6))
ax = fig.add_subplot(1,1,1)
options = ax.pie(size_data, labels=labels,autopct="%1.2f%%", startangle=90)
ax.set_title("Defect Type Ratio")
2. 이미지당 손상의 갯수
count_per_image = train_df.groupby('ImageId')['EncodedPixels'].count()
count_per_image.count()
count_per_image[count_per_image==1].count()
count_per_image[count_per_image==2].count()
count_per_image[count_per_image==3].count()
count_per_image[count_per_image==4].count()
이미지에 손상 부위 표시
- 이미지 -> 사이즈를 맞춘다.
- A : 1600~1000 -------> 800 x 600
- B : 800~600 --------> 400 x 500
- 수치 -> 정규화
- A : 1~10000
- B : 30~70
- record1 : A(10). B(30)
- record2 : A(30), B(50)
사이즈가 다른것은 없는지, 사이즈를 같게 만드는 과정
from PIL import Image
test_image = Image.open(train_fns[0])
이미지 사이트 체크
widths = []
heights = []
for filename in train_fns:
    test_image = Image.open(filename)
    width, height = test_image.size
    widths.append(width)
    heights.append(height)
max(widths), min(widths), max(heights), min(heights)
- 이미지랑 같은 사이즈의 np.array 만들기
- EncodedPixels 데이터를 해석
image_id = train_fns[0].split('/')[-1]
encoded_pixels = train_df[train_df['ImageId']==image_id]['EncodedPixels'].values
encoded_pixels 이 있는 수만큼 마스크 구하기
mask = np.zeros(1600*256, dtype=np.uint8)
encoded_data = [int(x) for x in encoded_pixels[0].split()]
starts = encoded_data[0::2]
lengths = encoded_data[1::2]
for start, length in zip(starts,lengths):
    mask[start-1:start-1+length] = 1
mask = mask.reshape((256,1600), order='F')
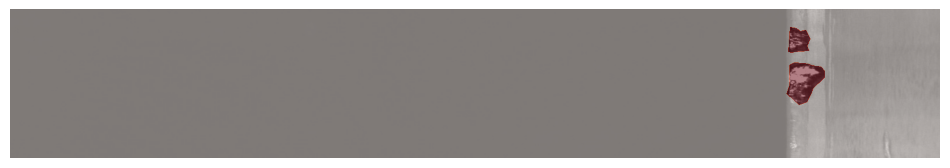
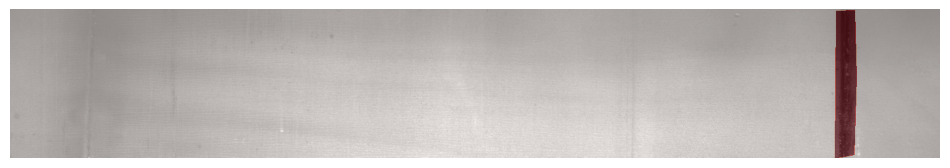
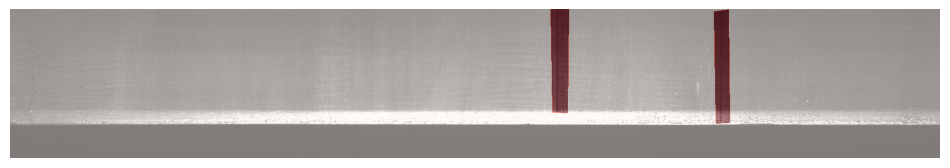
이미지에 손상 부위 그리기
fig = plt.figure(figsize=(12,12))
ax = fig.add_subplot(1,1,1)
image = Image.open(train_fns[0])
ax.imshow(image) # 원본 이미지 표시
# 손상 부위 표시
ax.imshow(mask, cmap="Reds", alpha=0.5)
#ax.imshow(?) # 이미지랑 똑같은 크기의 손상 부위
ax.axis('off')
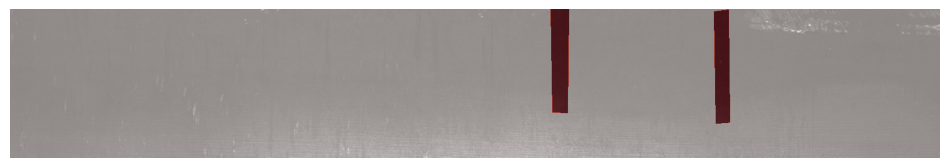
def get_masks(encoded_pixels):
    masks = []
    for pixel in encoded_pixels:
        mask = np.zeros(1600*256, dtype=np.uint8)
        encoded_data = [int(x) for x in pixel.split()]
        starts = encoded_data[0::2]
        lengths = encoded_data[1::2]
        for start, length in zip(starts,lengths):
            mask[start-1:start-1+length] = 1

        mask = mask.reshape((256,1600), order='F')
        masks.append(mask)
    return masks
def draw_plot(filename):
    image_id = filename.split('/')[-1]
    encoded_pixels = train_df[train_df['ImageId']==image_id]['EncodedPixels'].values
    defect_types = train_df[(train_df['ImageId'] == image_id)]['ClassId'].values
    if len(encoded_pixels):
        masks = get_masks(encoded_pixels)
        fig, axs = plt.subplots(1,1+len(masks), figsize=(20,3))

        image = Image.open(filename)
        axs[0].imshow(image) # 원본 이미지 표시
        axs[0].axis('off')
        for index, mask in enumerate(masks):
            axs[index+1].imshow(image) # 원본 이미지 표시
            axs[index+1].imshow(mask, cmap="Reds", alpha=0.5)
            axs[index+1].set_title('Mask with defect #{}'.format(defect_types[index]))
            axs[index+1].axis('off')

        axs[0].set_title('Original Image')
    # 1. 오리지널 이미지 - 그래프 타이틀
    # 2. 손상부위 타입 1,2,3,4
for filename in train_fns:
    image_code = filename.split('/')[-1]
    try:
        if (train_df.groupby(['ImageId'])['EncodedPixels'].count().loc[image_code] > 1):
            draw_plot(TRAIN_PATH + image_code)
    except:
        pass


# 1. 하나의 이미지에 손상부위 1개 그리기
# 1) 이미지 파일명을 전달 받아서 화면에 이미지와 손상 부위 그리기
# 2) 마스크 만들기
for filename in train_fns:
    image_id = filename.split('/')[-1]
    encoded_pixels = train_df[train_df['ImageId']==image_id]['EncodedPixels'].values
    if len(encoded_pixels):
        # 마스트 그리기
        mask = np.zeros(1600*256, dtype=np.uint8)
        encoded_data = [int(x) for x in encoded_pixels[0].split()]
        starts = encoded_data[0::2]
        lengths = encoded_data[1::2]
        for start, length in zip(starts,lengths):
            mask[start-1:start-1+length] = 1

        mask = mask.reshape((256,1600), order='F')

        fig = plt.figure(figsize=(12,12))
        ax = fig.add_subplot(1,1,1)
        image = Image.open(filename)
        ax.imshow(image) # 원본 이미지 표시
        # 손상 부위 표시
        ax.imshow(mask, cmap="Reds", alpha=0.5)
        #ax.imshow(?) # 이미지랑 똑같은 크기의 손상 부위
        ax.axis('off')

# 2. 전체 이미지에 손상부위 1개 그리기
# 3. 전체 이미지에 손상부위 모두 그리기


마스크 넓이 계산
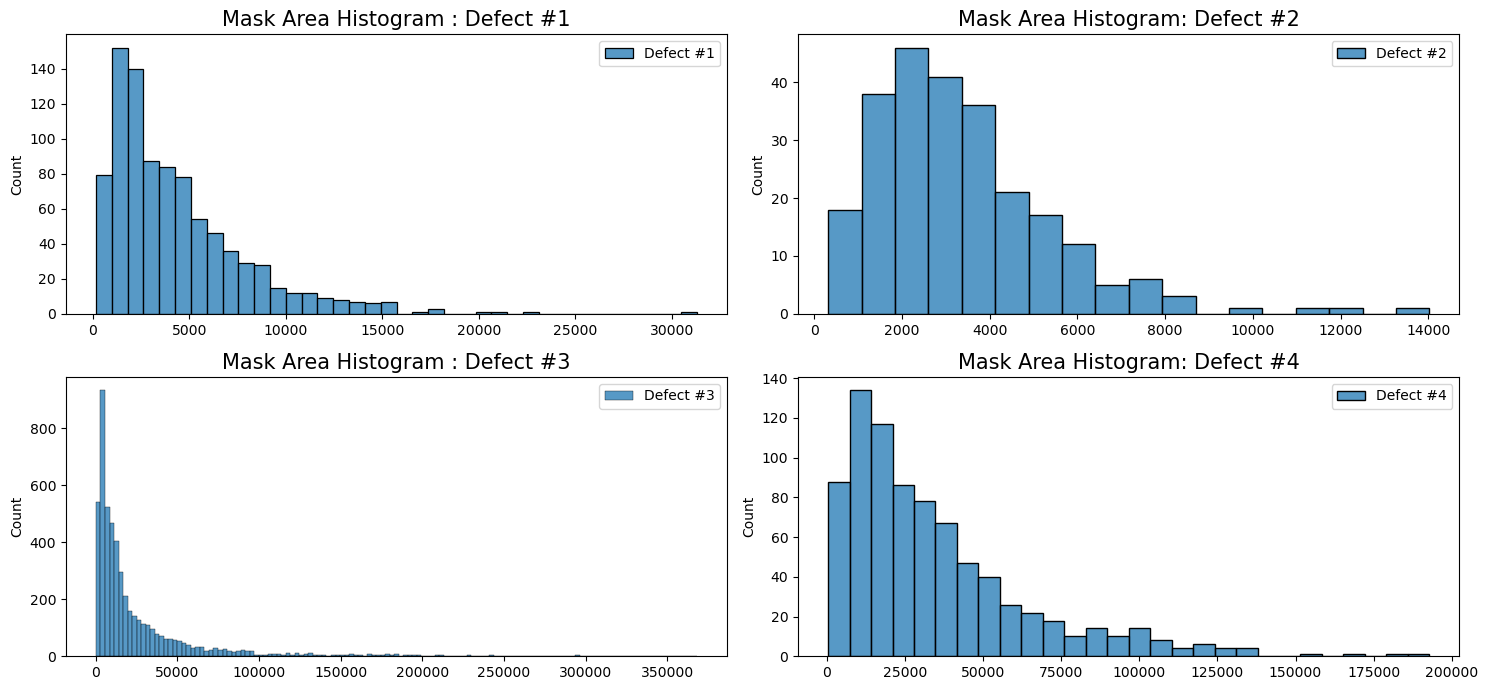
def add_mask_areas(train_df):
    masks_df = train_df.copy()
    masks_df['Area'] = 0

    for i, row in masks_df.iterrows():
        rle = masks_df['EncodedPixels'][i]
        array = np.asarray([int(x) for x in rle.split()])
        lengths = array[1::2]
        masks_df['Area'].loc[i] = np.sum(lengths)

    return masks_df
masks_df = add_mask_areas(train_df)
seaborn
import seaborn as sns
# Plot Histograms and KDE plots
plt.figure(figsize=(15,7))

plt.subplot(221)
sns.histplot(masks_df[masks_df['ClassId'] == 1]['Area'].values, label='Defect #1')
plt.legend()
plt.title('Mask Area Histogram : Defect #1', fontsize=15)

plt.subplot(222)
sns.histplot(masks_df[masks_df['ClassId'] == 2]['Area'].values, label='Defect #2')
plt.legend()
plt.title('Mask Area Histogram: Defect #2', fontsize=15)

plt.subplot(223)
sns.histplot(masks_df[masks_df['ClassId'] == 3]['Area'].values, label='Defect #3')
plt.legend()
plt.title('Mask Area Histogram : Defect #3', fontsize=15)

plt.subplot(224)
sns.histplot(masks_df[masks_df['ClassId'] == 4]['Area'].values, label='Defect #4')
plt.legend()
plt.title('Mask Area Histogram: Defect #4', fontsize=15)

plt.tight_layout()
plt.show()
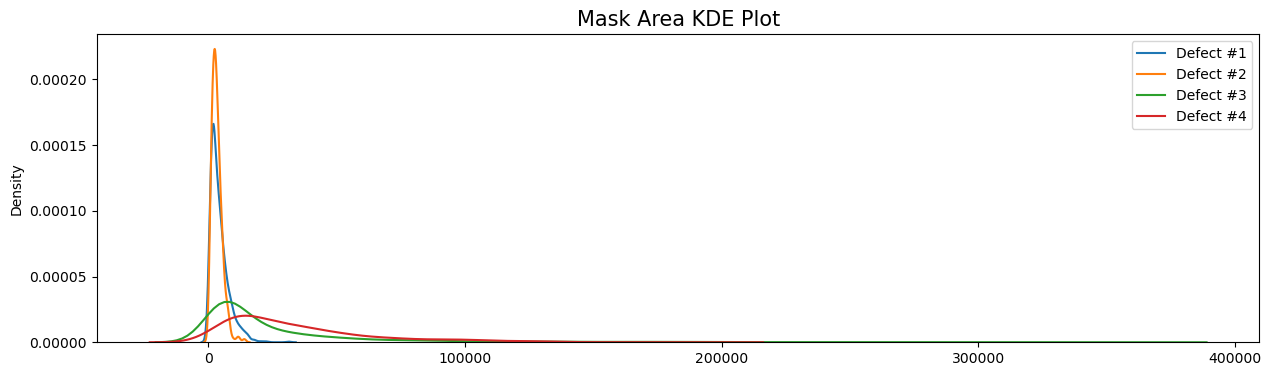
plt.figure(figsize=(15,4))

plt.subplot(111)
sns.kdeplot(masks_df[masks_df['ClassId'] == 1]['Area'].values, label='Defect #1')
sns.kdeplot(masks_df[masks_df['ClassId'] == 2]['Area'].values, label='Defect #2')
sns.kdeplot(masks_df[masks_df['ClassId'] == 3]['Area'].values, label='Defect #3')
sns.kdeplot(masks_df[masks_df['ClassId'] == 4]['Area'].values, label='Defect #4')
plt.legend()

plt.title('Mask Area KDE Plot', fontsize=15)
이상 부위가 넓은 이미지 찾기
large_masks_df = masks_df[masks_df['Area'] > 200000]
print_df = large_masks_df[(TRAIN_PATH+large_masks_df['ImageId']).isin(train_fns)]

가보자가보자~