01-텐서플로를 이용한 선형회귀
1-1. 텐서플로를 이용한 선형 회귀
- 하이퍼파라미터를 설정하는 방법 확인
- 선형 회귀로 학습하는 방법 익히기
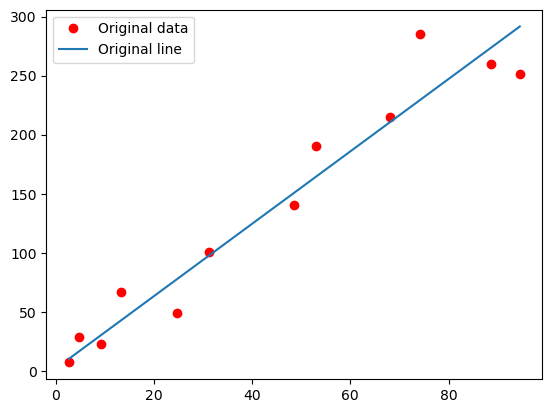
- 원래 데이터와 최적화한 직선을 시각화한 결과로 비교하기
🟣 필요한 모듈 불러오기
# 텐서플로 라이브러리와 시각화 라이브러리인 matplotlib.pyplot을 불러오기
import tensorflow as tf
import matplotlib.pyplot as plt

tf.__version__
# 결과확인
# '2.6.0'
🟣 하이퍼파라미터 설정하기
- 하이퍼 파라미터 생성
- 학습률 learning_rate
- 학습횟수 num_epochs
- 진행상태 출력할 단계 step_display
learning_rate = 0.01
num_epochs = 1000
step_display = 50
🟣 학습에 이용할 데이터 정의
# x와 y좌푯값을 각각 정의 --> x, y의 개수는 같아야 함
x = [2.7, 4.8, 9.3, 13.4, 24.8, 31.3, 48.5, 53.0, 68.1, 74.2, 88.6, 94.5]
y = [7.0, 28.8, 22.8, 67.1, 48.8, 100.2, 140.0, 190.2, 215.2, 285.6, 260.3, 251.1]

# assert문을 활용해 x, y의 개수가 같지 않으면 에러가 발생하게 됨
# len(x)의 실행 결과로 총 개수는 12개임을 확인 할 수 있음
assert len(x) == len(y)
len(x)

# 실행 결과
# 12- 텐서플로의 대표적 변수는 가중치와 편향임
- 따라서, 가중치 weight와 편향 bias를 변수로 설정함
# tf.random_uniform() 함수는 무작위 수로 초기화
# [1]은 변수의 형태, -1.0은 최솟값, 1.0은 최댓값 (즉, -1.0~1.0 사이의 스칼라값을 무작위로 생성)
# name은 텐서플로에 이름을 알려주려고 사용
weight = tf.Variable(tf.random.uniform([1], -1.0, 1.0), name='weight')
bias = tf.Variable(tf.random.uniform([1], -1.0, 1.0), name='bias')

# compatibility mode를 적용해 1.x 버전의 기능을 그대로 사용할 수 있음
# 위와 같이 tf.disable_v2_behavior()를 실행해서 tf.placeholder를 그대로 사용할 수 있음
import tensorflow.compat.v1 as tf
tf.disable_v2_behavior()

# 모델을 학습시킬 때 x좌표와 y좌표를 피드해줄 플레이스홀더 정의함
# 앞에서 가중치와 편향은 변수로 정의했으므로, 텐서플로의 계산 그래프를 구축할 때, 메모리 저장
x_true = tf.placeholder(dtype=tf.float32, name='x_true')
y_true = tf.placeholder(dtype=tf.float32, name='y_true')- 플레이스홀더는 그래프를 구축할 때, 메모리에 저장하지 않으며, 그래프를 실제 실행할 때, 피드하면서 메모리에 저장함
🟣 그래프 만들기
# 예측값인 y_pred를 가중치 weight와 x 좌표를 피드해줄 플레이스 홀더 x_true의 곱에 편향 bias를 더한 값으로 정의함
y_pred = tf.add(tf.math.multiply(weight, x_true), bias)

# 예측값인 y_pred에서 실제값인 y_true를 뺀 값에 제곱해서 평균을 계산한 값이 비용(cost or loss)
cost = tf.reduce_mean(tf.square(y_pred - y_true))

# 비용을 최소화할 optimizer를 정의함
optimizer = tf.train.AdamOptimizer(learning_rate).minimize(cost)
🟣 학습 시작하기
# 세션을 실행하고 변수를 초기화함
# 텐서플로는 세션 실행 시, 반드시 모두 전역 변수를 초기화해야 함
init = tf.global_variables_initializer()
sess = tf.Session()
sess.run(init)

for epoch in range(num_epochs):
    _, c = sess.run([optimizer,cost], feed_dict={x_true: x, y_true: y})
    if (epoch+1) % step_display == 0:
        print("Epoch: {0}, cost: {1}, weight: {2}, bias: {3}".format(
            epoch+1, c, sess.run(weight), sess.run(bias)))

print("최적화 작업을 완료했습니다.")- 1,000번 학습을 진행하며 optimizer와 cost를 실행하기 위해 x좌표와 y좌표를 피드함
- 그리고, 50번 학습하였을 때마다, epoch, cost, weight, bias의 중간 결과값을 출력함
# 최종 비용, 가중치, 편향을 구해 출력함
training_cost = sess.run(cost, feed_dict={x_true: x, y_true: y})
print("최종 cost: {}".format(c))
print("최종 weight: {}".format(sess.run(weight)))
print("최종 bias: {}".format(sess.run(bias)))

# 실행 결과
# 최종 cost: 619.3222045898438
# 최종 weight: [3.067179]
# 최종 bias: [1.819138]
🟣 그래프로 직선 비교하기
- ro에서 r은 빨간색을, o는 동그라미를 의미함
- 학습의 결과로 얻은 최적화된 선을 그림
- 범례(legend())를 보여줌
- 시각화한 그래프 출력함
# 시각화하기
plt.plot(x, y, 'ro', label='Original data')
plt.plot(x, sess.run(weight) * x + sess.run(bias), label='Original line')
plt.legend()
plt.show()
.gif)
