안드로이드 파이 차트 만들기!!
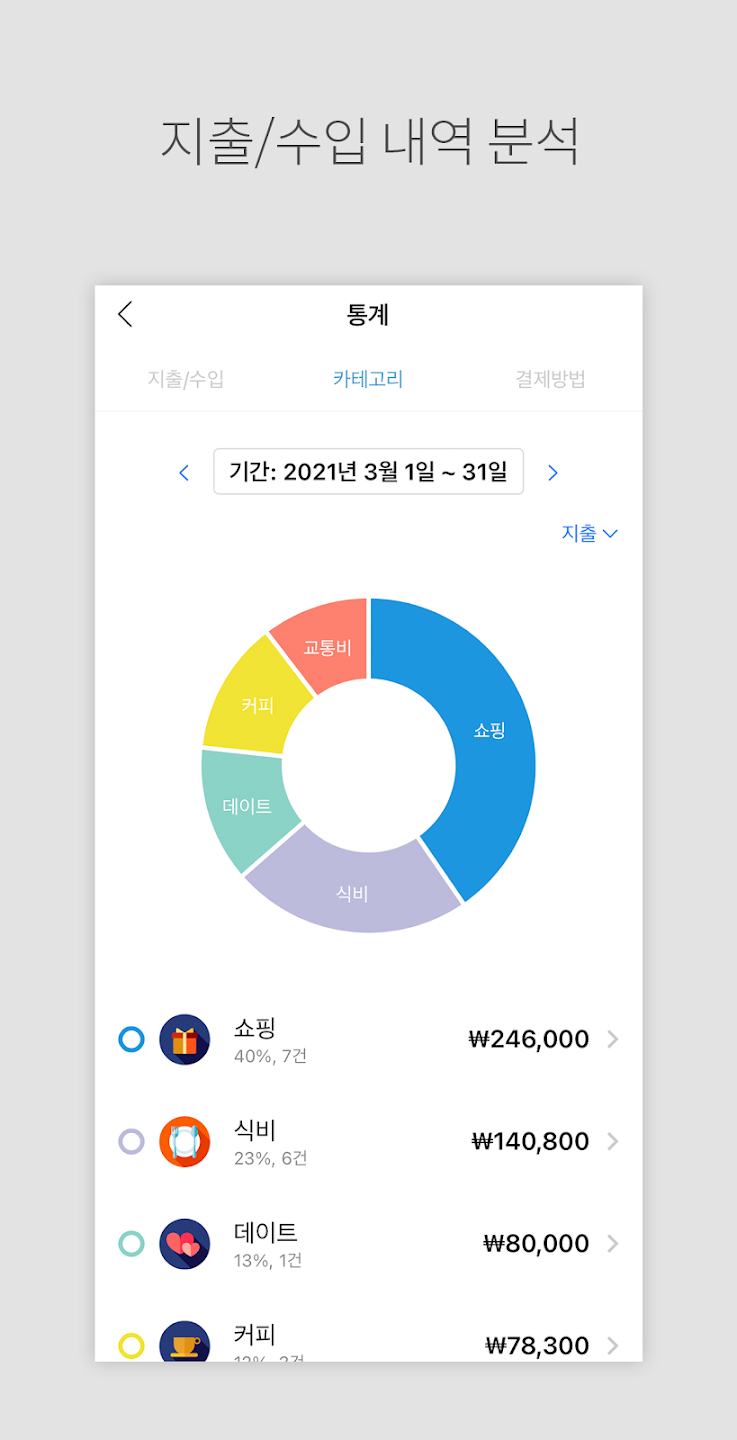
위의 이미지는 DaliyPay어플이다. 이것처럼 분석차트를 만들어보려고 한다.
build.gradle
dependencies {
    implementation 'com.github.PhilJay:MPAndroidChart:v3.1.0'
}
를 추가하고
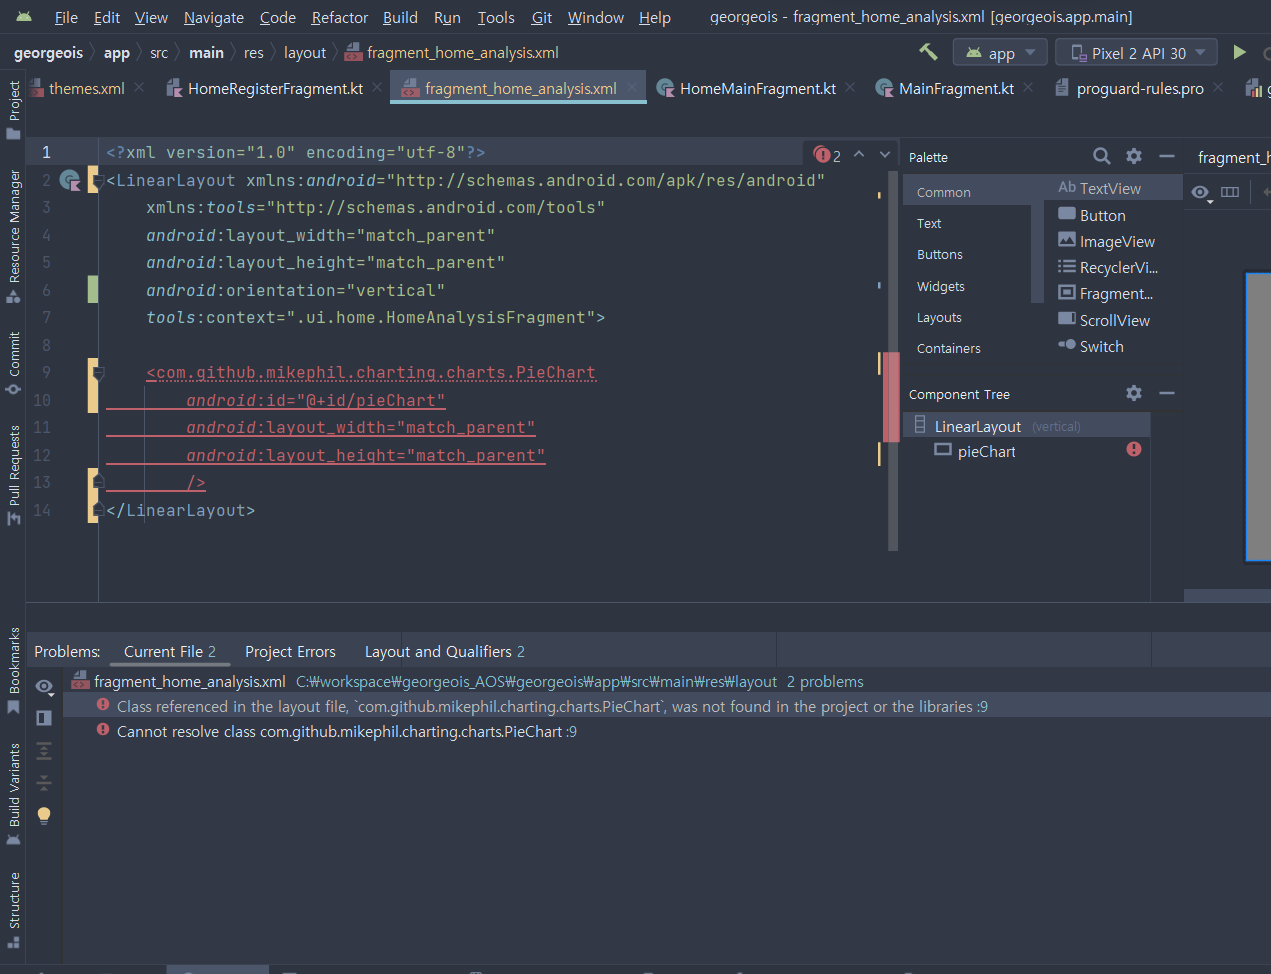
xml 파일에 넣었더니 안나오길래 찾아보니
Setting.gradle
dependencyResolutionManagement {
    repositoriesMode.set(RepositoriesMode.FAIL_ON_PROJECT_REPOS)
    repositories {
        google()
        mavenCentral()
        maven { url "https://jitpack.io" }
    }
}
를 안넣어서 일어난 현상이다.! 까먹지말고 넣자
fragment_home_analysis.xml
<?xml version="1.0" encoding="utf-8"?>
<LinearLayout xmlns:android="http://schemas.android.com/apk/res/android"
    xmlns:tools="http://schemas.android.com/tools"
    android:layout_width="match_parent"
    android:layout_height="match_parent"
    xmlns:app="http://schemas.android.com/apk/res-auto"
    android:orientation="vertical"
    tools:context=".ui.home.HomeAnalysisFragment">

    <com.google.android.material.appbar.MaterialToolbar
        android:id="@+id/materialToolbar_homeAnalysis"
        android:layout_width="match_parent"
        android:layout_height="wrap_content"
        android:background="?attr/colorPrimary"
        android:minHeight="?attr/actionBarSize"
        android:theme="@style/Theme.Georgeois.Toolbar" />

    <ScrollView
        android:layout_width="match_parent"
        android:layout_height="match_parent">

        <LinearLayout
            android:layout_width="match_parent"
            android:layout_height="match_parent"
            android:orientation="vertical"
            android:padding="@dimen/padding_size_15dp">

            <LinearLayout
                android:layout_width="match_parent"
                android:layout_height="wrap_content"
                android:orientation="horizontal">


                <ImageButton
                    android:id="@+id/imageButton_homeAnalysis_left"
                    android:layout_width="wrap_content"
                    android:layout_height="wrap_content"
                    android:layout_weight="1"
                    android:src="@drawable/ic_chevron_left_24px"
                    android:backgroundTint="#00FFFFFF" />

                <TextView
                    android:id="@+id/textView_homeAnalysis_"
                    android:layout_width="wrap_content"
                    android:layout_height="wrap_content"
                    android:layout_weight="1"
                    style="@style/Theme.Georgeois.Text"
                    android:gravity="center"
                    android:layout_gravity="center"
                    android:textSize="@dimen/font_size_20sp"
                    android:text="날짜" />

                <ImageButton
                    android:id="@+id/imageButton_homeAnalysis_right"
                    android:layout_width="wrap_content"
                    android:layout_height="wrap_content"
                    android:layout_weight="1"
                    android:src="@drawable/ic_chevron_right_24px"
                    android:backgroundTint="#00FFFFFF"/>
            </LinearLayout>

            <com.github.mikephil.charting.charts.PieChart
                android:id="@+id/pieChart_homeAnalysis"
                android:layout_width="match_parent"
                android:layout_height="400dp" />


        </LinearLayout>
    </ScrollView>

</LinearLayout>
그냥 넣고 싶은곳에 아래 xml을 넣으면 된다.
<com.github.mikephil.charting.charts.PieChart
android:id="@+id/pieChart_homeAnalysis"
android:layout_width="match_parent"
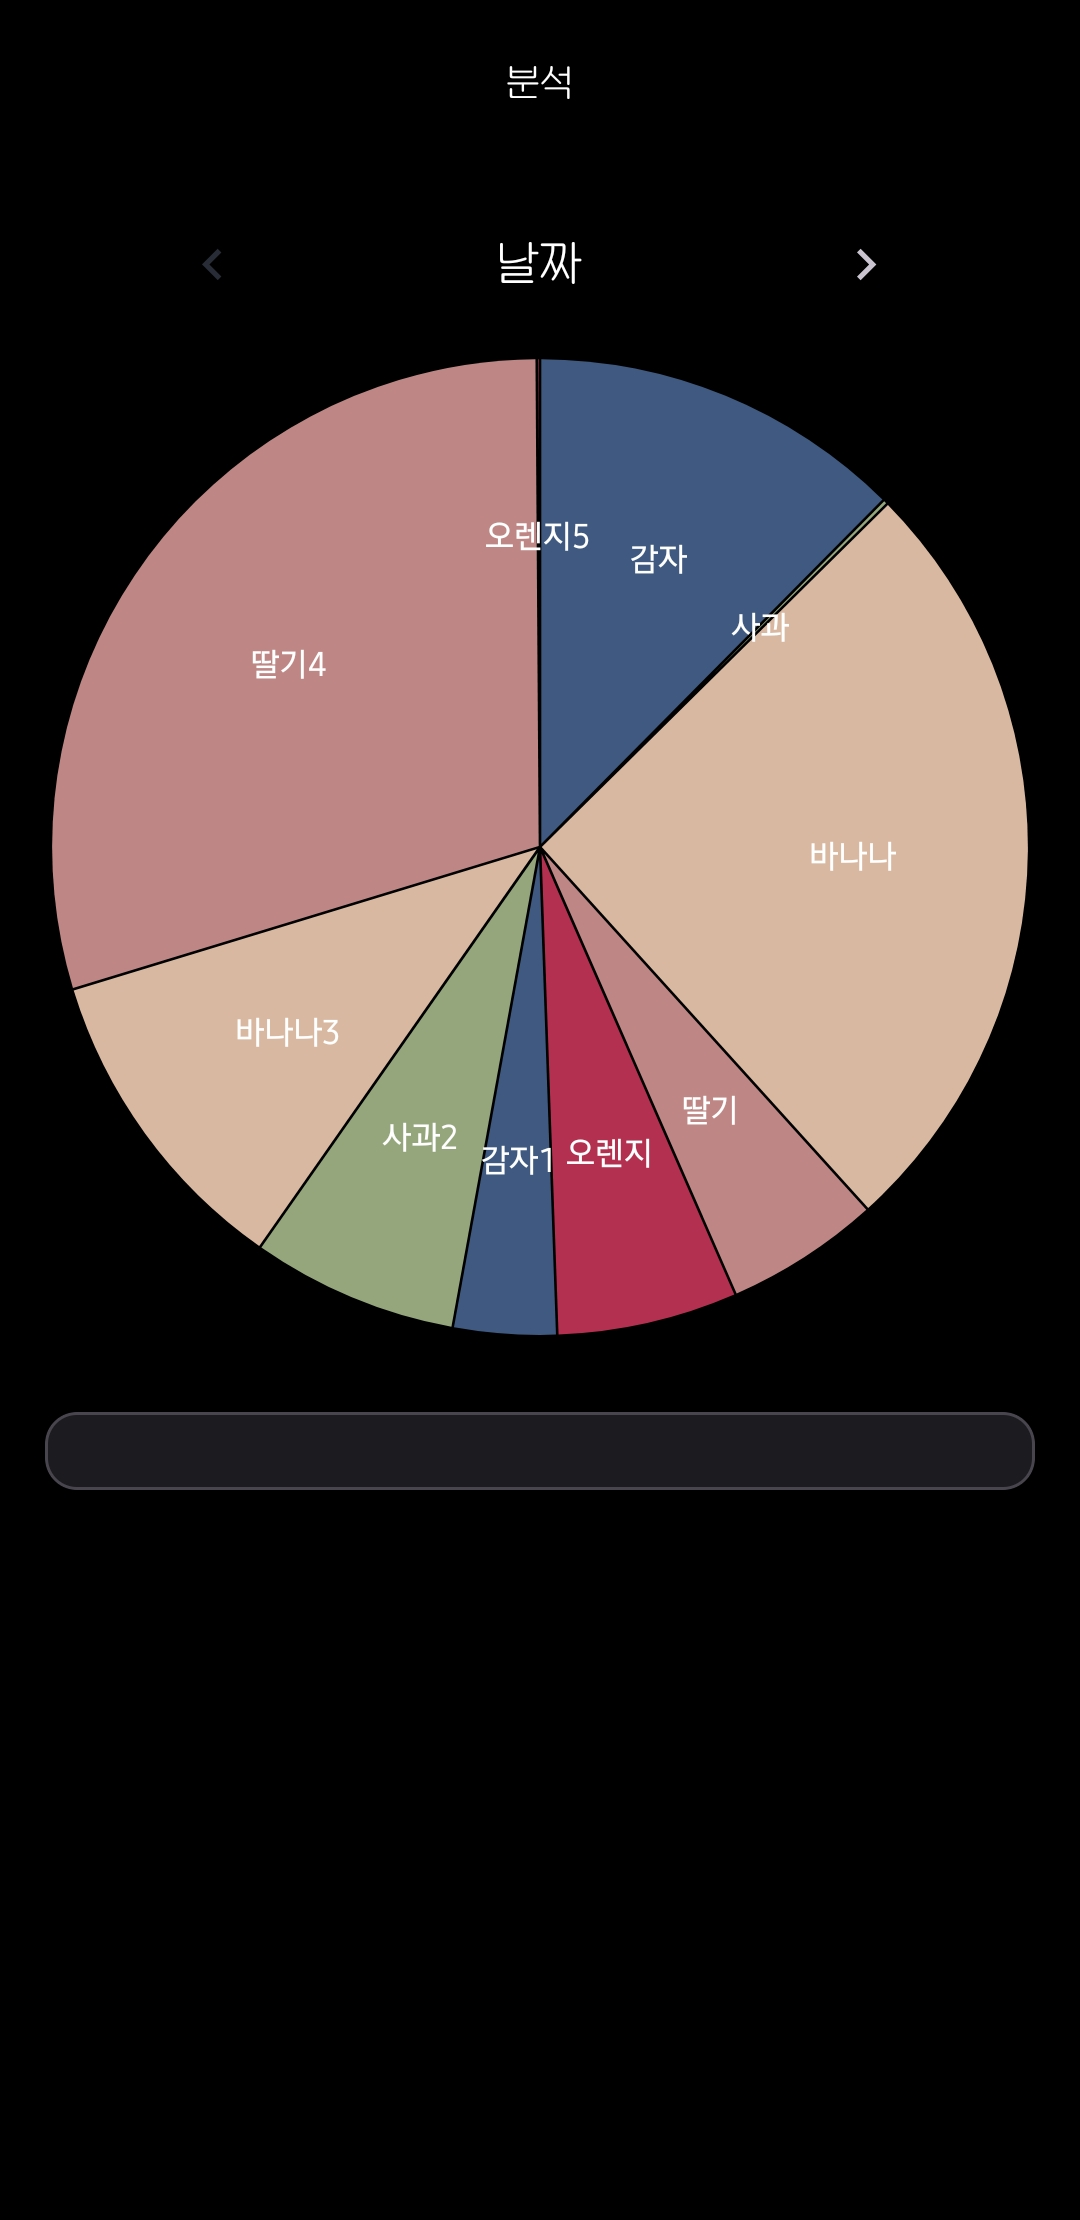
android:layout_height="400dp" />HomeAnalysisFragment.kt
class HomeAnalysisFragment : Fragment() {
    lateinit var fragmentHomeAnalysisBinding: FragmentHomeAnalysisBinding
    lateinit var mainActivity: MainActivity
    override fun onCreateView(
        inflater: LayoutInflater, container: ViewGroup?,
        savedInstanceState: Bundle?
    ): View? {
        fragmentHomeAnalysisBinding = FragmentHomeAnalysisBinding.inflate(inflater)
        mainActivity = activity as MainActivity
        fragmentHomeAnalysisBinding.pieChartHomeAnalysis.setUsePercentValues(true)

        // 넣을 데이터 설정
        val dataList = ArrayList<PieEntry>()
        var tempTotalCategory1 = 145000f
        var tempTotalCategory2 = 2000f
        var tempTotalCategory3 = 300000f
        var tempTotalCategory4 = 60000f
        var tempTotalCategory5 = 70000f

        dataList.add(PieEntry(tempTotalCategory1, "감자"))
        dataList.add(PieEntry(tempTotalCategory2, "사과"))
        dataList.add(PieEntry(tempTotalCategory3, "바나나"))
        dataList.add(PieEntry(tempTotalCategory4, "딸기"))
        dataList.add(PieEntry(tempTotalCategory5, "오렌지"))
        dataList.add(PieEntry(40000f, "감자1"))
        dataList.add(PieEntry(80000f, "사과2"))
        dataList.add(PieEntry(123400f, "바나나3"))
        dataList.add(PieEntry(345523f, "딸기4"))
        dataList.add(PieEntry(1234f, "오렌지5"))


        val dataSet = PieDataSet(dataList,"")
        with(dataSet){
       		// 각 파이 사이의 공간
            sliceSpace = 3f
            // 파이 차트의 각 파이에 대한 색상을 설정
            // 여러개 지원하니 적용해보고 할 것을 추천
            setColors(*ColorTemplate.PASTEL_COLORS)
        }
        dataSet.setDrawValues(false)
        fragmentHomeAnalysisBinding.run {
            materialToolbarHomeAnalysis.run {
                title = "분석"
            }
            var data = PieData(dataSet)
            pieChartHomeAnalysis.data =data
            // 차트 설명
            pieChartHomeAnalysis.description.isEnabled = false
            // 차트 회전 비활성화
            pieChartHomeAnalysis.isRotationEnabled = false
            // 하단 설명 비활성화
            pieChartHomeAnalysis.legend.isEnabled = false
            // 구멍 막으려면 false
            pieChartHomeAnalysis.isDrawHoleEnabled = true
            // 터치 막기
            pieChartHomeAnalysis.setTouchEnabled(false)

            // 애니메이션 설정
            pieChartHomeAnalysis.animateY(1000) // 애니메이션 설정
            pieChartHomeAnalysis.invalidate() // 차트 갱신


        }
        return fragmentHomeAnalysisBinding.root
    }


}