본 게시물은 CloudNet@팀 Gasida(서종호) 님이 진행하시는
AWS EKS Workshop Study 내용을 기반으로 작성되었습니다.
Grafana
소개
- TSDB 데이터를 시각화, 다양한 데이터 형식 지원(메트릭, 로그, 트레이스 등) - 링크 9.5 Docs
- Grafana open source software enables you to query, visualize, alert on, and explore your metrics, logs, and traces wherever they are stored.
- Grafana OSS provides you with tools to turn your time-series database (TSDB) data into insightful graphs and visualizations.
- 그라파나는 시각화 솔루션으로 데이터 자체를 저장하지 않음 → 현재 실습 환경에서는 데이터 소스는 프로메테우스를 사용
- 접속 정보 확인 및 로그인 : 기본 계정 - admin / prom-operator
Grafana 접속
# 그라파나 버전 확인
kubectl exec -it -n monitoring statefulset/kube-prometheus-stack-grafana -- grafana-cli --version
grafana cli version 10.4.0

# ingress 확인
kubectl get ingress -n monitoring kube-prometheus-stack-grafana
kubectl describe ingress -n monitoring kube-prometheus-stack-grafana

# ingress 도메인으로 웹 접속 : 기본 계정 - admin / prom-operator
echo -e "Grafana Web URL = https://grafana.$MyDomain"
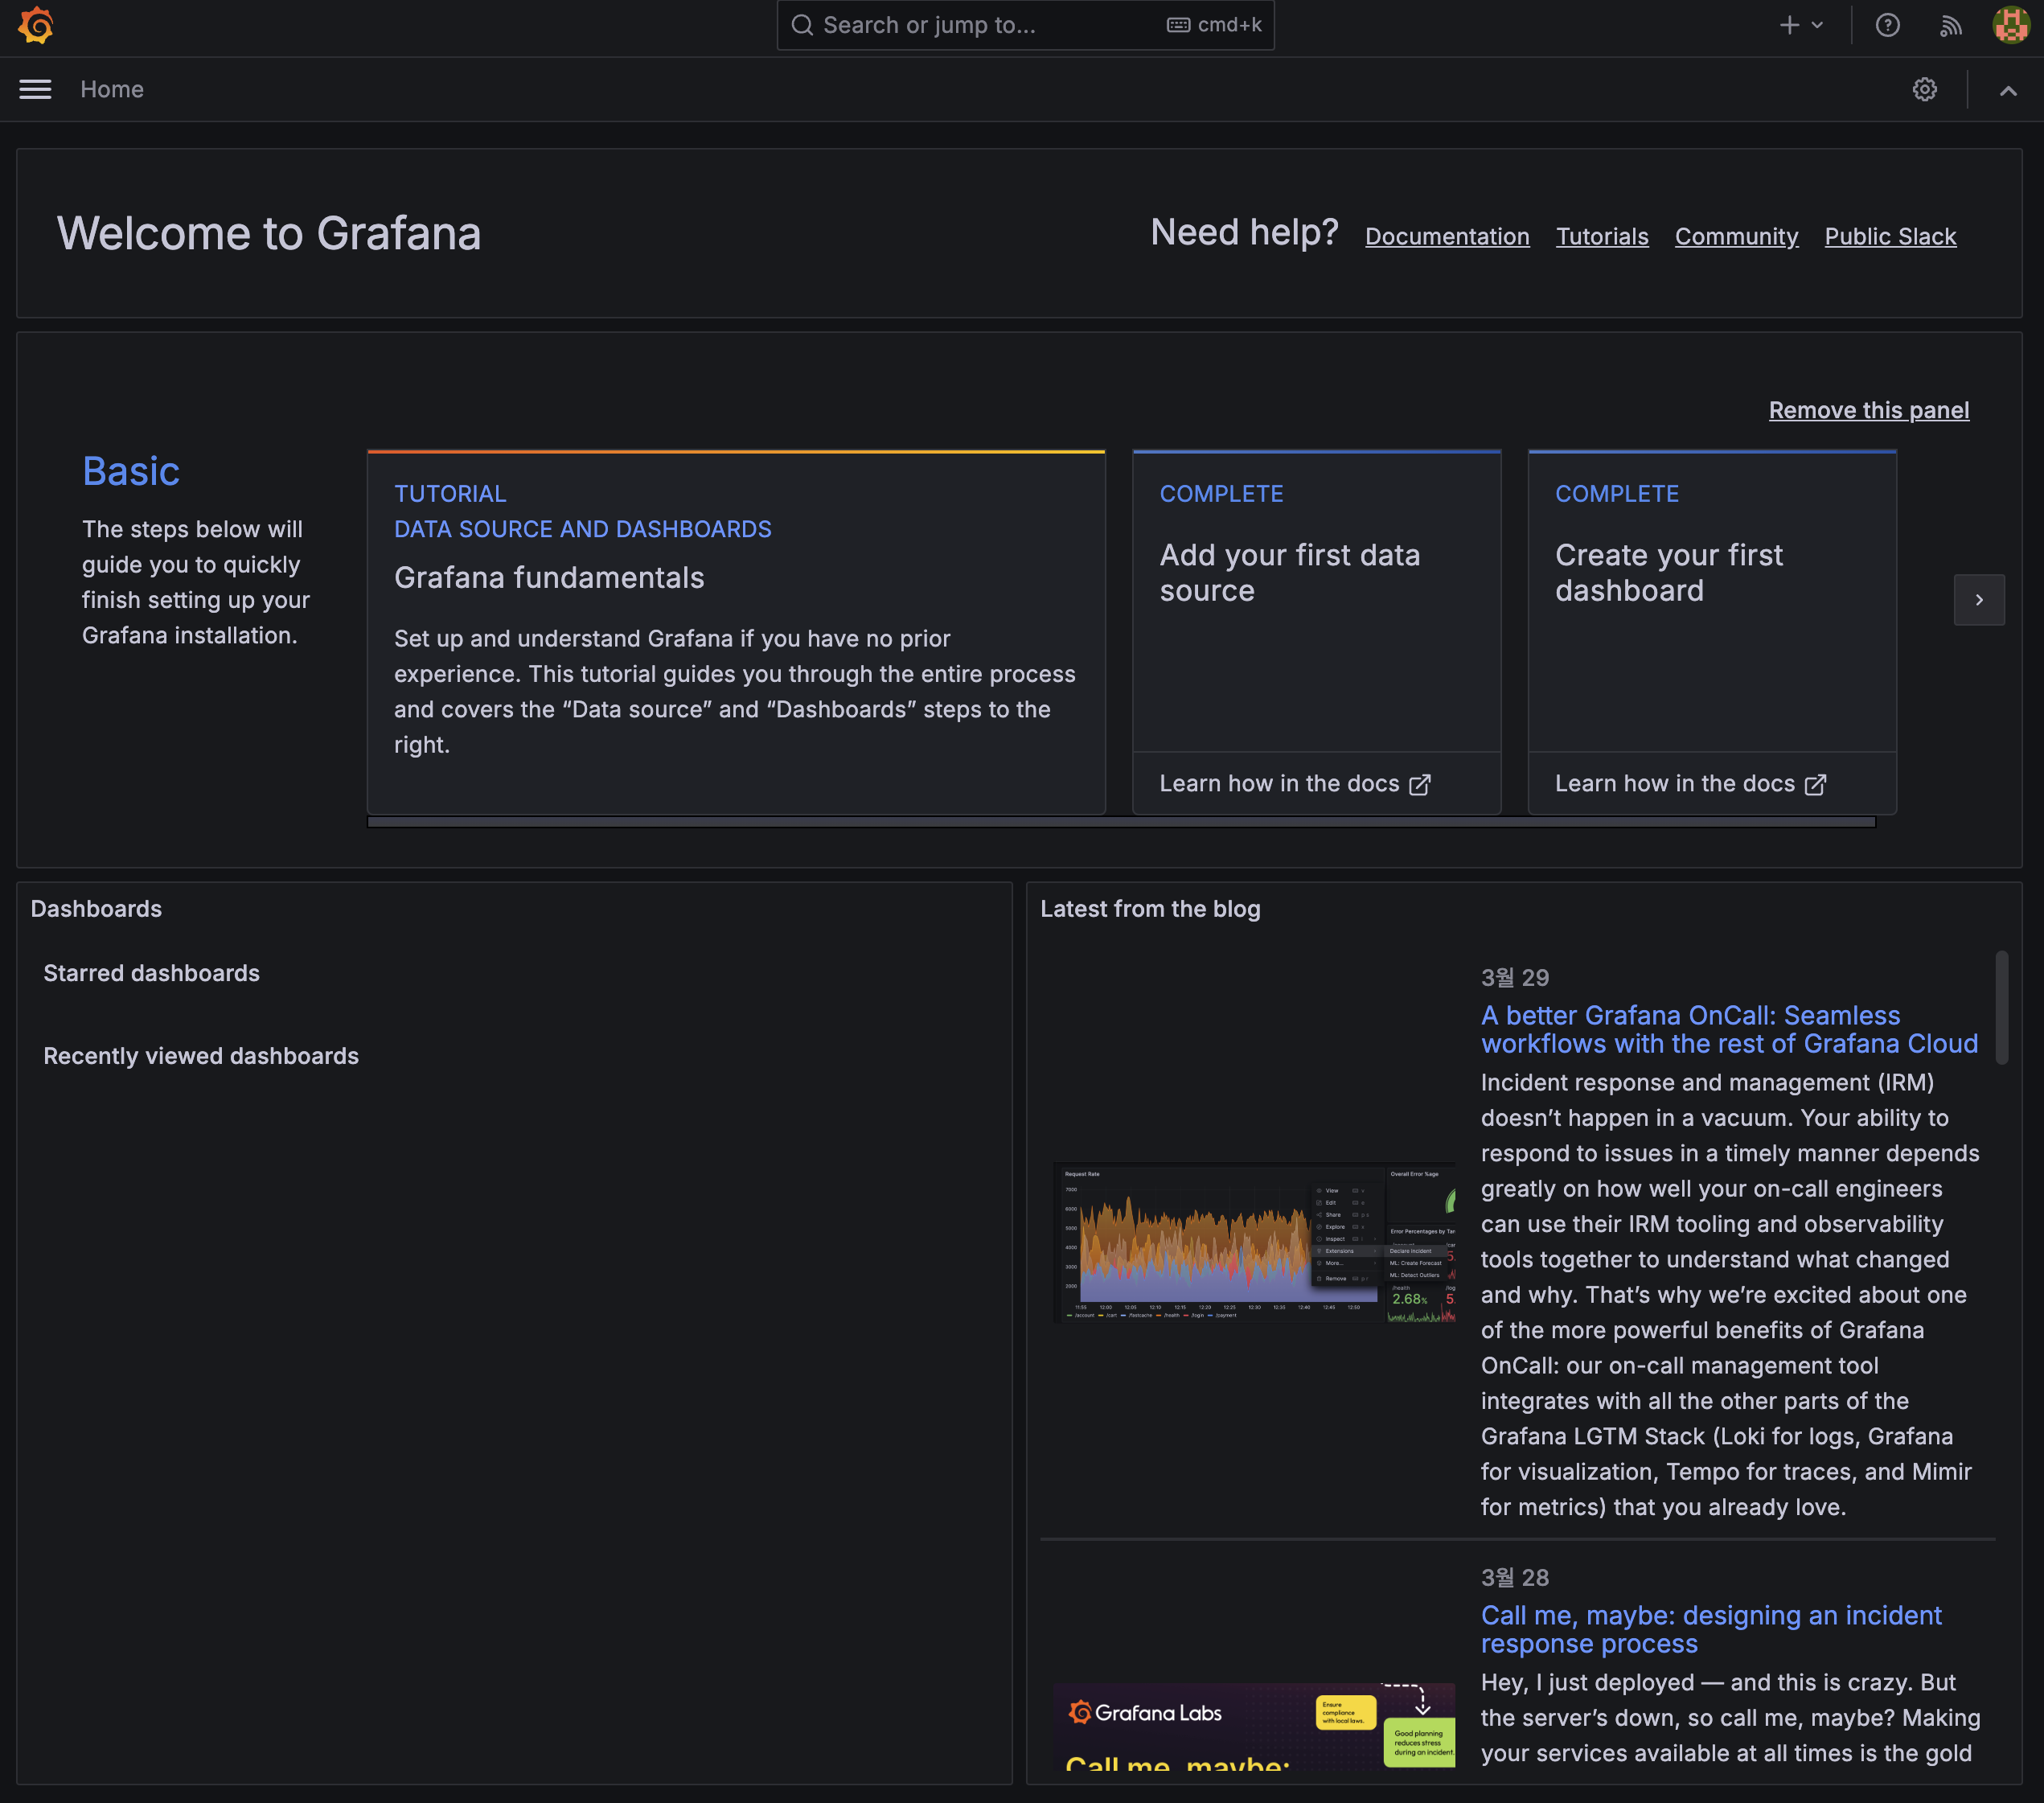
Grafana 사용
-
메뉴 구성
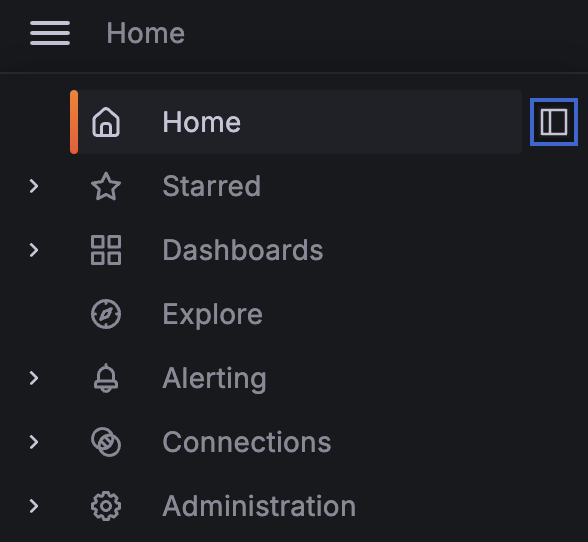
- Search dashboards : 대시보드 검색
- Starred : 즐겨찾기 대시보드
- Dashboards : 대시보드 전체 목록 확인
- Explore : 쿼리 언어 PromQL를 이용해 메트릭 정보를 그래프 형태로 탐색
- Alerting : 경고, 에러 발생 시 사용자에게 경고를 전달
- Connections : 설정, 예) 데이터 소스 설정 등
- Administartor : 사용자, 조직, 플러그인 등 설정
-
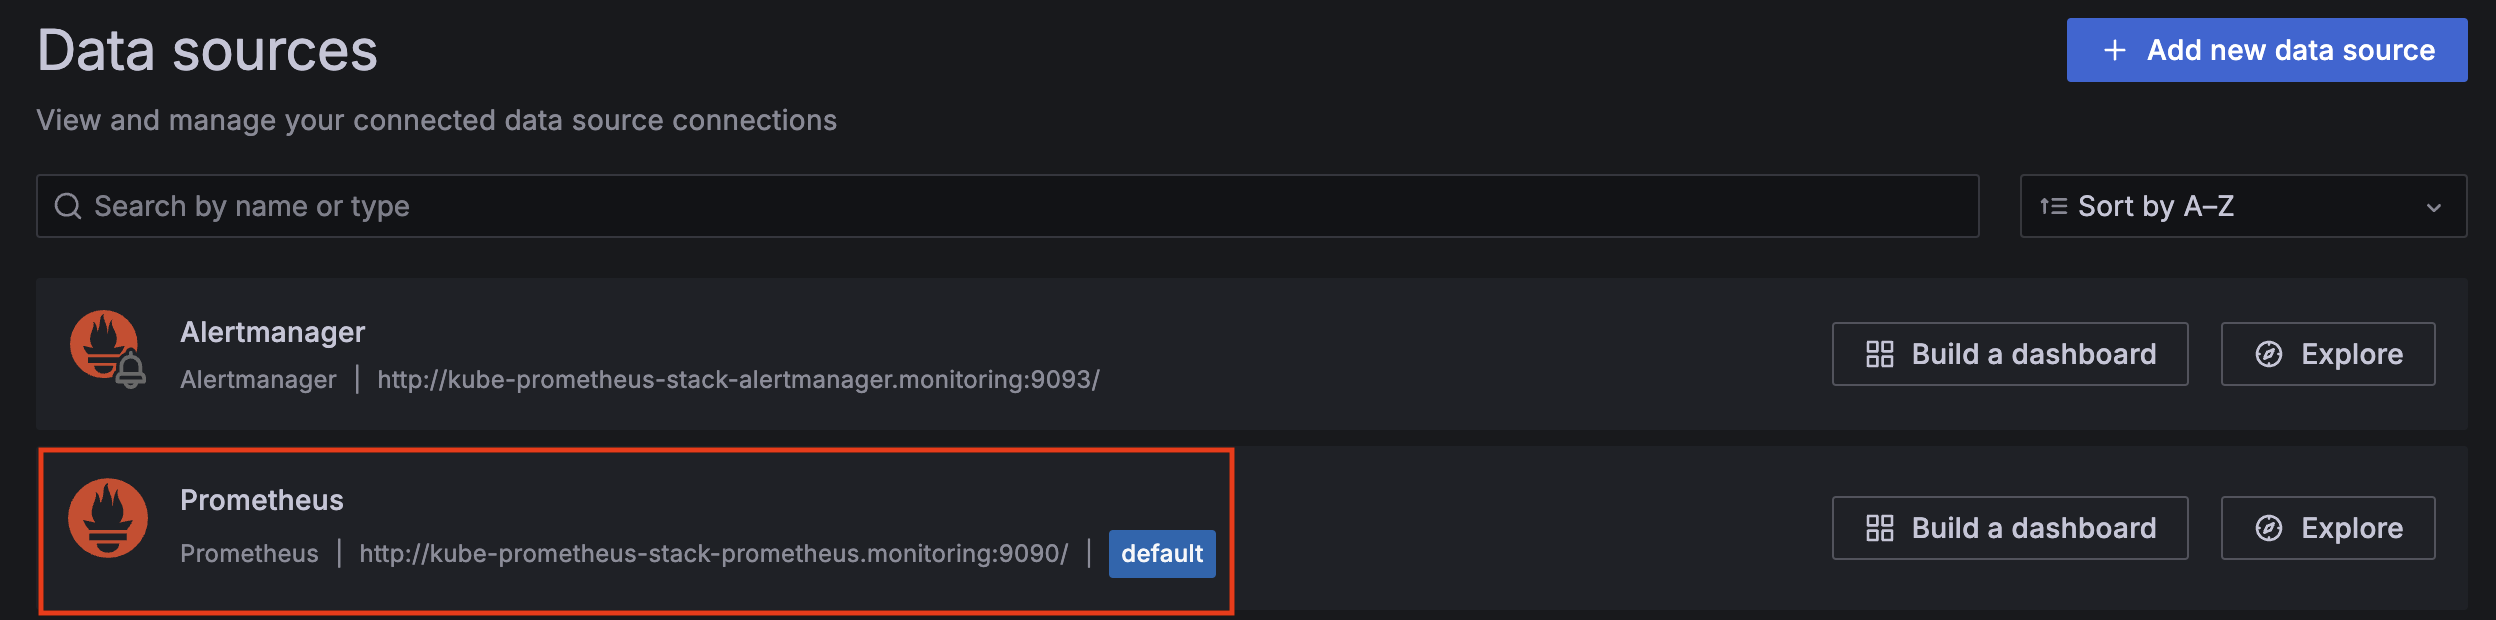
Data sources
- Home -> Connections -> Data sources
- kube-prometheus 스택은 자동으로 prometheus를 데이터 소스로 추가함
-
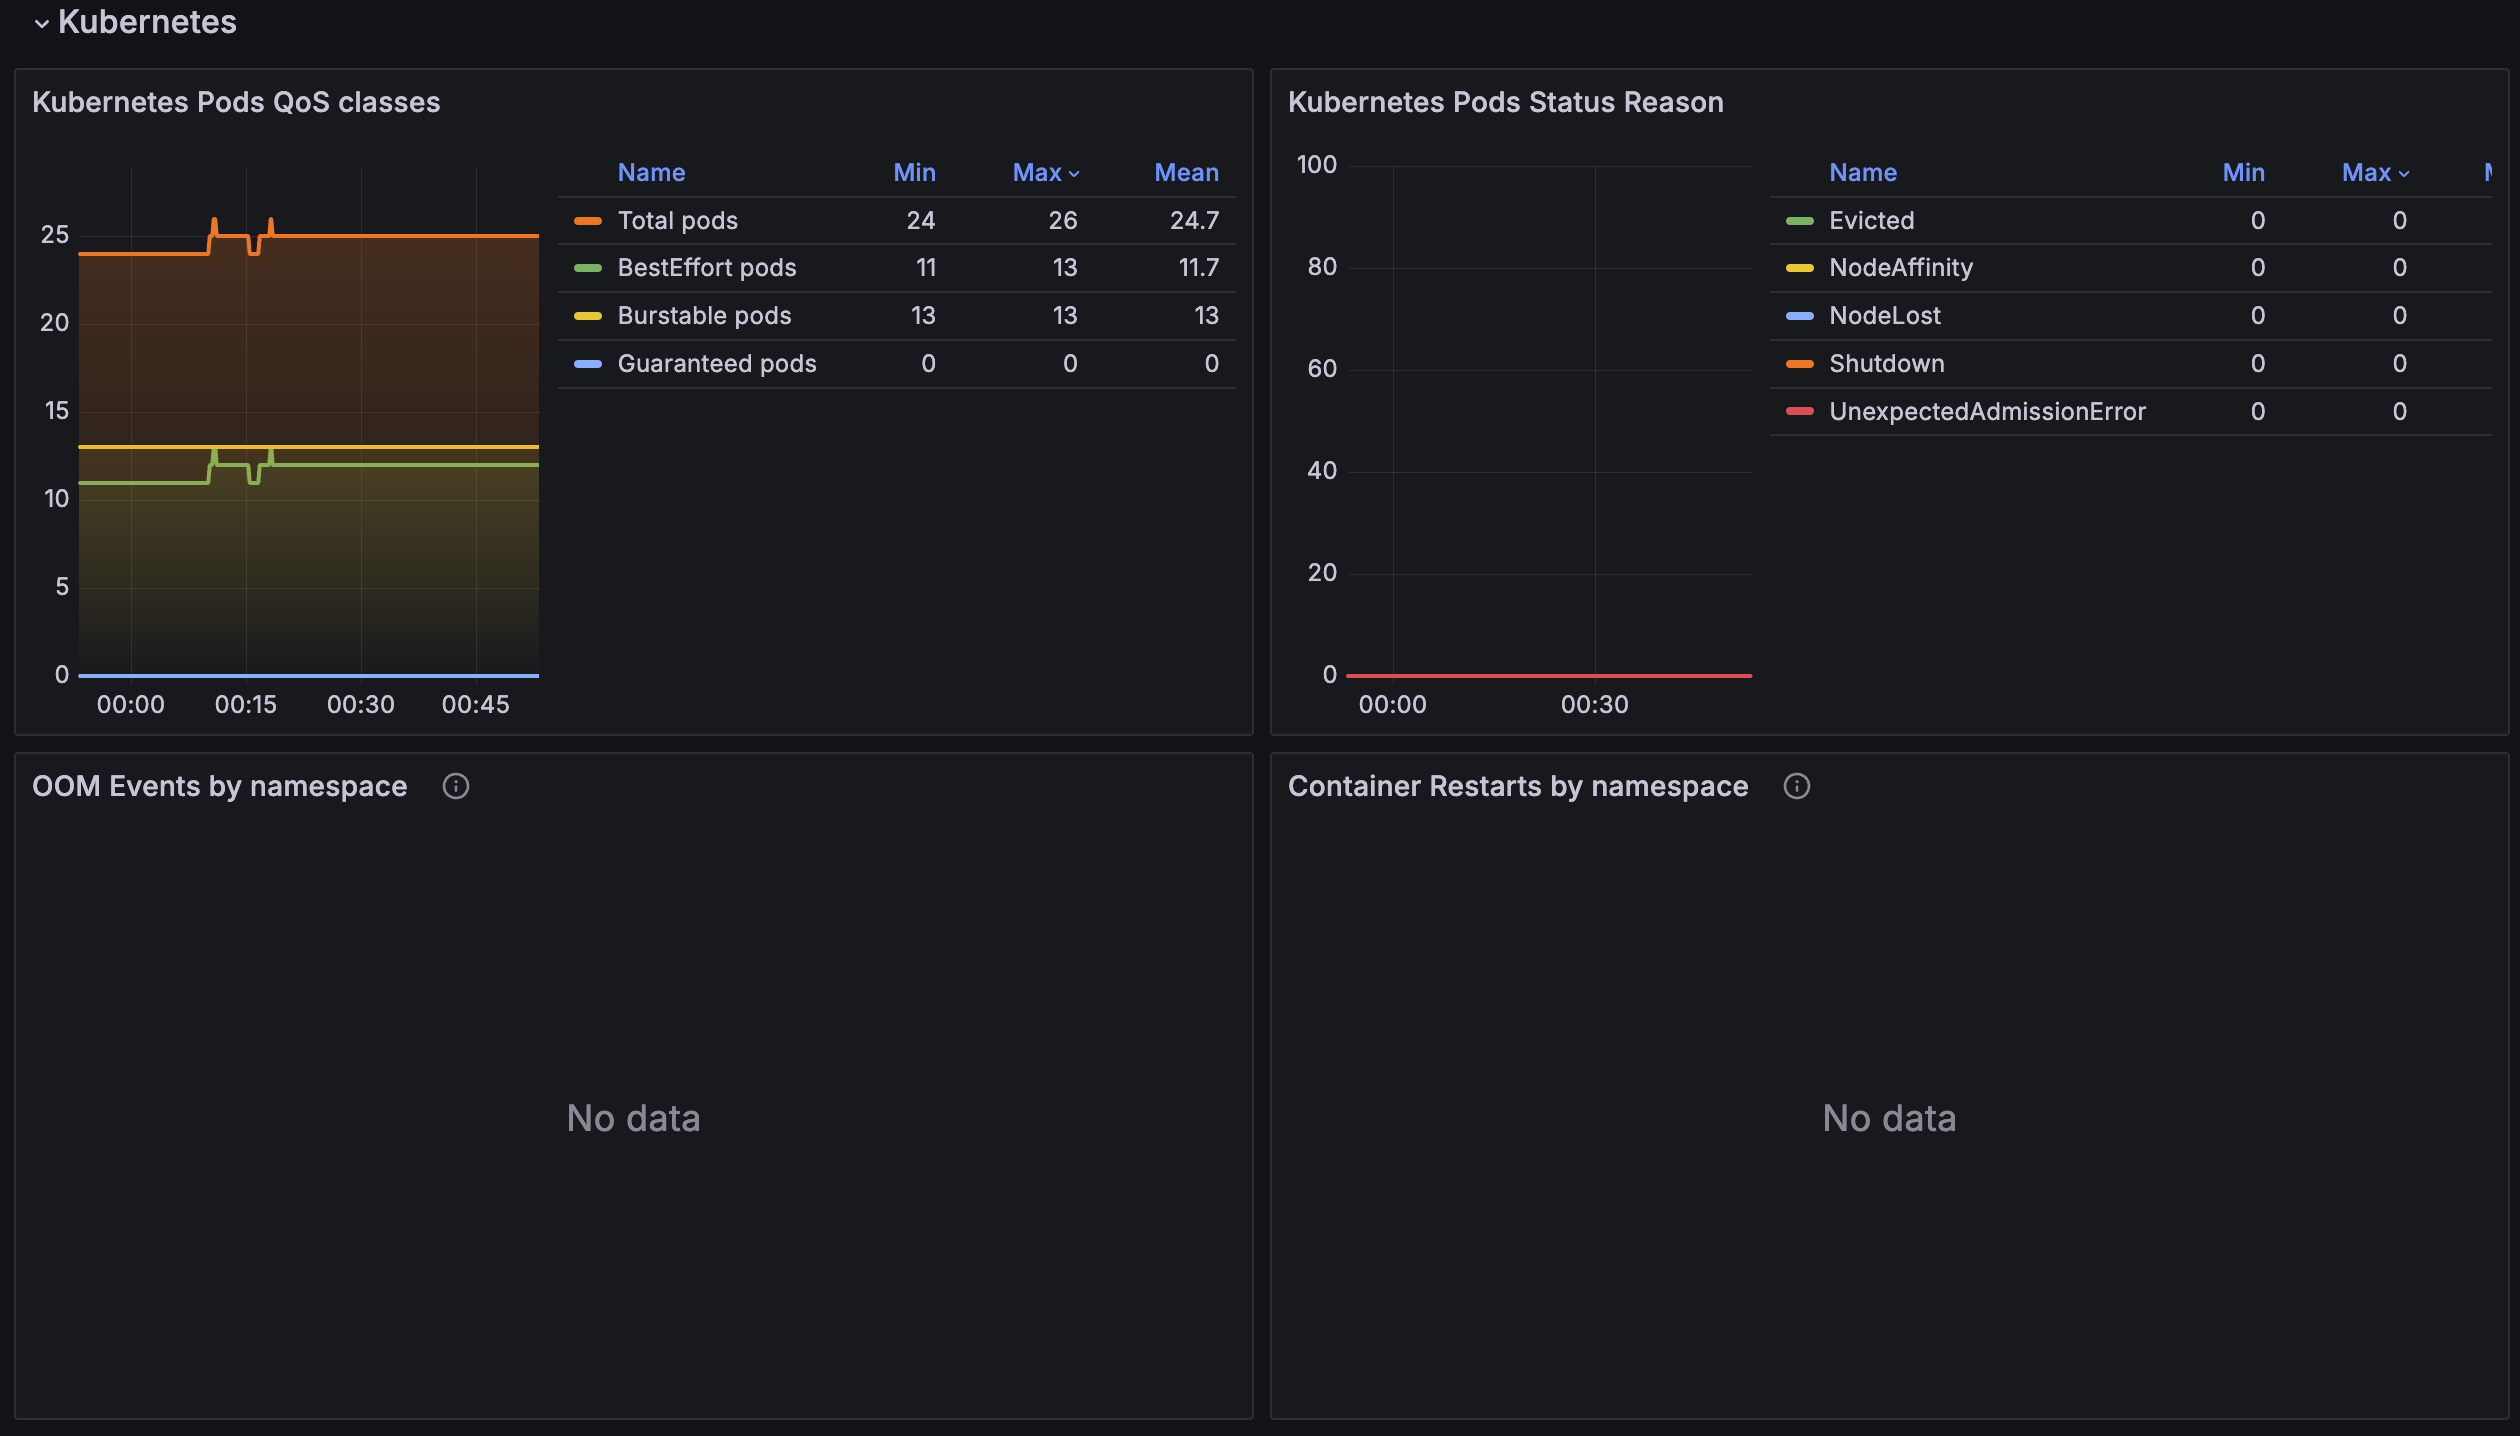
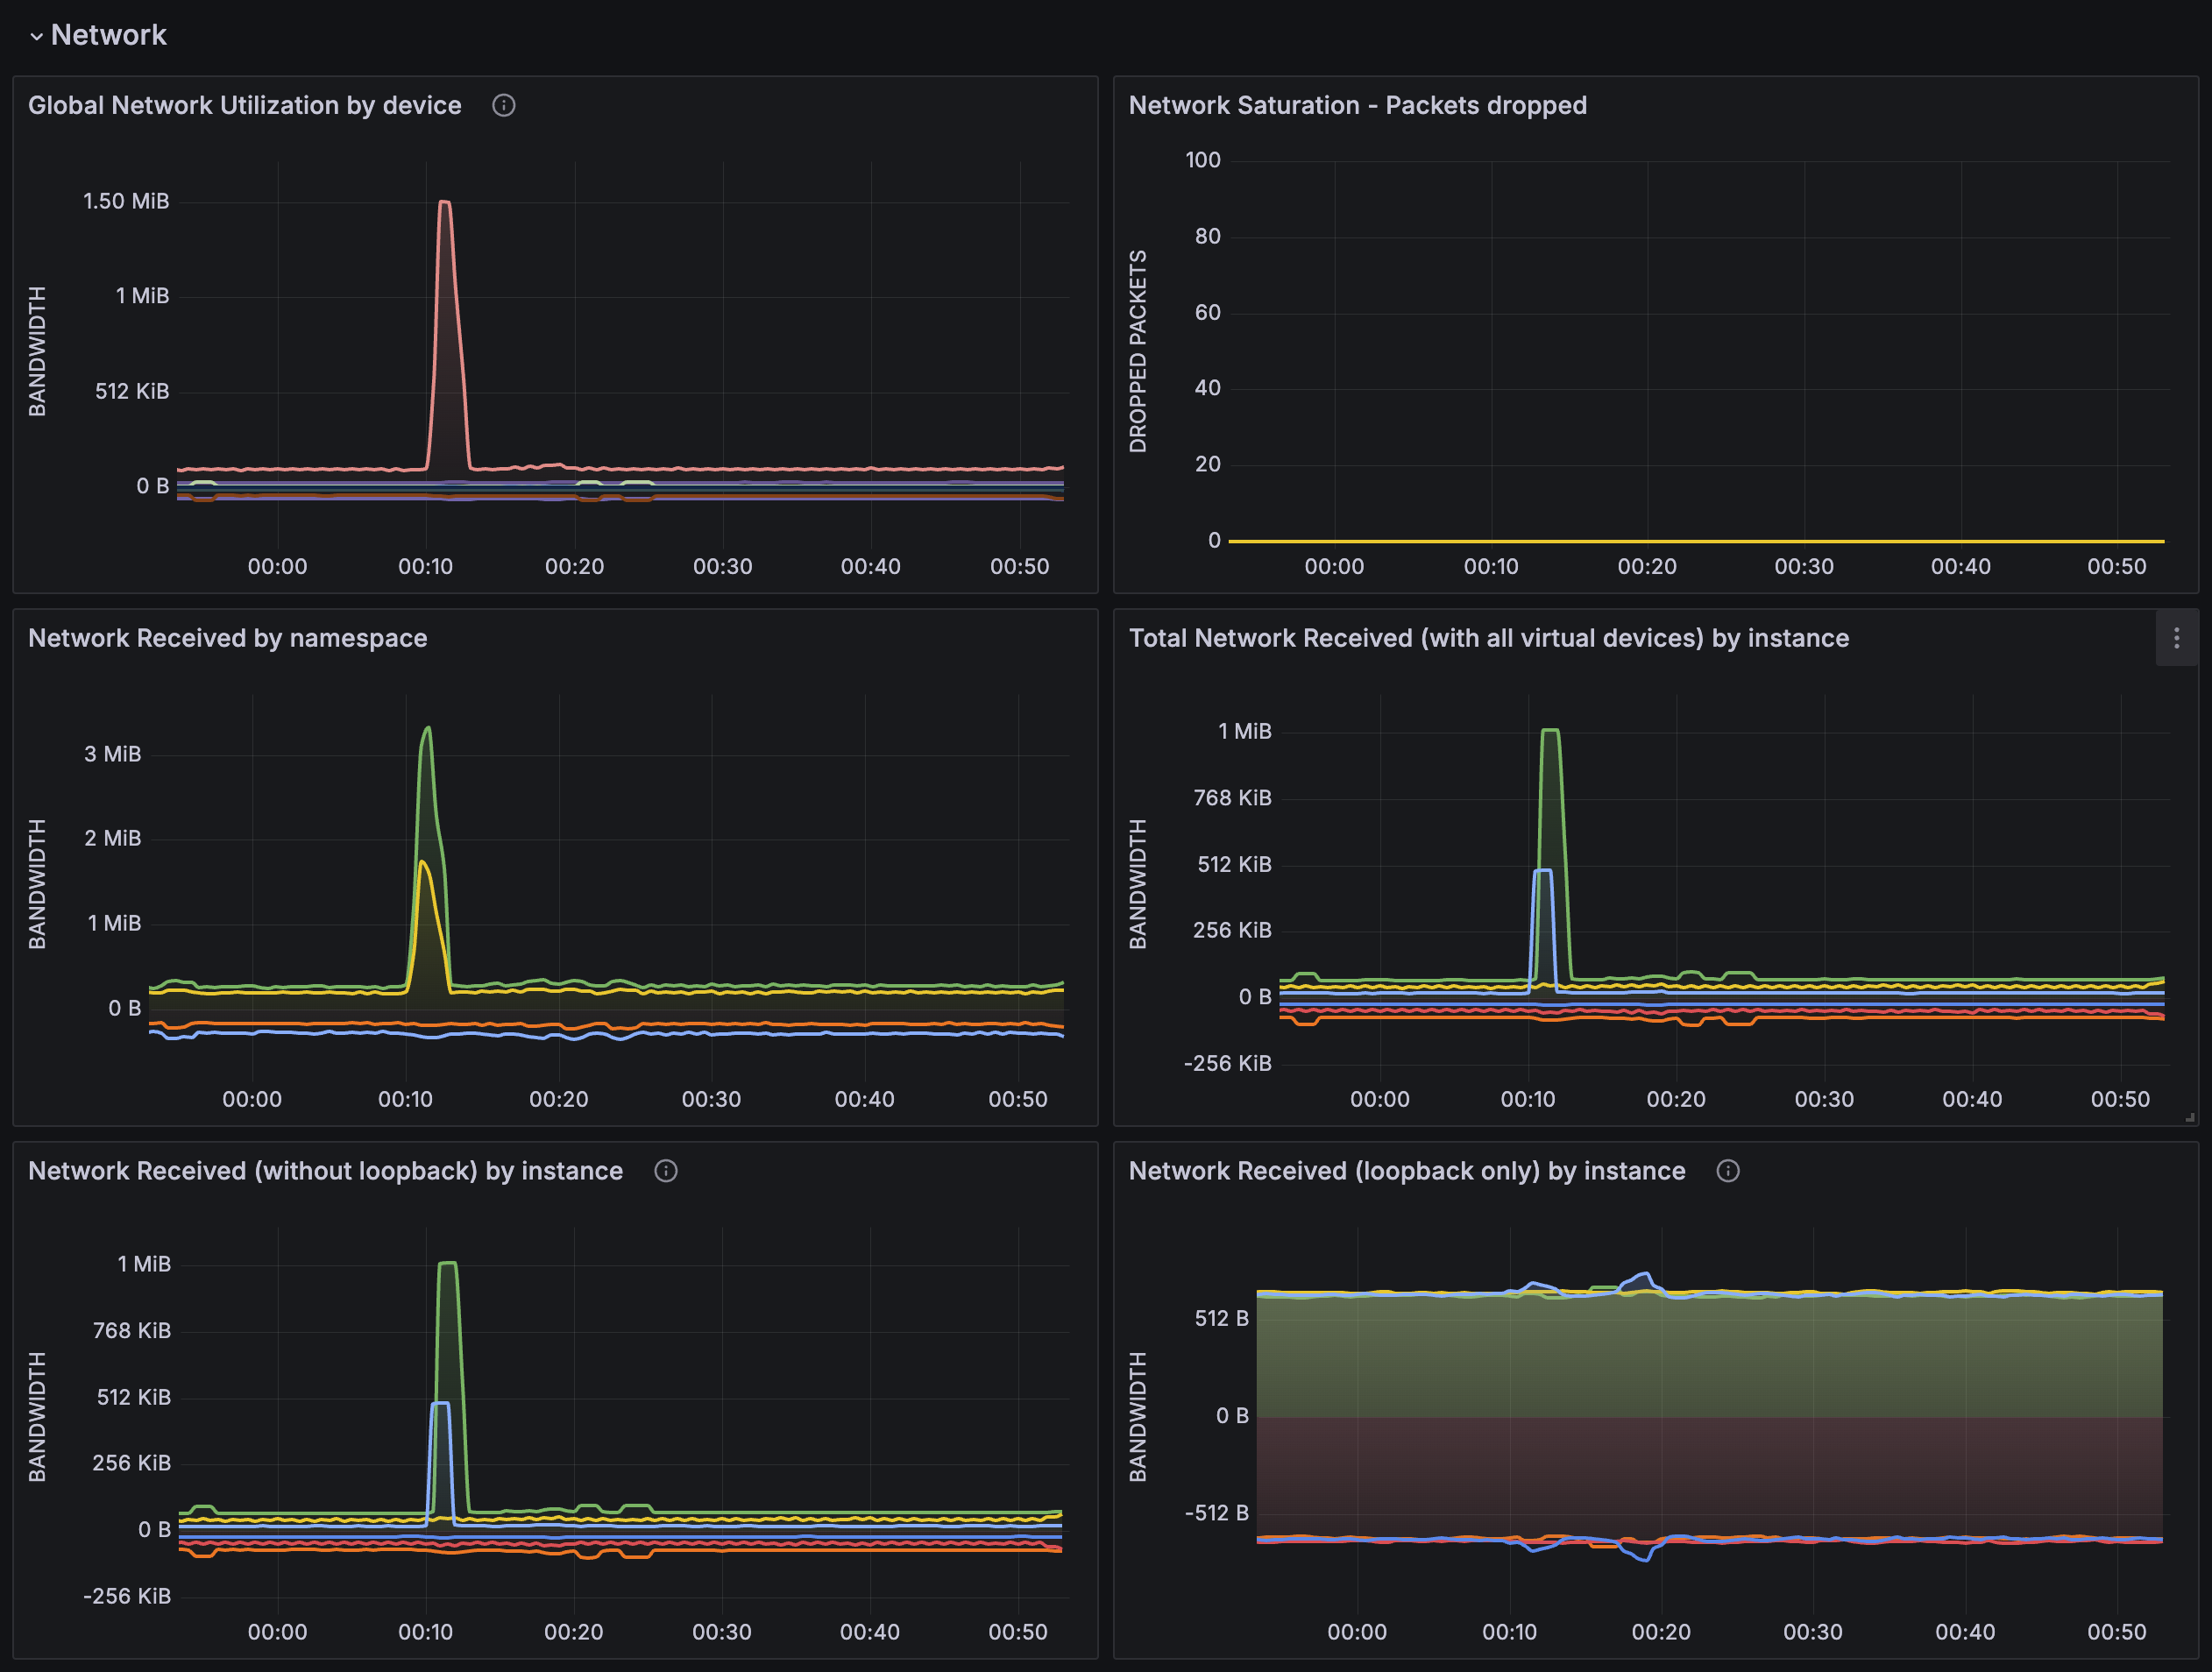
Dashboard
-
오픈소스 Dashboard ID를 Import하여 사용할 수 있음
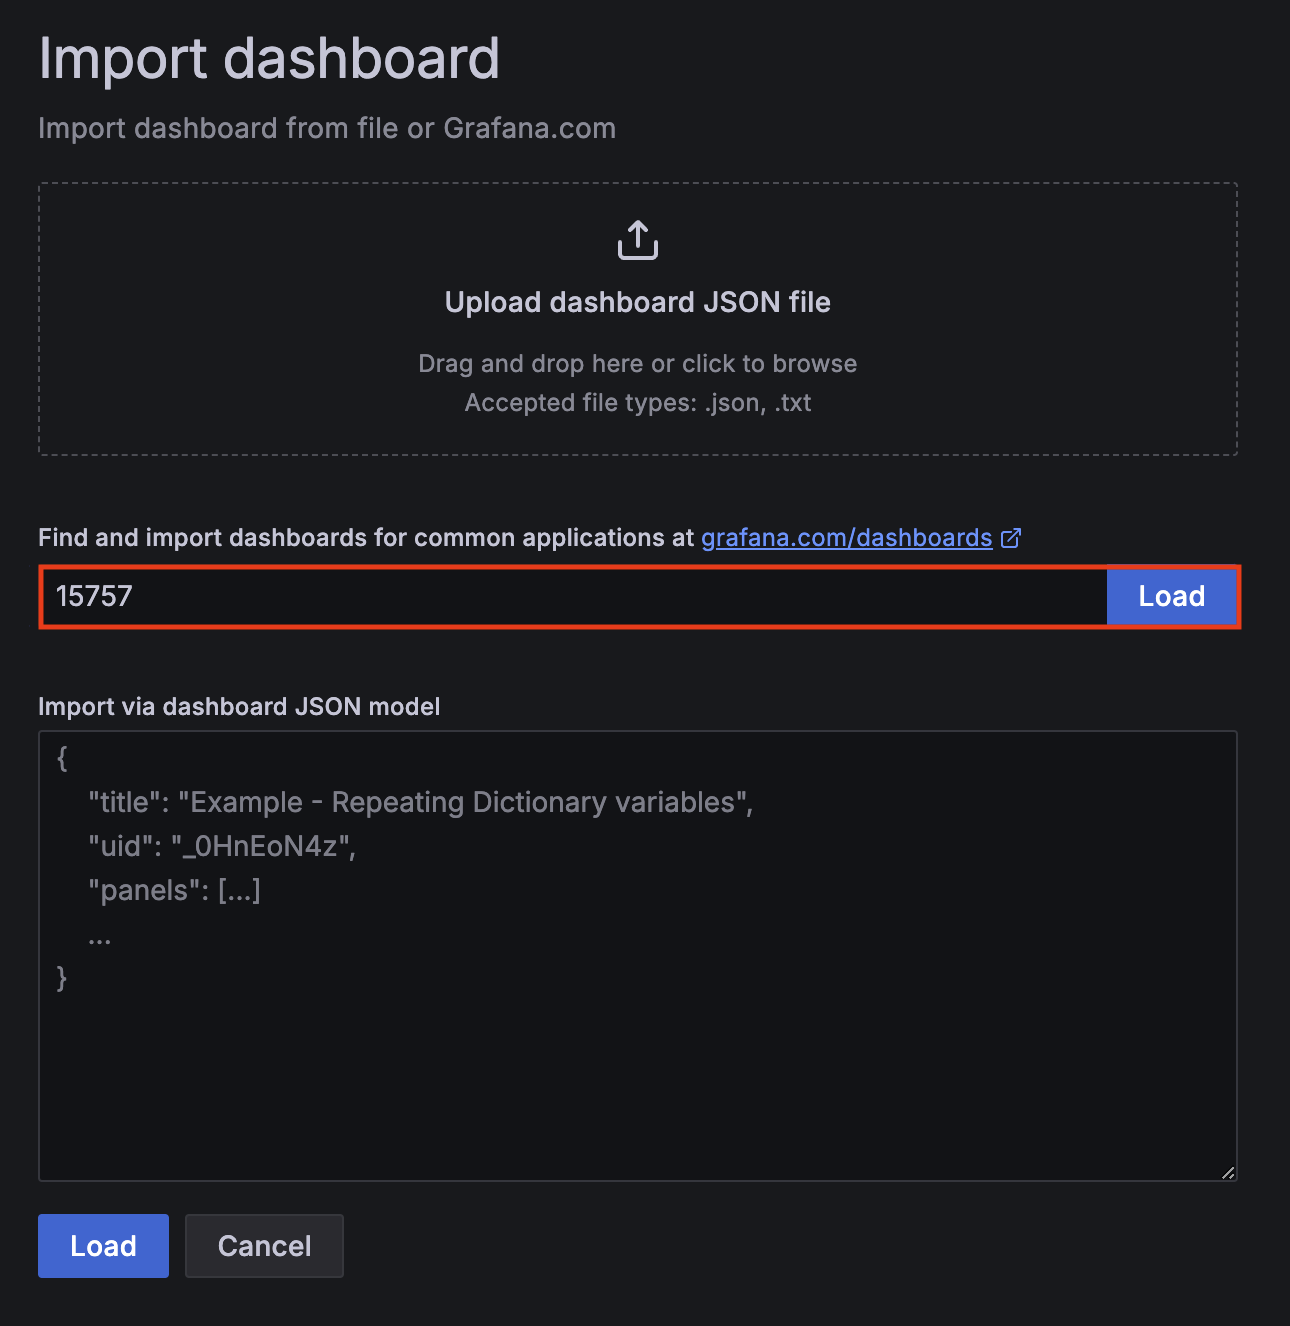
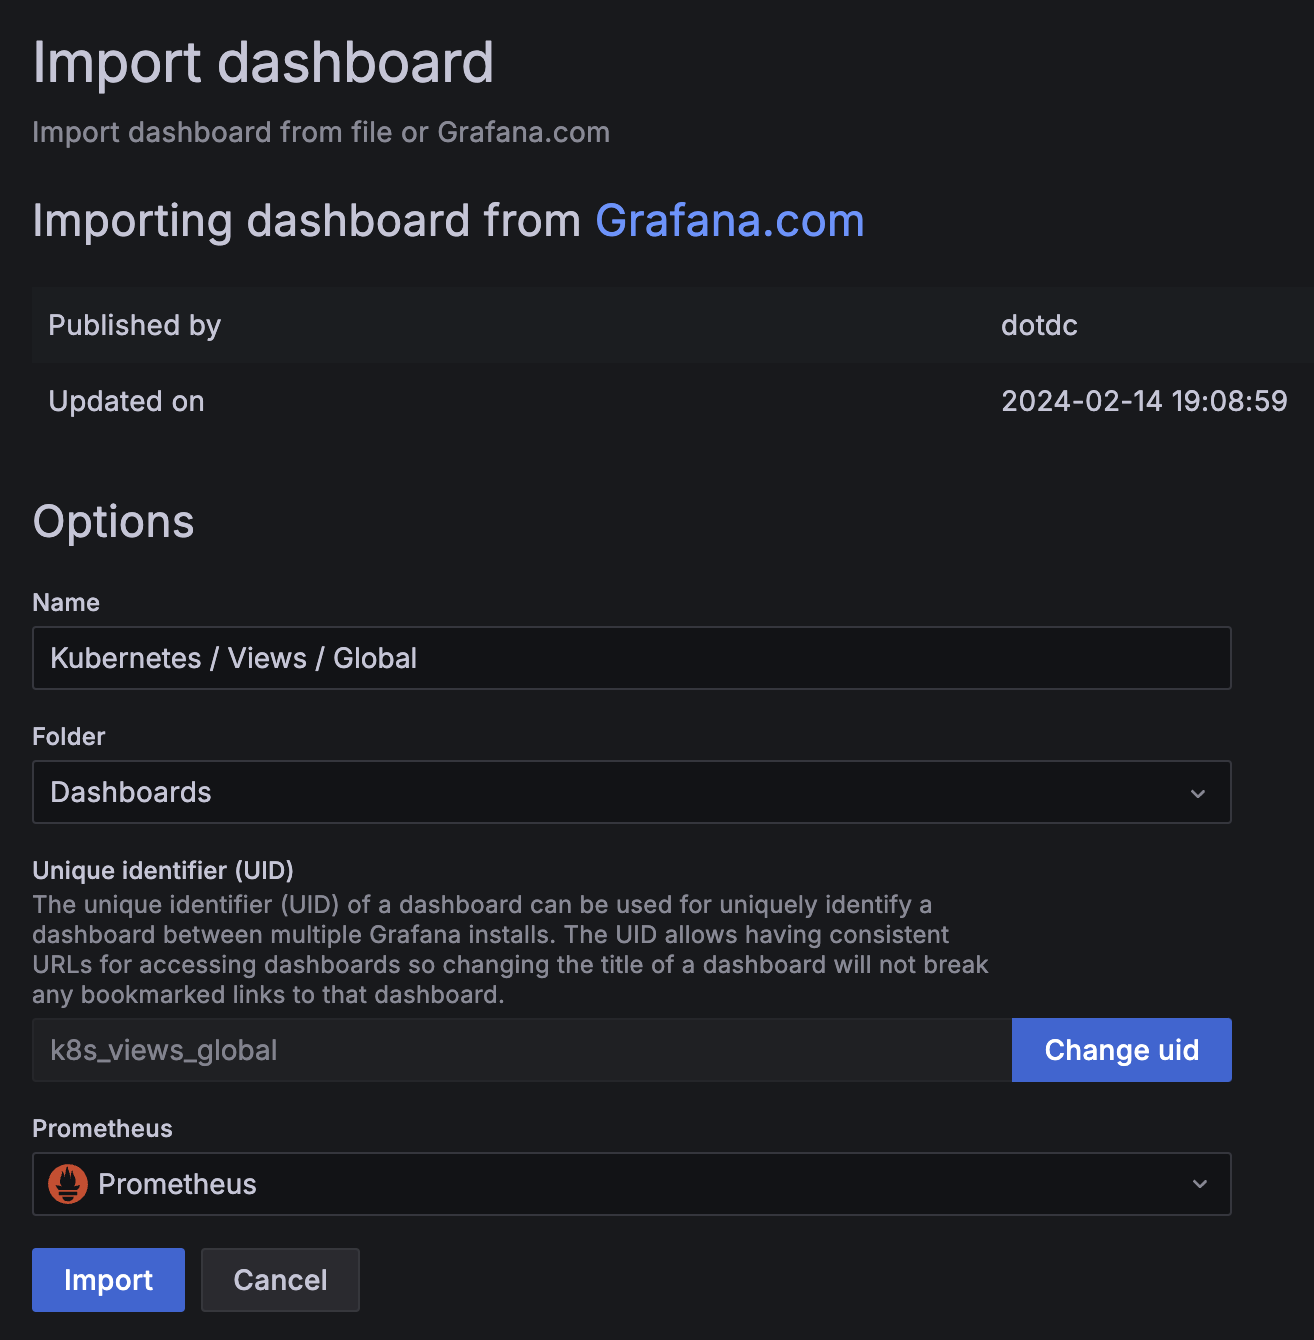
-
Dashboard 생성 확인
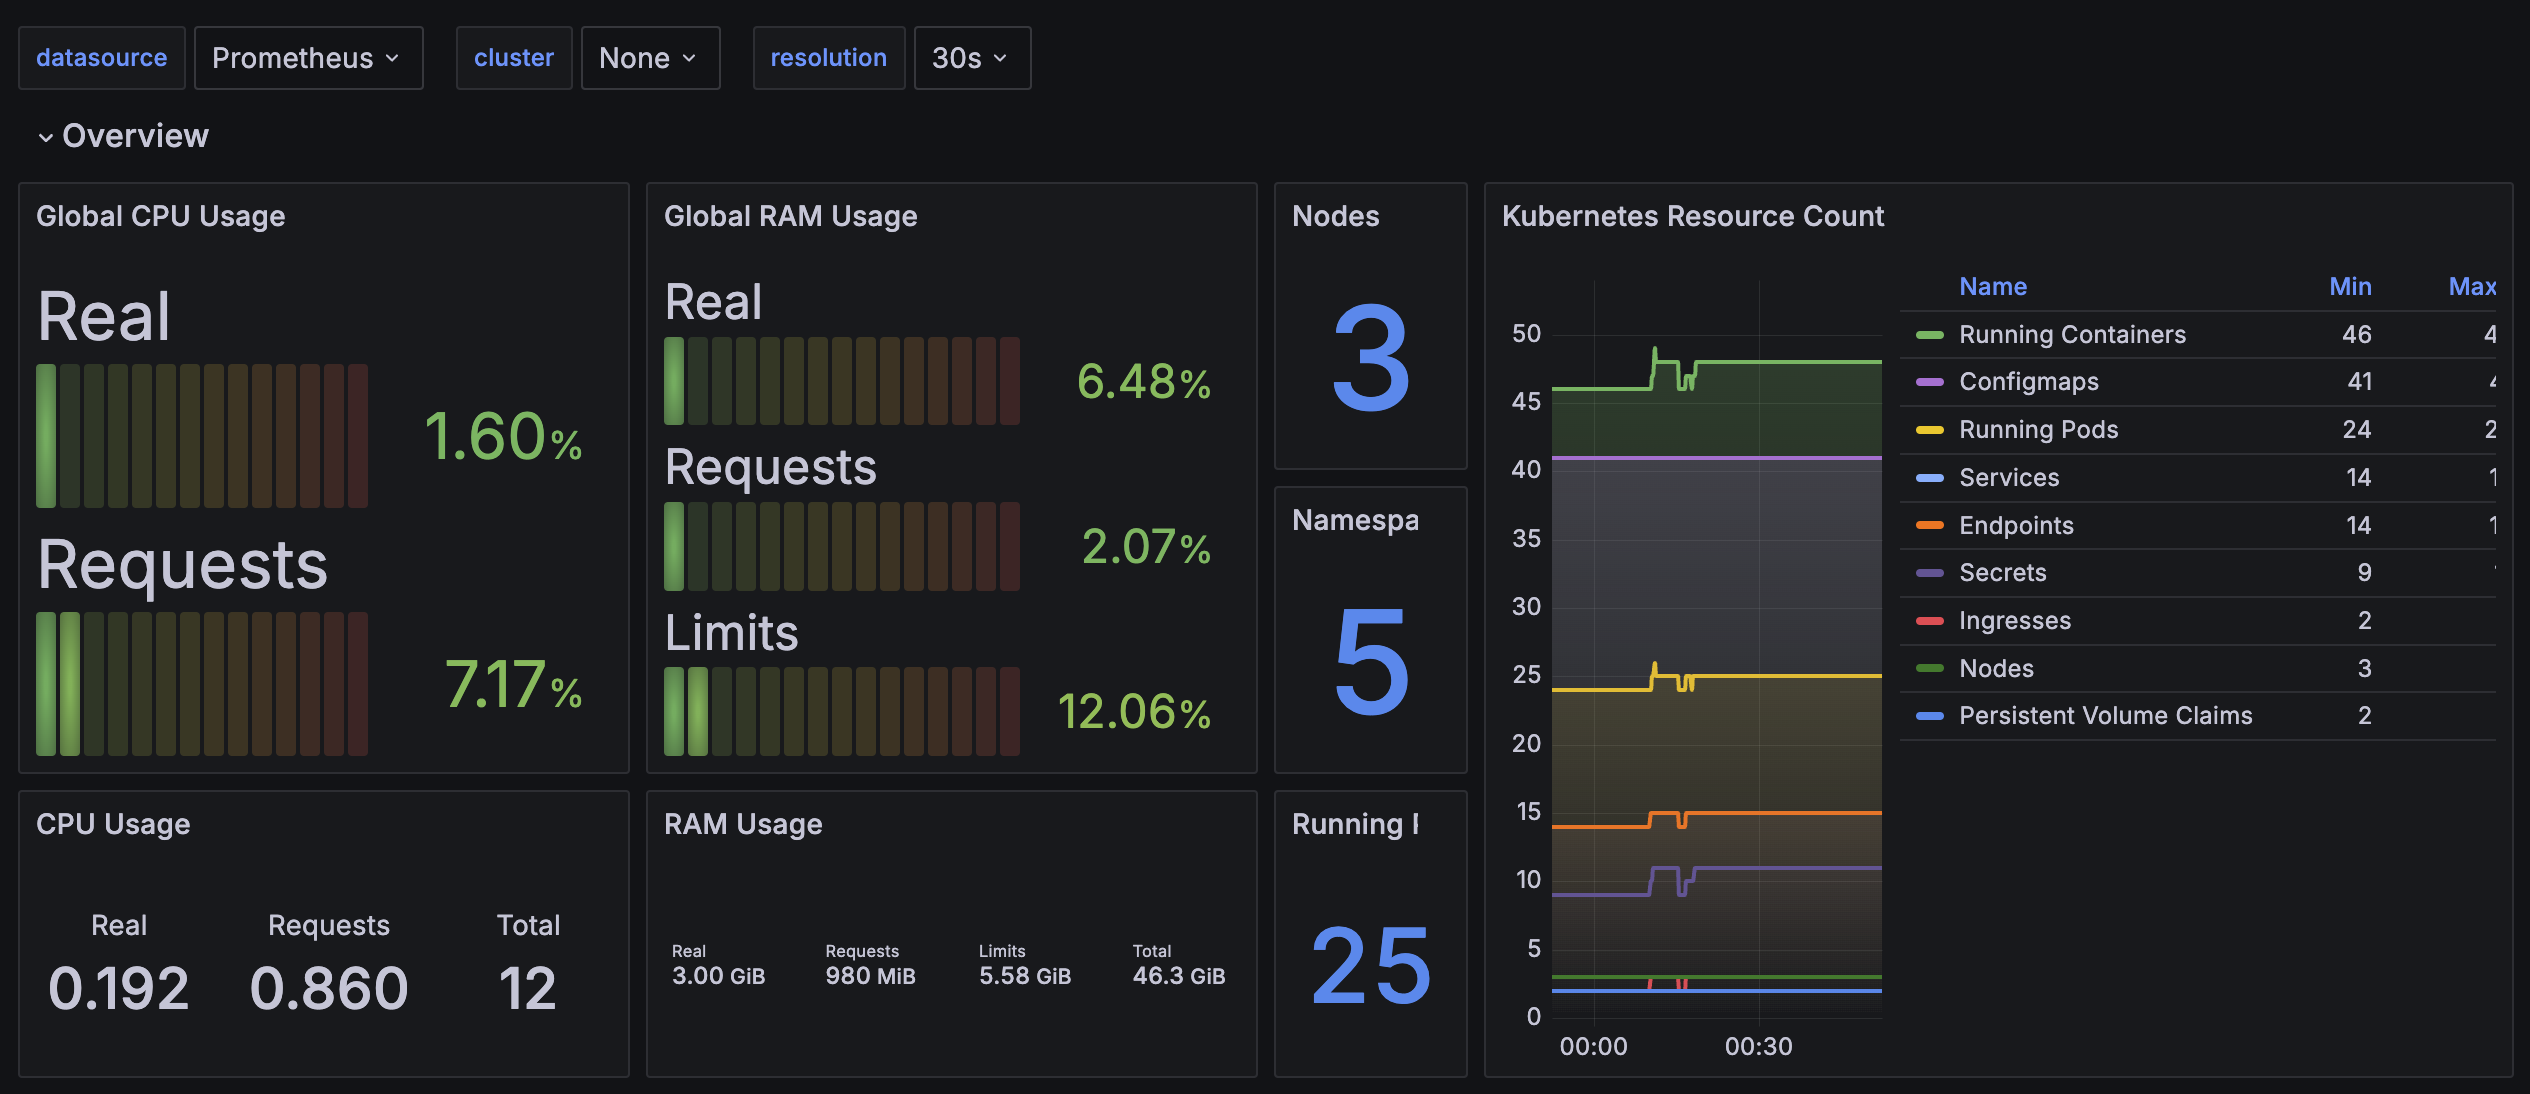
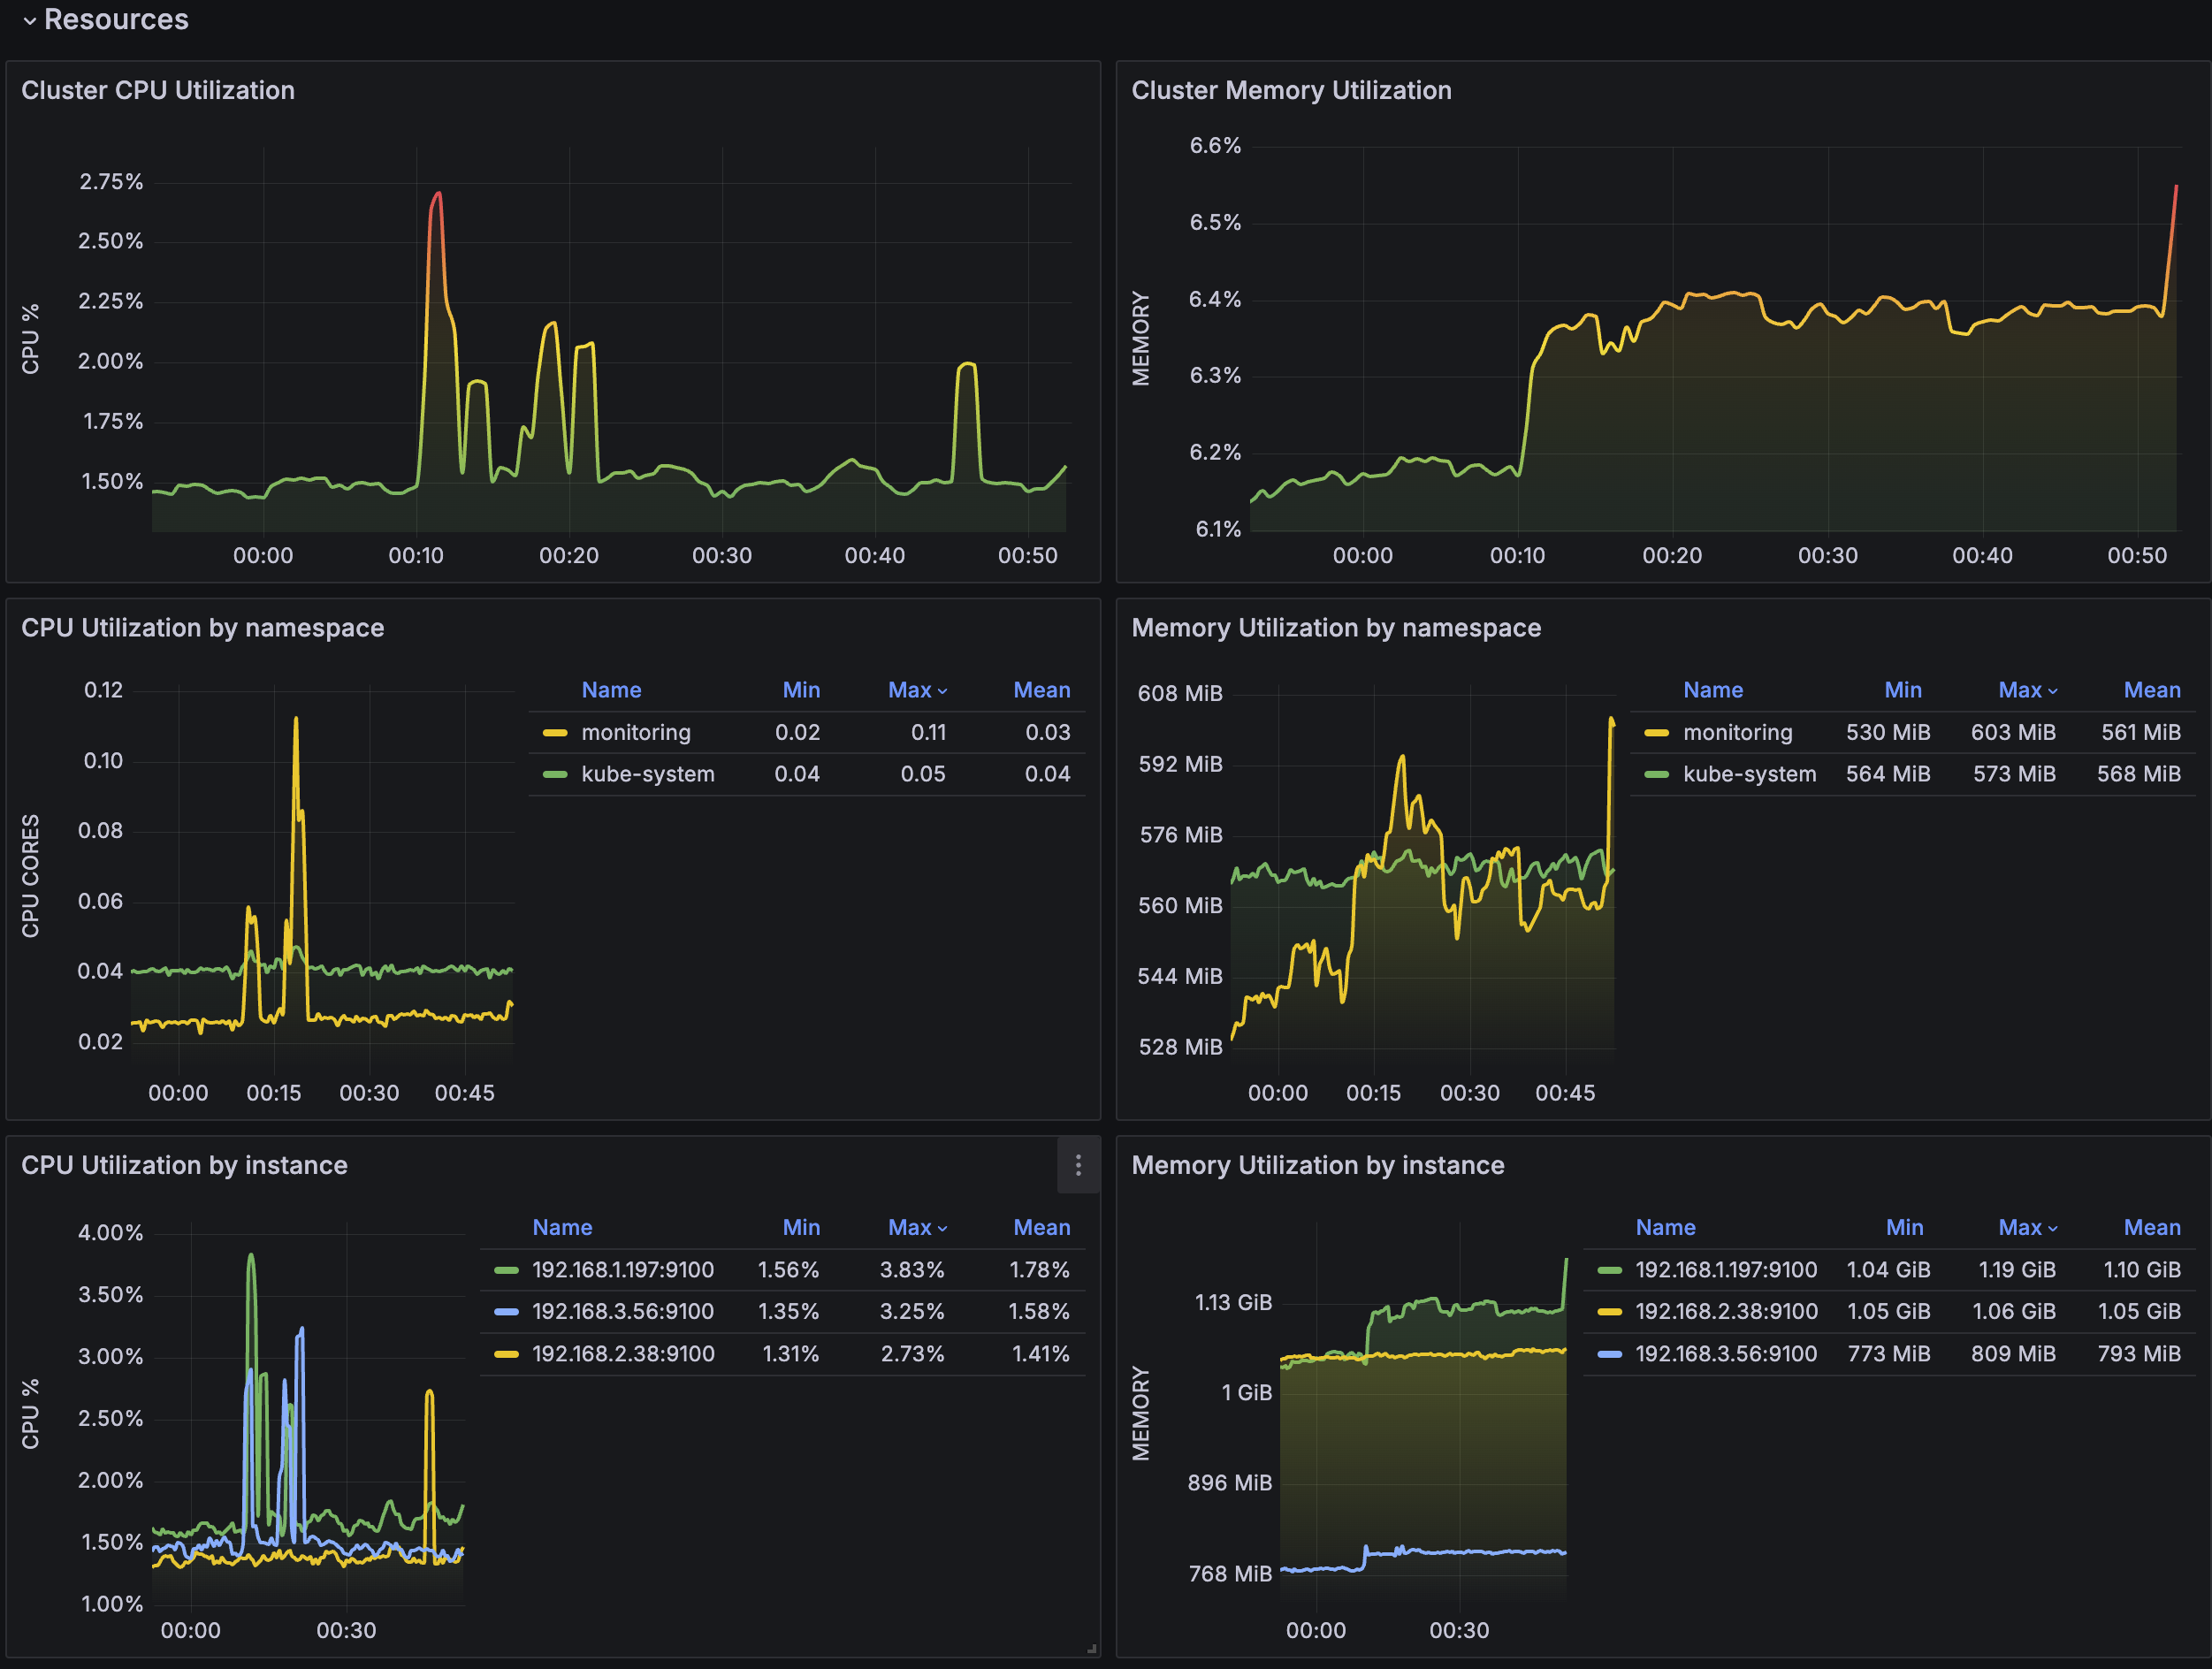
-
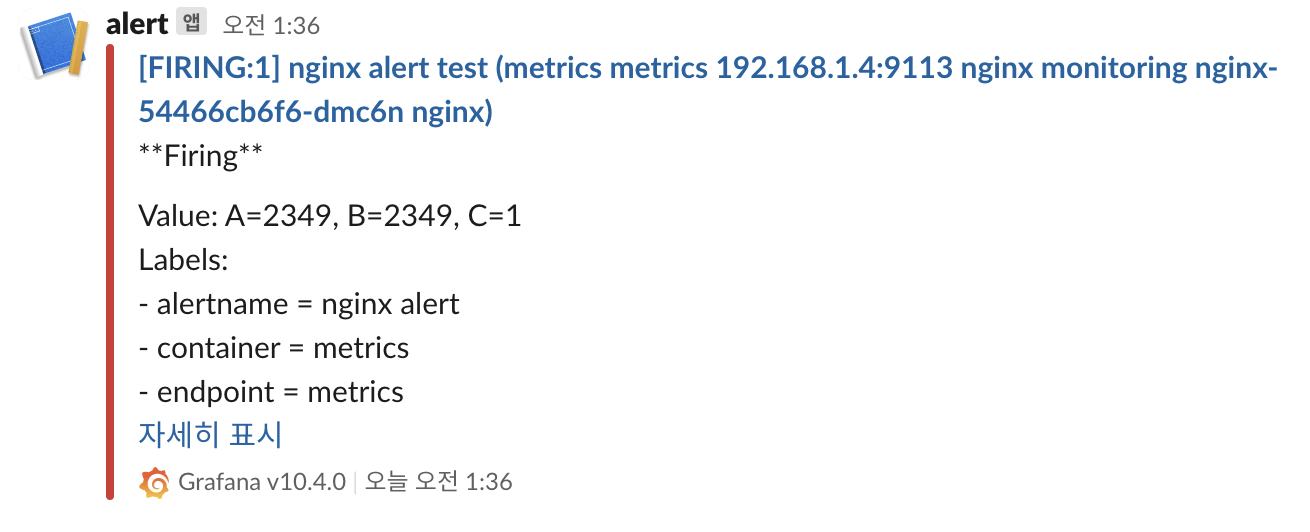
Alert
-
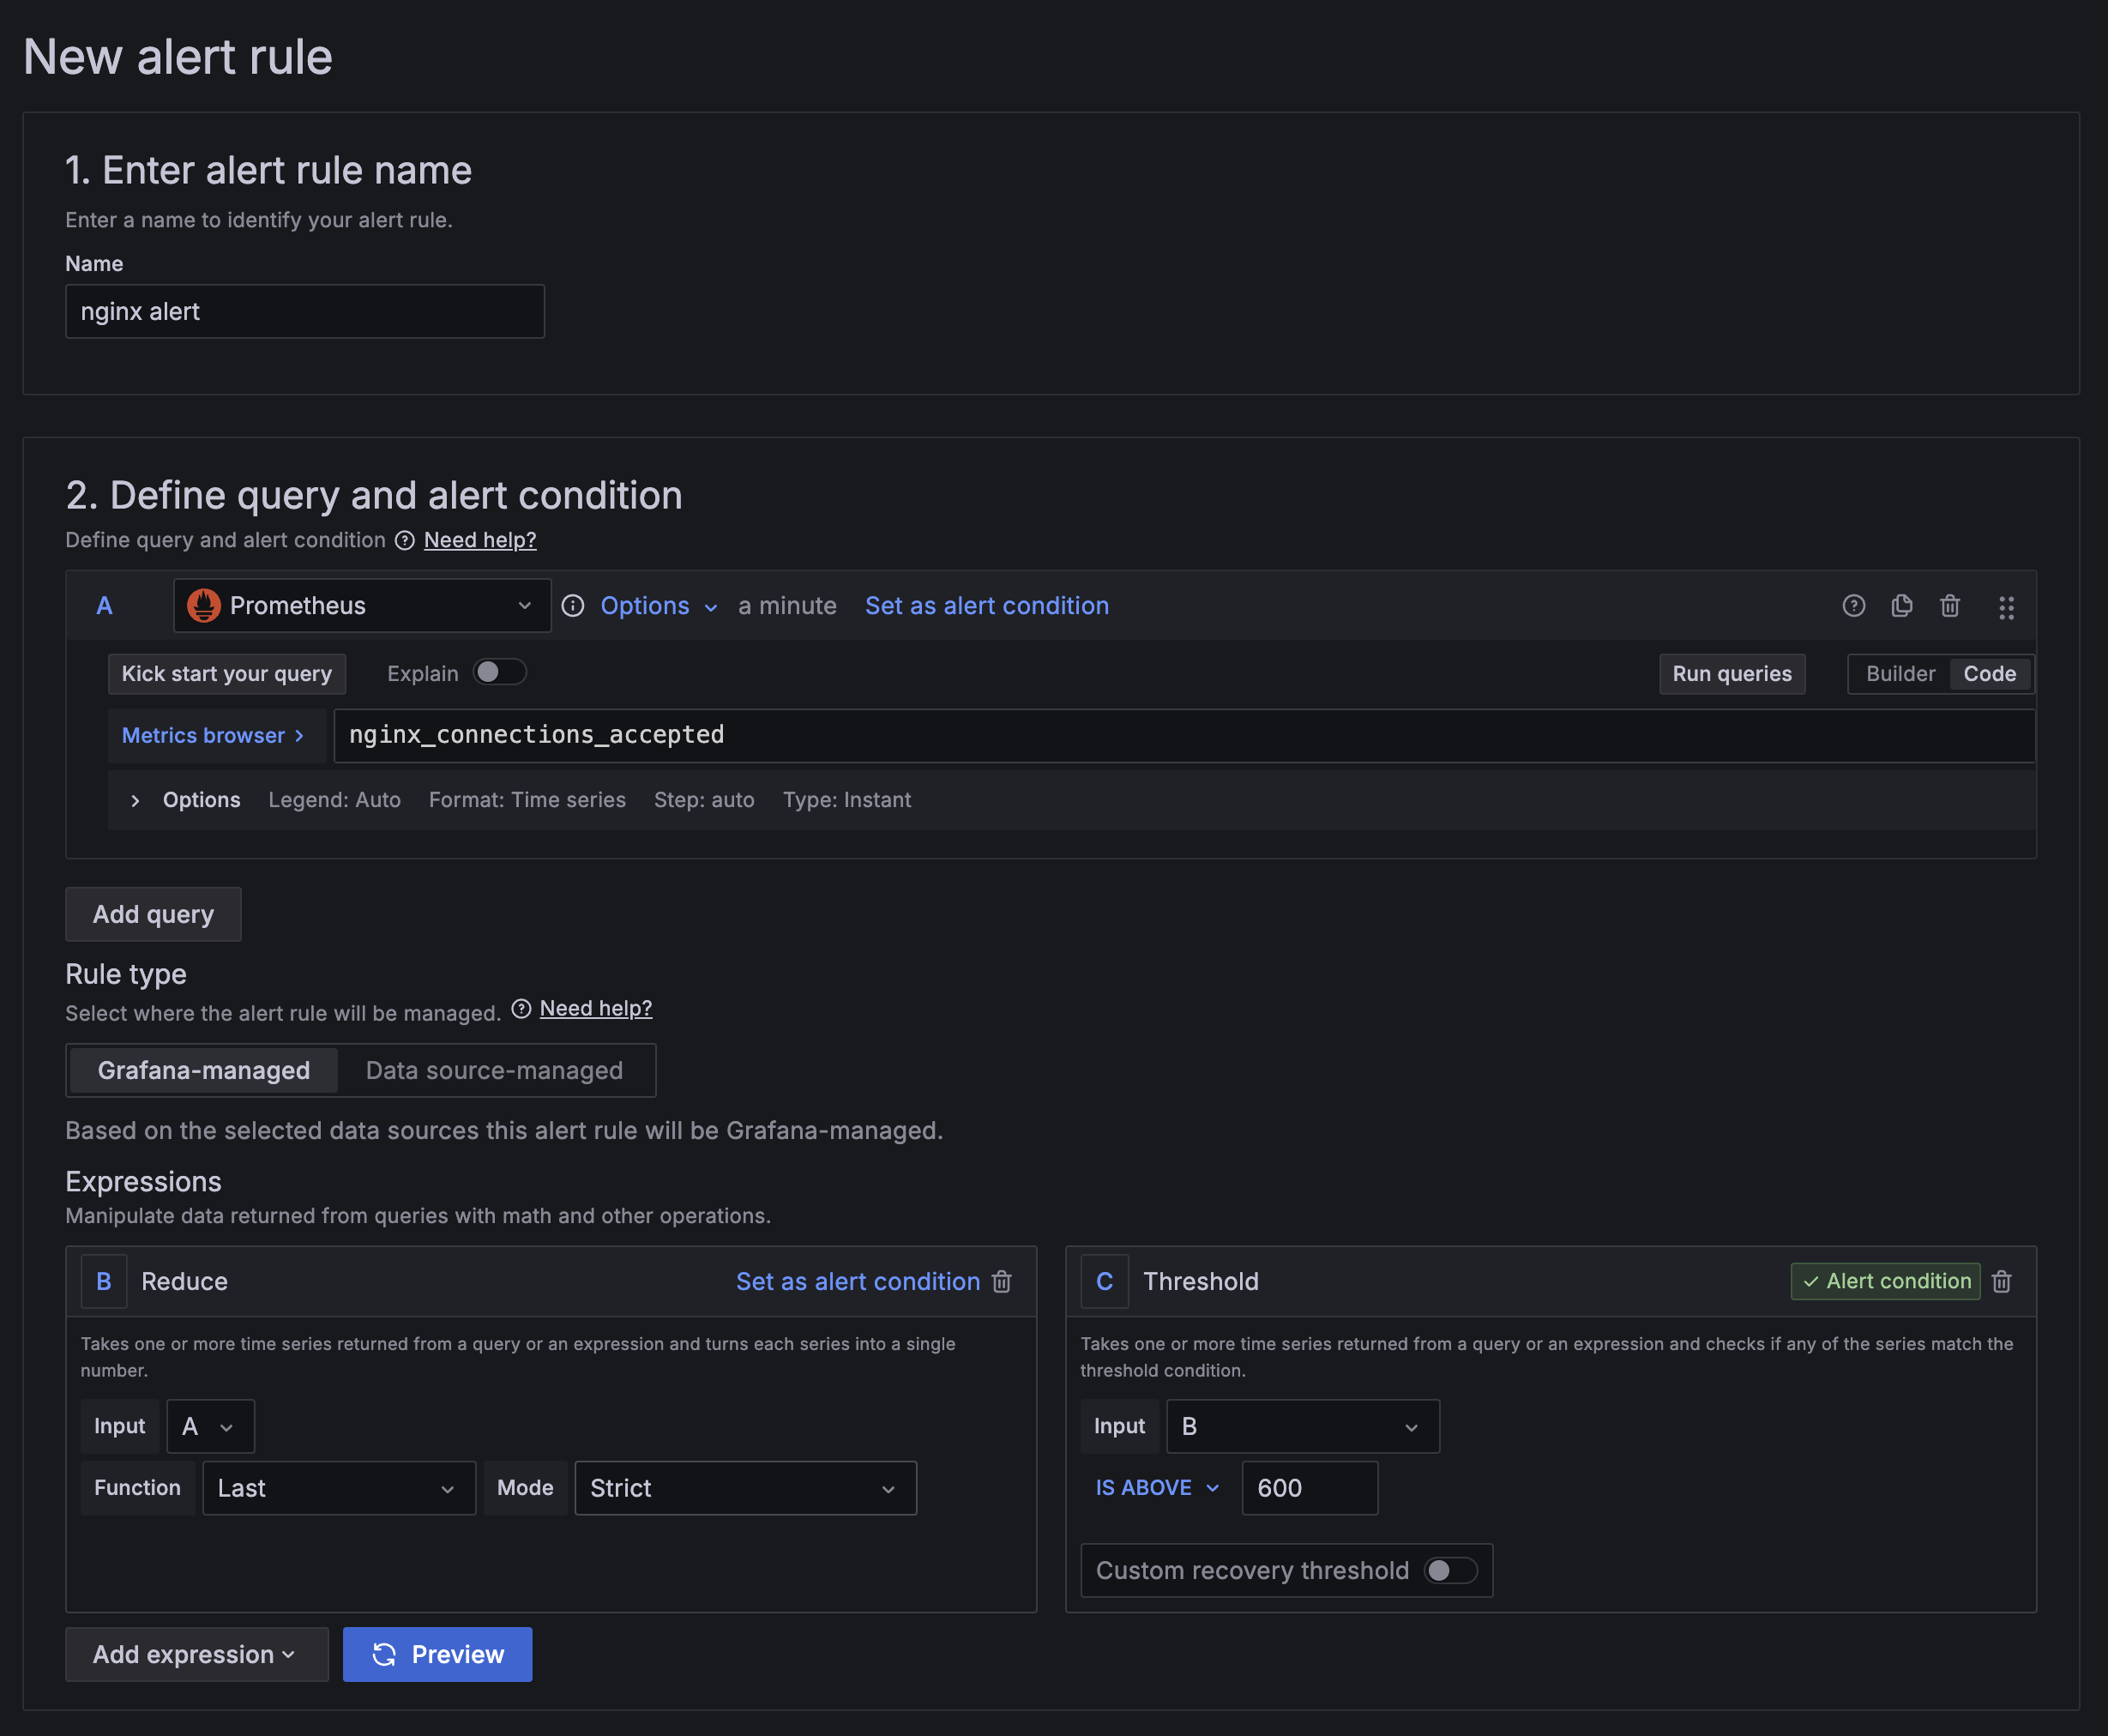
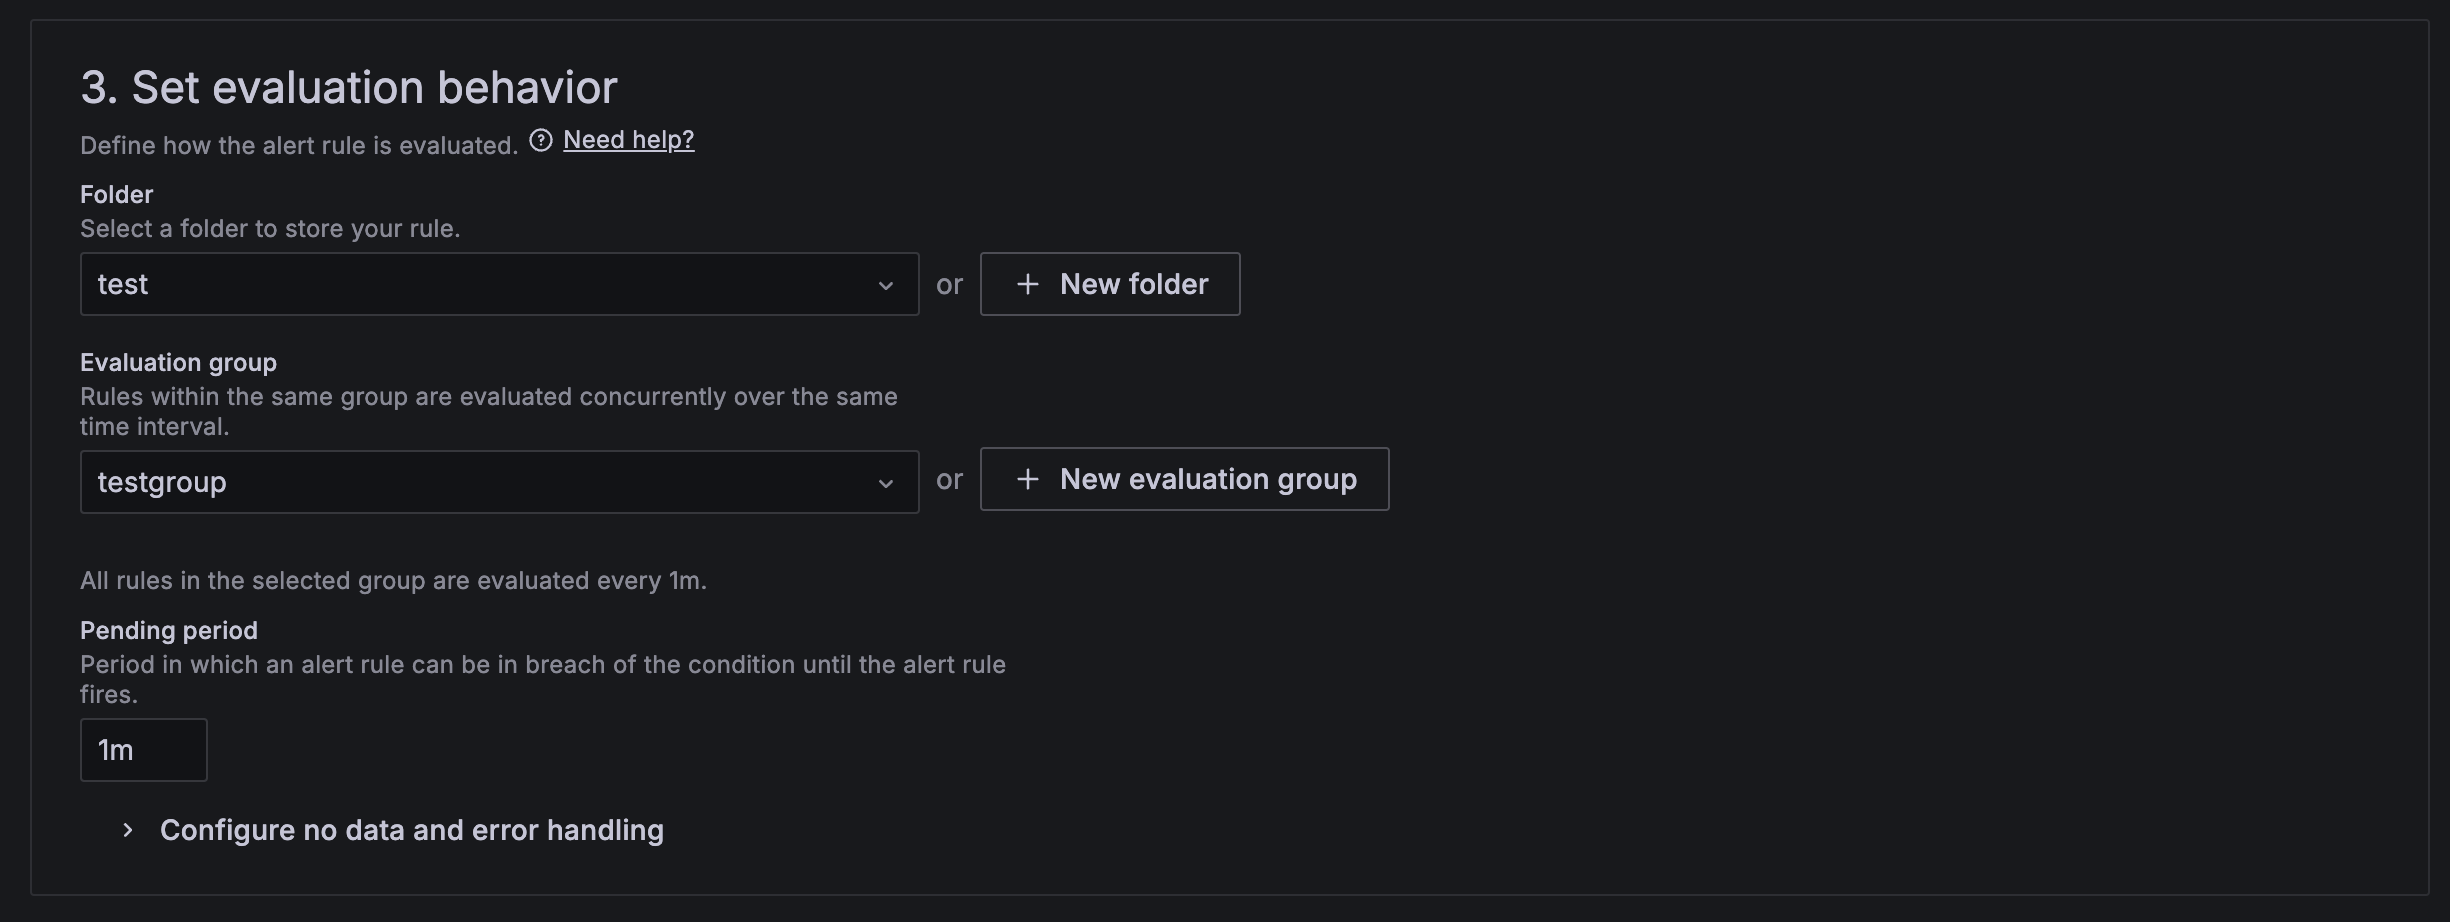
Alert Rule 생성
-
Home -> Alerting -> Alert rules -> New alert rule
-
1분 동안 nginx_connections_accepted > 600 이상일 때 알림 발송
-
-
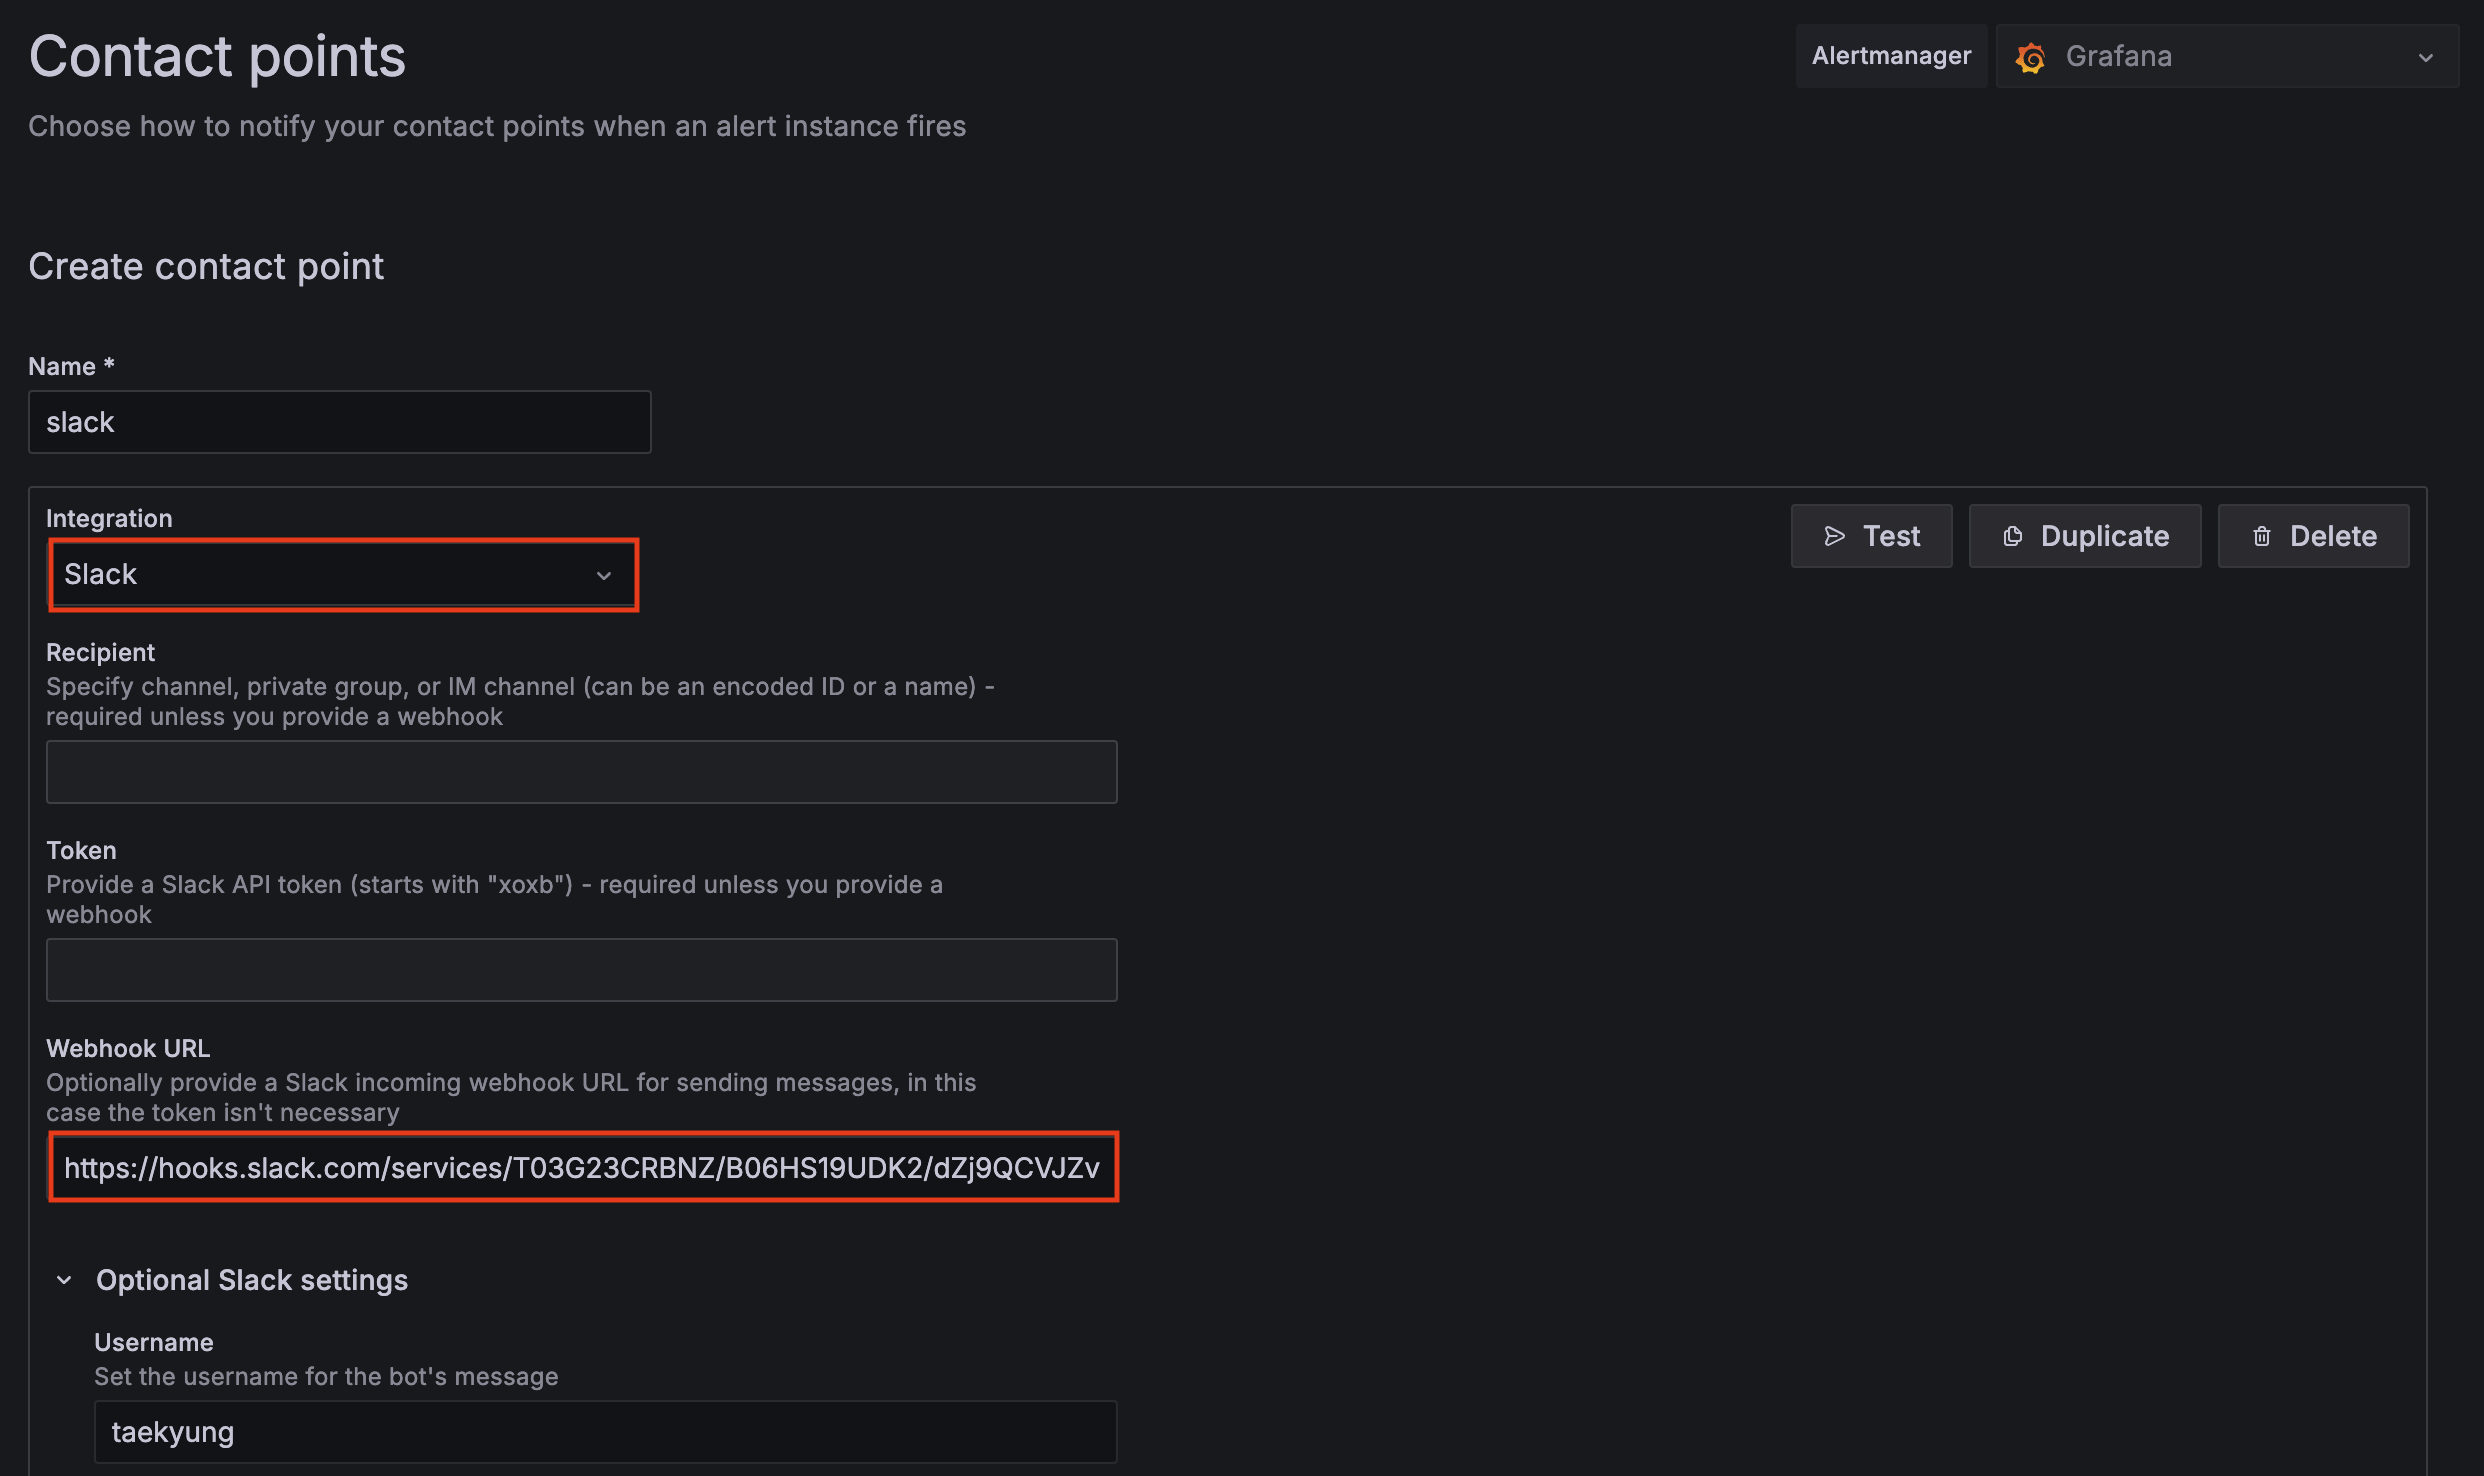
Contact point 생성
- Home -> Alerting -> Contact points -> Add contact point
- Home -> Alerting -> Contact points -> Add contact point
-
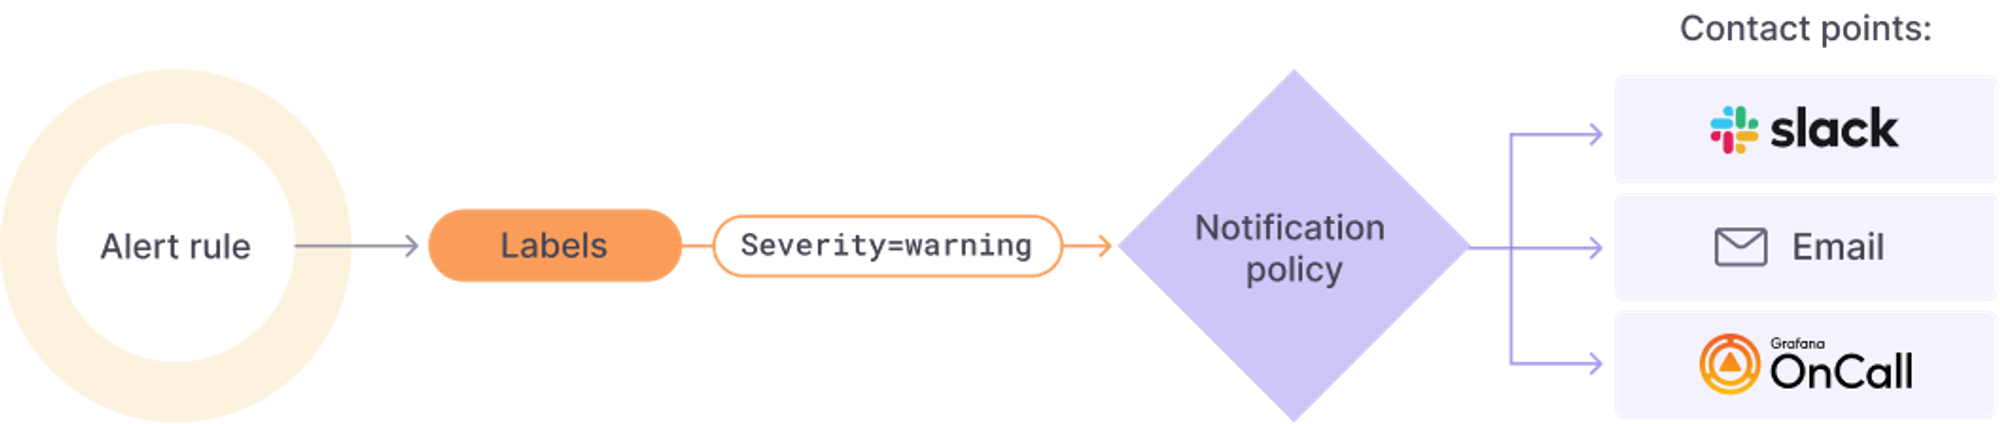
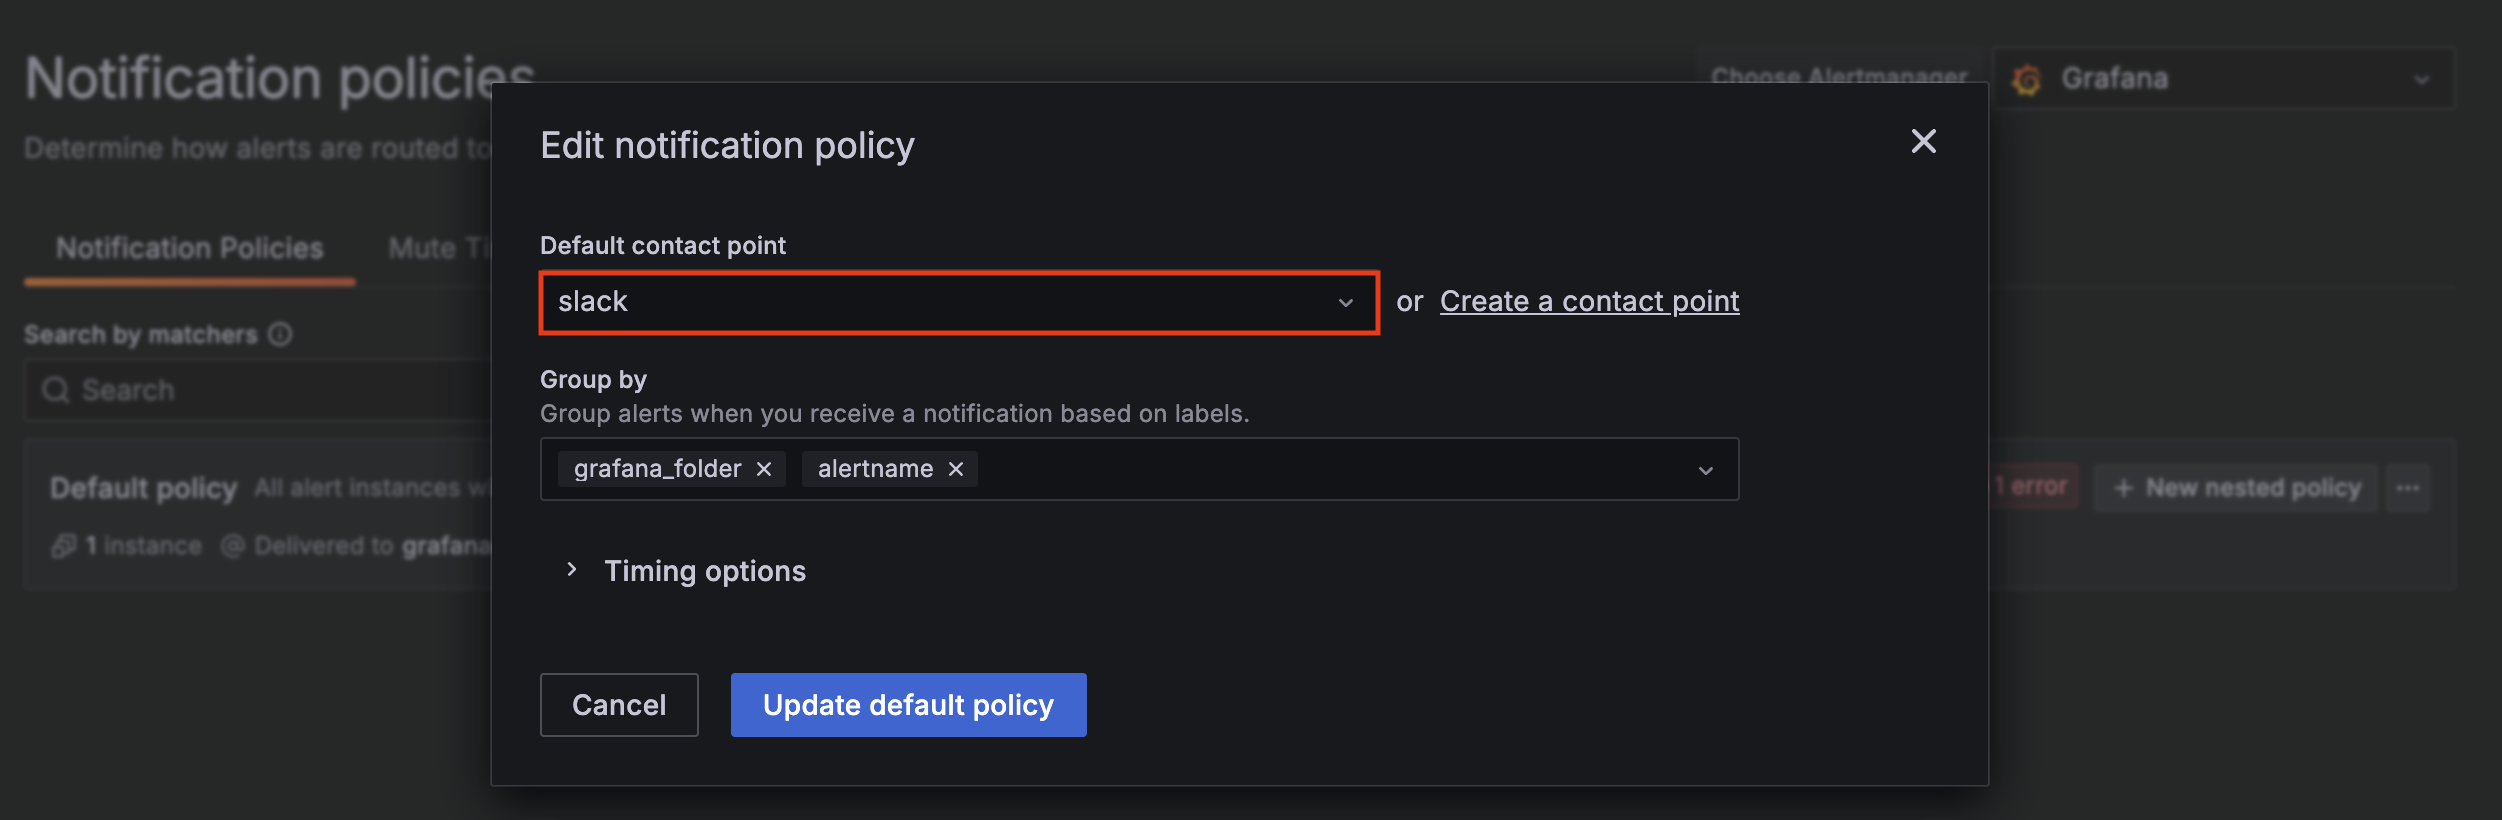
Notification policie 수정
- Home -> Alerting -> Notification policies -> Default Policy Edit
- Home -> Alerting -> Notification policies -> Default Policy Edit
-
Alert 테스트
while true; do curl -s https://nginx.$MyDomain -I | head -n 1; date; done