본 게시물은 CloudNet@팀 Gasida(서종호) 님이 진행하시는
AWS EKS Workshop Study 내용을 기반으로 작성되었습니다.
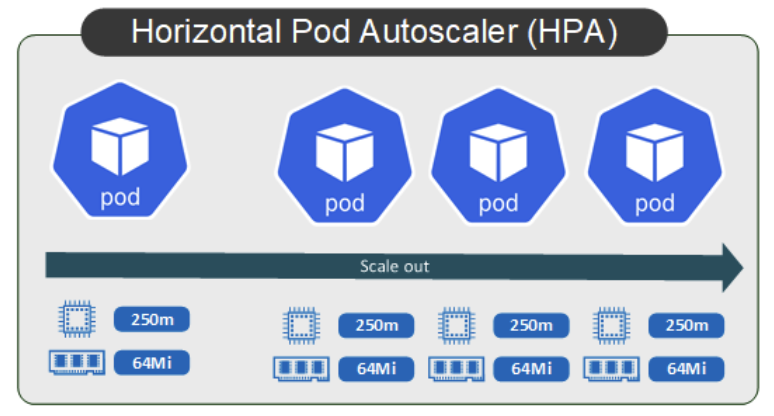
HPA - Horizontal Pod Autoscaler
지정된 지표를 모니터링하며, 해당 지표를 기반으로 파드의 수를 조절(수평 확장)하여 부하에 따라 리소스를 효율적으로 사용가능하다.
실습
php-apache.yaml
(CPU 과부하 연산 수행 , 100만번 덧셈 수행)
apiVersion: apps/v1
kind: Deployment
metadata:
  name: php-apache
spec:
  selector:
    matchLabels:
      run: php-apache
  template:
    metadata:
      labels:
        run: php-apache
    spec:
      containers:
      - name: php-apache
        image: registry.k8s.io/hpa-example
        ports:
        - containerPort: 80
        resources:
          limits:
            cpu: 500m
          requests:
            cpu: 200m
---
apiVersion: v1
kind: Service
metadata:
  name: php-apache
  labels:
    run: php-apache
spec:
  ports:
  - port: 80
  selector:
    run: php-apache
# Run and expose php-apache server
curl -s -O https://raw.githubusercontent.com/kubernetes/website/main/content/en/examples/application/php-apache.yaml
cat php-apache.yaml | yh
kubectl apply -f php-apache.yaml
# 확인
kubectl exec -it deploy/php-apache -- cat /var/www/html/index.php
...
# 모니터링 : 터미널2개 사용
watch -d 'kubectl get hpa,pod;echo;kubectl top pod;echo;kubectl top node'
kubectl exec -it deploy/php-apache -- top
# 접속
PODIP=$(kubectl get pod -l run=php-apache -o jsonpath={.items[0].status.podIP})
curl -s $PODIP; echo
HPA 생성 및 부하 발생 후 오토 스케일링 테스트
-> 증가 시 기본 대기 시간(30초), 감소 시 기본 대기 시간(5분)
# Create the HorizontalPodAutoscaler : requests.cpu=200m - 알고리즘
# Since each pod requests 200 milli-cores by kubectl run, this means an average CPU usage of 100 milli-cores.
kubectl autoscale deployment php-apache --cpu-percent=50 --min=1 --max=10
kubectl describe hpa
...
Name:                                                  php-apache
Namespace:                                             default
Labels:                                                <none>
Annotations:                                           <none>
CreationTimestamp:                                     Sat, 06 Apr 2024 23:30:38 +0900
Reference:                                             Deployment/php-apache
Metrics:                                               ( current / target )
  resource cpu on pods  (as a percentage of request):  <unknown> / 50%
Min replicas:                                          1
Max replicas:                                          10
Deployment pods:                                       0 current / 0 desired
Events:                                                <none>
...

# HPA 설정 확인
kubectl get hpa php-apache -o yaml | kubectl neat | yh
spec:
  minReplicas: 1               # [4] 또는 최소 1개까지 줄어들 수도 있습니다
  maxReplicas: 10              # [3] 포드를 최대 5개까지 늘립니다
  scaleTargetRef:
    apiVersion: apps/v1
    kind: Deployment
    name: php-apache           # [1] php-apache 의 자원 사용량에서
  metrics:
  - type: Resource
    resource:
      name: cpu
      target:
        type: Utilization
        averageUtilization: 50  # [2] CPU 활용률이 50% 이상인 경우

# 반복 접속 1 (파드1 IP로 접속) >> 증가 확인 후 중지
while true;do curl -s $PODIP; sleep 0.5; done

# 반복 접속 2 (서비스명 도메인으로 파드들 분산 접속) >> 증가 확인(몇개까지 증가되는가? 그 이유는?) 후 중지 >> 중지 5분 후 파드 갯수 감소 확인
# Run this in a separate terminal
# so that the load generation continues and you can carry on with the rest of the steps
kubectl run -i --tty load-generator --rm --image=busybox:1.28 --restart=Never -- /bin/sh -c "while sleep 0.01; do wget -q -O- http://php-apache; done"
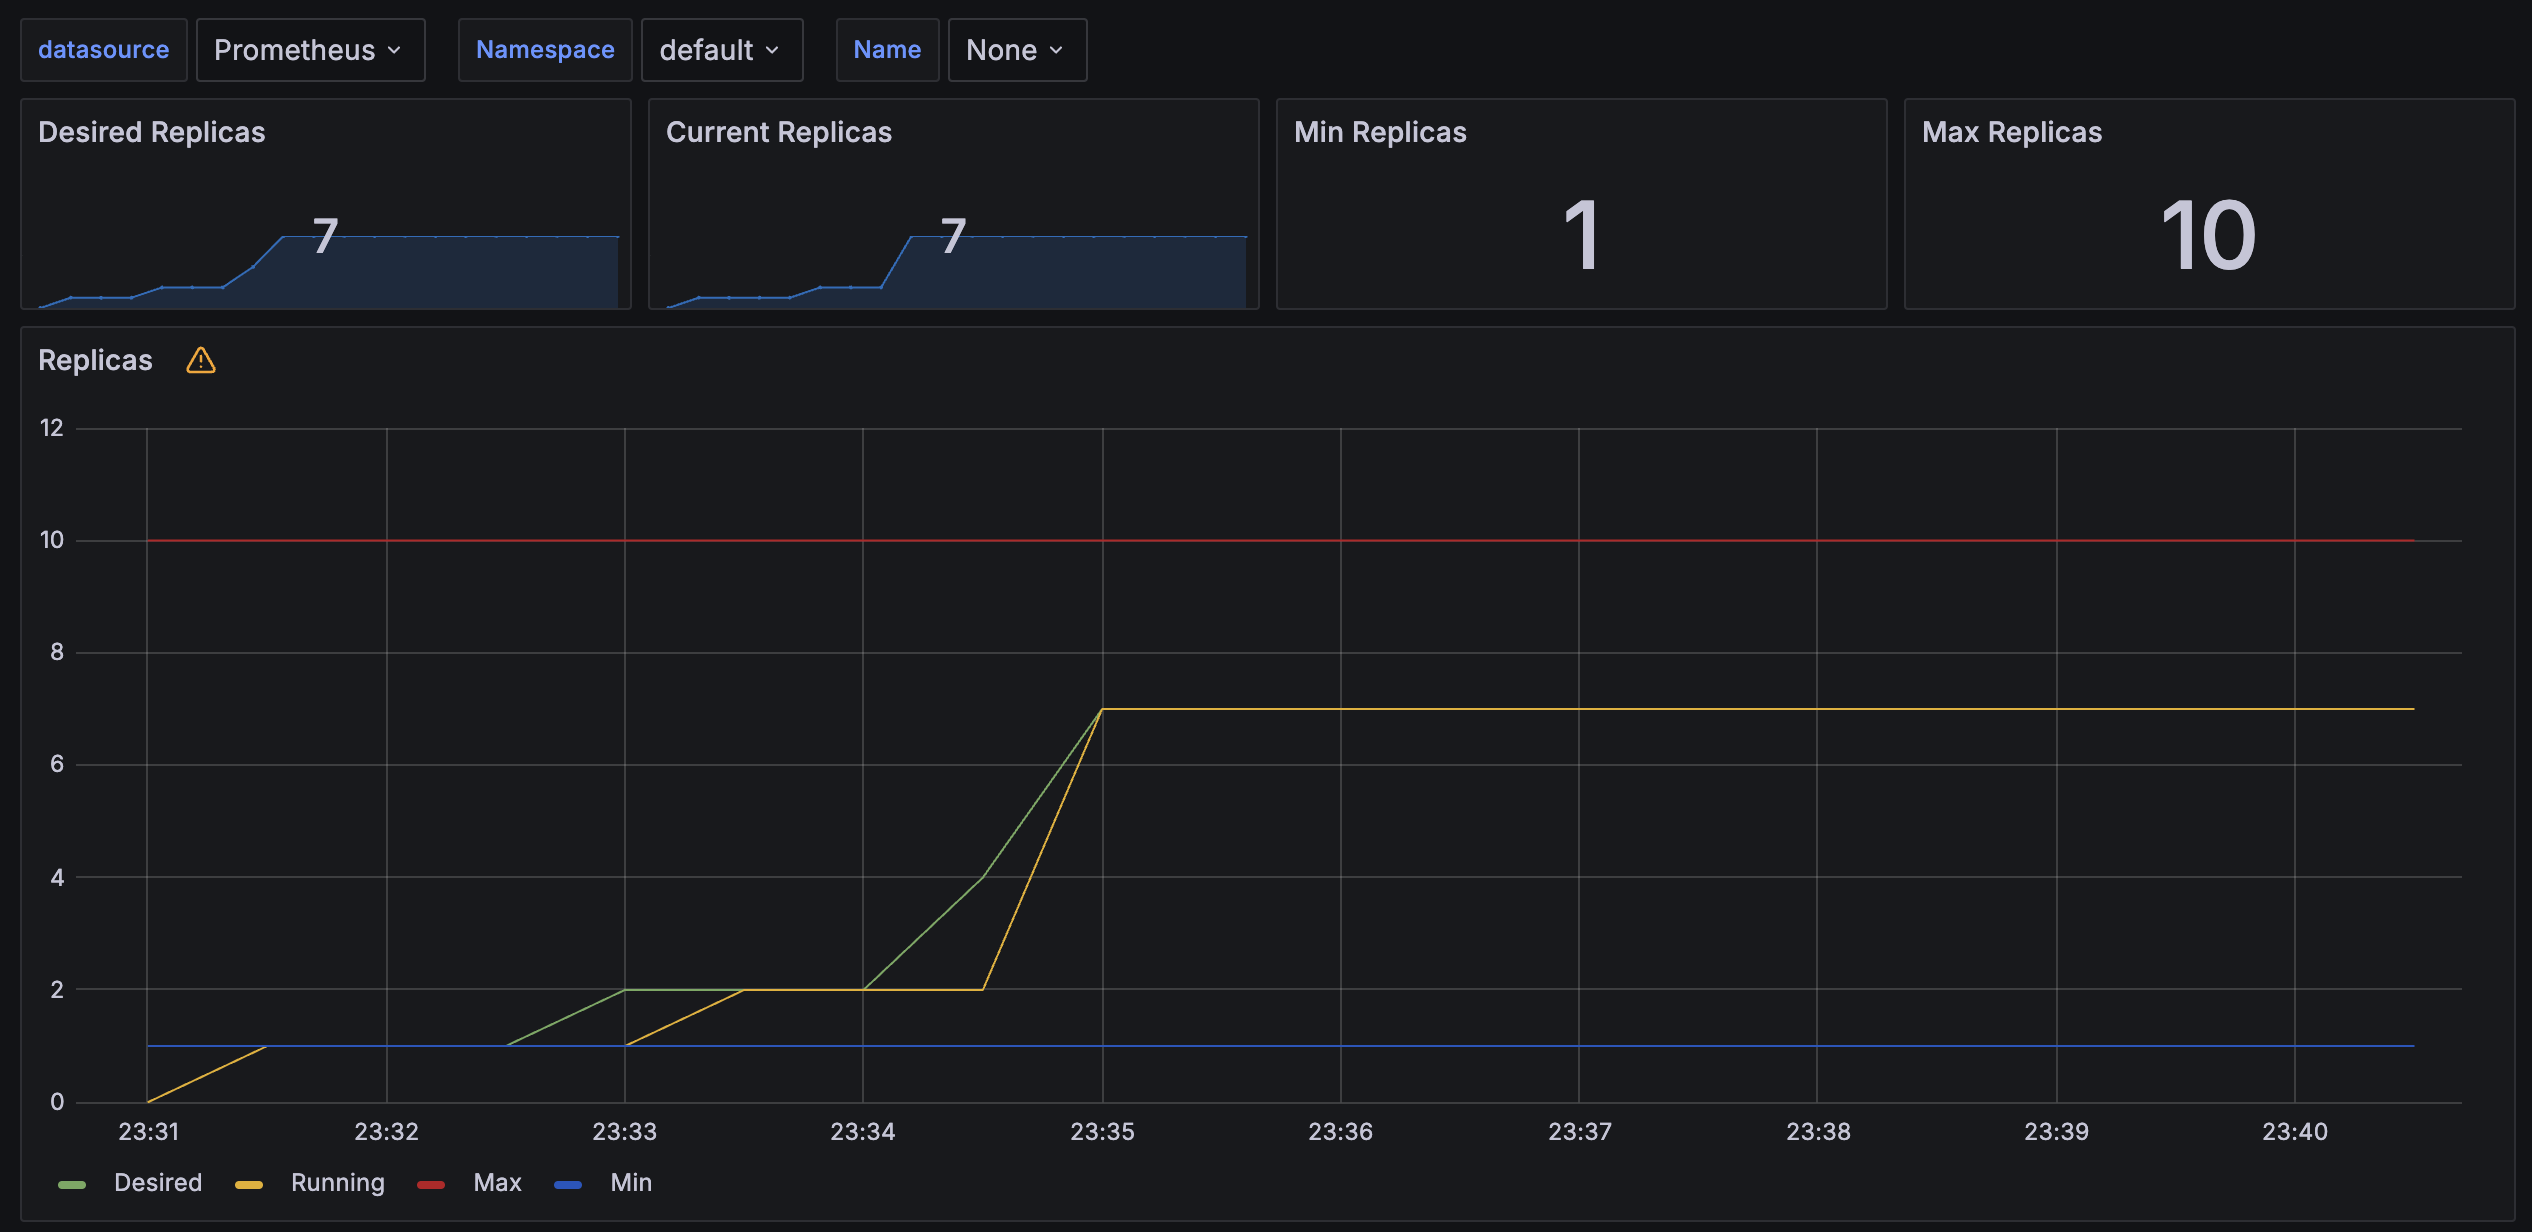
Pod 개수가 7개까지 지속적으로 증가한다.
7개 Pod가 모든 요청을 효율적으로 처리하여, 그 이상 증가하지 않는다.
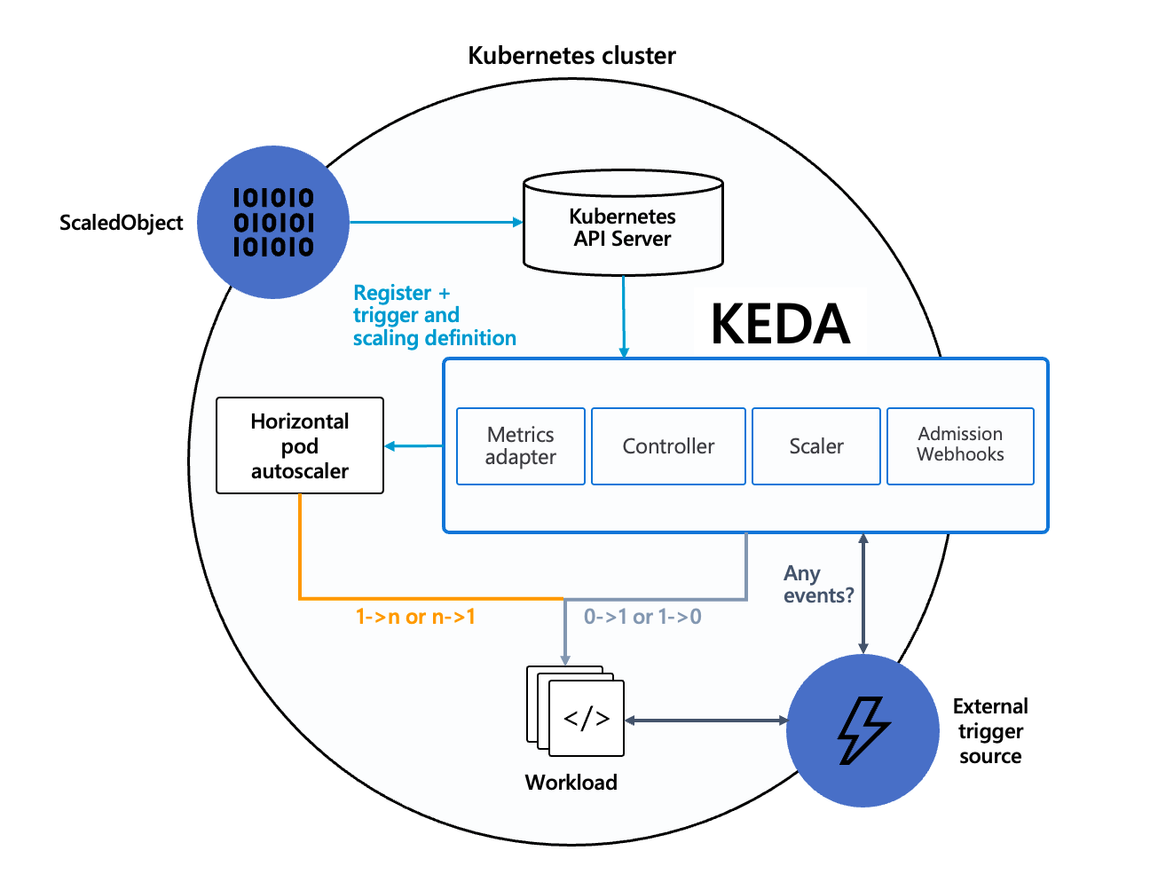
KEDA - Kubernetes based Event Driven Autoscaler
기존의 HPA(Horizontal Pod Autoscaler)는 리소스(CPU, Memory) 메트릭을 기반으로 스케일 여부를 결정한다.
반면에 KEDA는 특정 이벤트를 기반으로 스케일 여부를 결정할 수 있다.
예를 들어 airflow는 metadb를 통해 현재 실행 중이거나 대기 중인 task가 얼마나 존재하는지 알 수 있으며,
이러한 이벤트를 활용하여 worker의 scale을 결정한다면 queue에 task가 많이 추가되는 시점에 더 빠르게 확장할 수 있다.
실습
KEDA with Helm
-> 특정 이벤트(cron 등)기반의 파드 오토 스케일링
# KEDA 설치
cat <<EOT > keda-values.yaml
metricsServer:
useHostNetwork: true
prometheus:
metricServer:
enabled: true
port: 9022
portName: metrics
path: /metrics
serviceMonitor:
# Enables ServiceMonitor creation for the Prometheus Operator
enabled: true
podMonitor:
# Enables PodMonitor creation for the Prometheus Operator
enabled: true
operator:
enabled: true
port: 8080
serviceMonitor:
# Enables ServiceMonitor creation for the Prometheus Operator
enabled: true
podMonitor:
# Enables PodMonitor creation for the Prometheus Operator
enabled: true
webhooks:
enabled: true
port: 8080
serviceMonitor:
# Enables ServiceMonitor creation for the Prometheus webhooks
enabled: true
EOT
kubectl create namespace keda
helm repo add kedacore https://kedacore.github.io/charts
helm install keda kedacore/keda --version 2.13.0 --namespace keda -f keda-values.yaml
# KEDA 설치 확인
kubectl get all -n keda
kubectl get validatingwebhookconfigurations keda-admission
kubectl get validatingwebhookconfigurations keda-admission | kubectl neat | yh
kubectl get crd | grep keda
# keda 네임스페이스에 디플로이먼트 생성
kubectl apply -f php-apache.yaml -n keda
kubectl get pod -n keda
# ScaledObject 정책 생성 : cron
cat <<EOT > keda-cron.yaml
apiVersion: keda.sh/v1alpha1
kind: ScaledObject
metadata:
name: php-apache-cron-scaled
spec:
minReplicaCount: 0
maxReplicaCount: 2
pollingInterval: 30
cooldownPeriod: 300
scaleTargetRef:
apiVersion: apps/v1
kind: Deployment
name: php-apache
triggers:
- type: cron
metadata:
timezone: Asia/Seoul
start: 00,15,30,45 * * * *
end: 05,20,35,50 * * * *
desiredReplicas: "1"
EOT
kubectl apply -f keda-cron.yaml -n keda
# 그라파나 대시보드 추가
# 모니터링
watch -d 'kubectl get ScaledObject,hpa,pod -n keda'
kubectl get ScaledObject -w
# 확인
kubectl get ScaledObject,hpa,pod -n keda
kubectl get hpa -o jsonpath={.items[0].spec} -n keda | jq
...
"metrics": [
{
"external": {
"metric": {
"name": "s0-cron-Asia-Seoul-00,15,30,45xxxx-05,20,35,50xxxx",
"selector": {
"matchLabels": {
"scaledobject.keda.sh/name": "php-apache-cron-scaled"
}
}
},
"target": {
"averageValue": "1",
"type": "AverageValue"
}
},
"type": "External"
}
# KEDA 및 deployment 등 삭제
kubectl delete -f keda-cron.yaml -n keda && kubectl delete deploy php-apache -n keda && helm uninstall keda -n keda
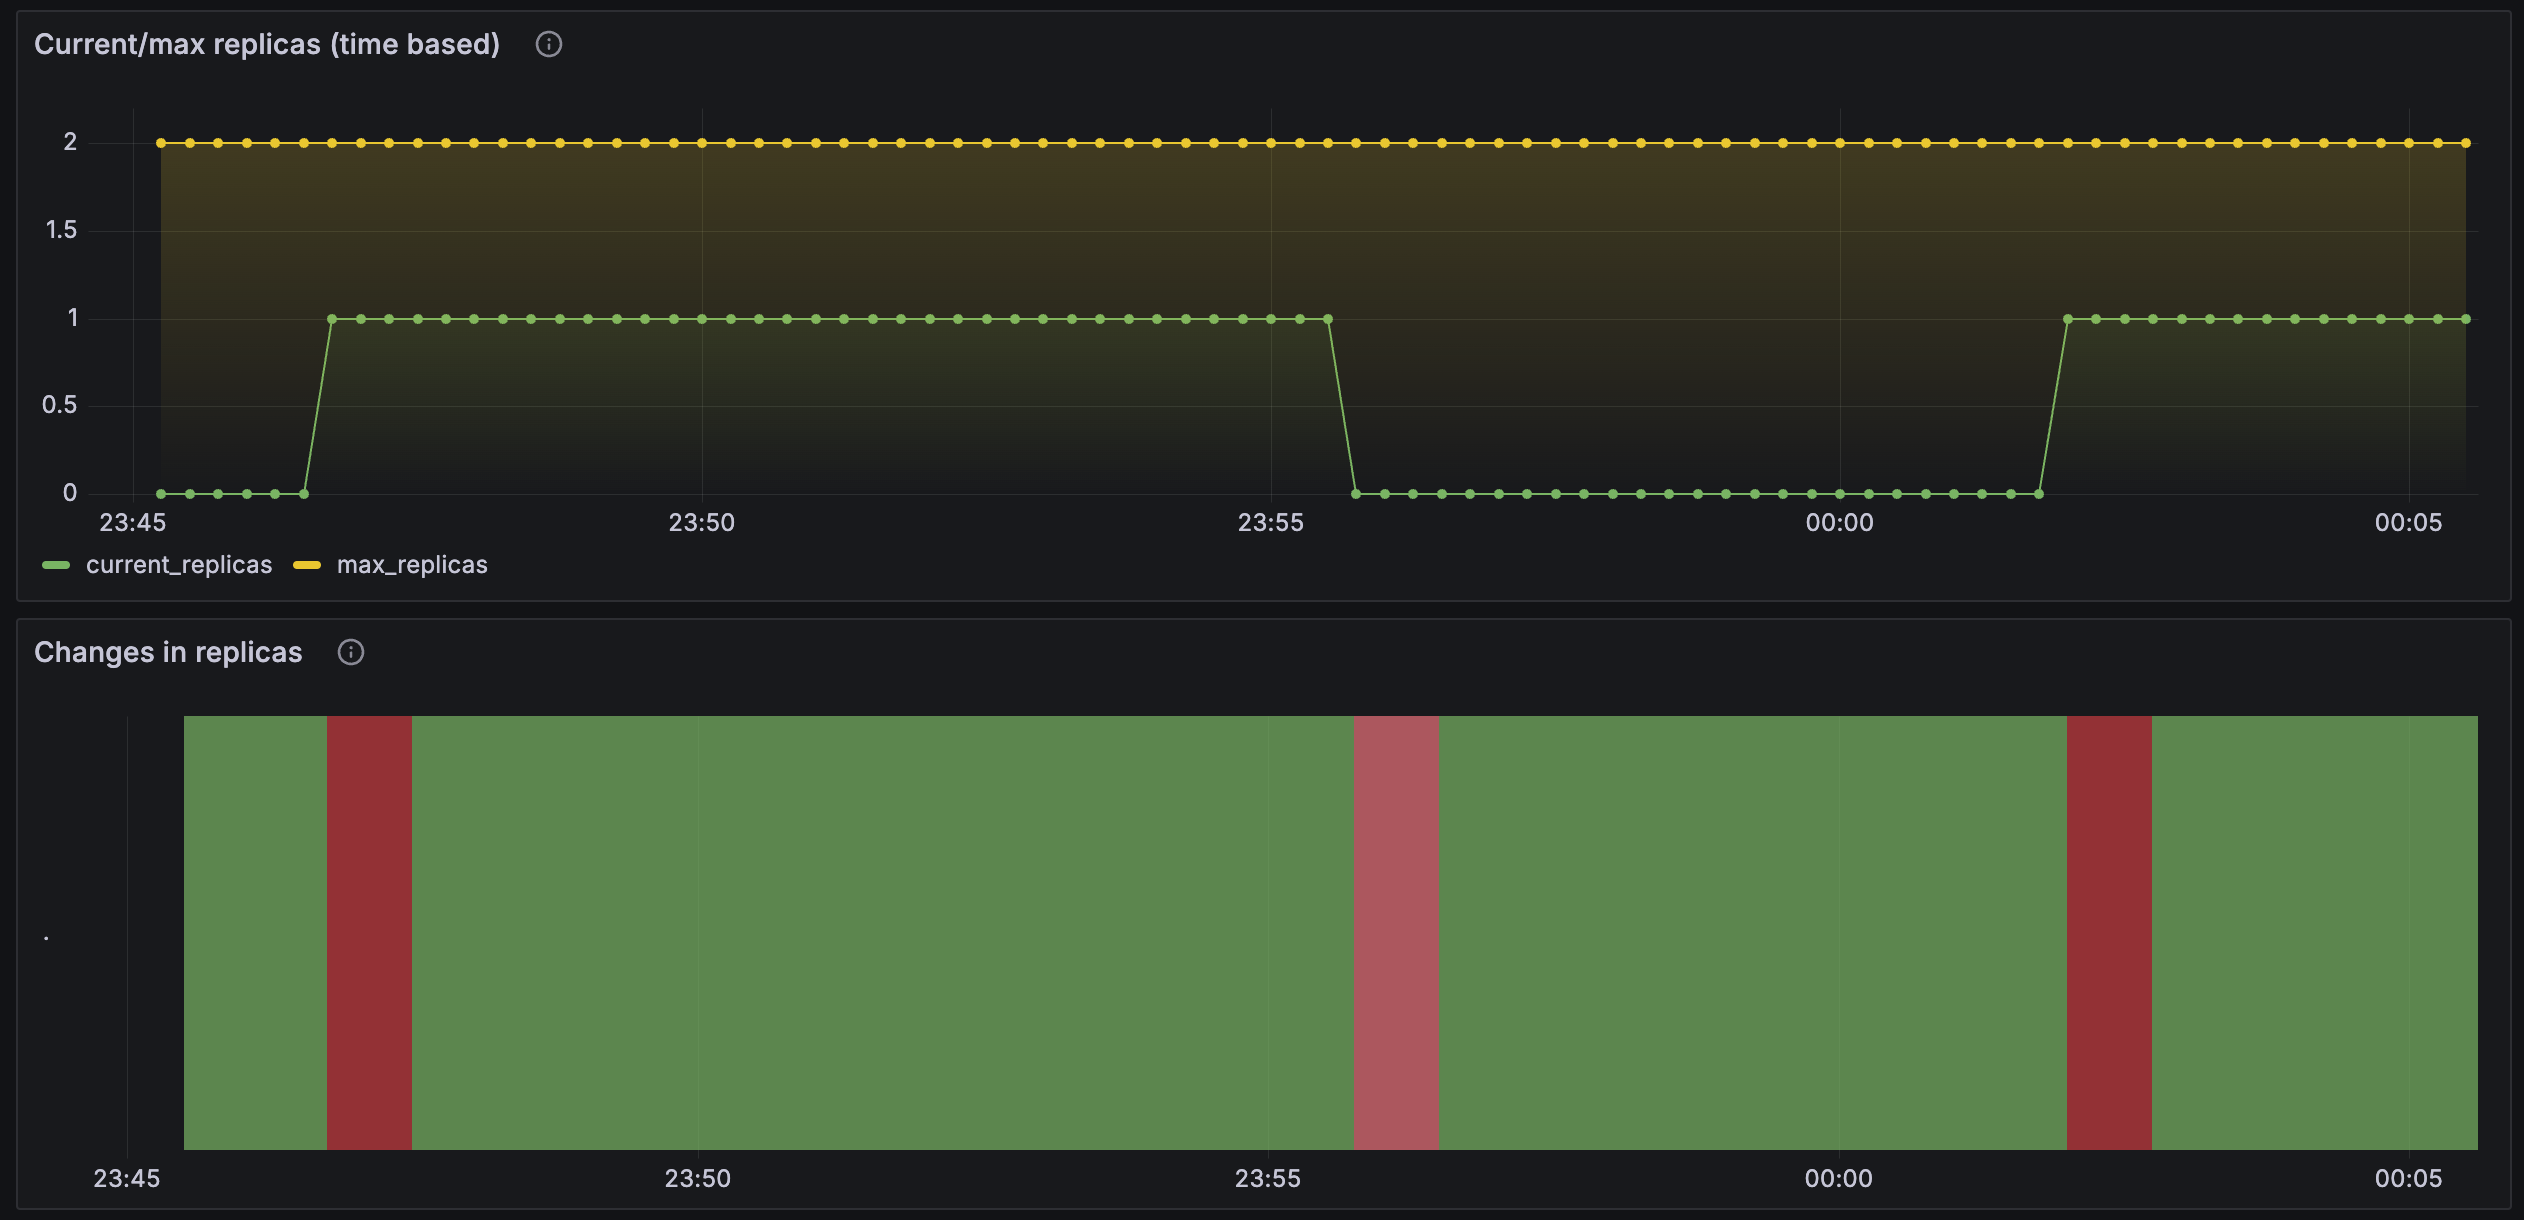
kubectl delete namespace keda15분 간격으로 Pod 개수가 증가하며, 5분 후에 감소한다.
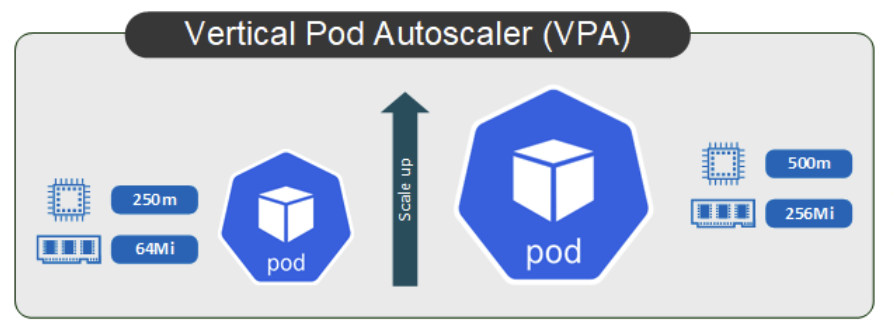
VPA - Vertical Pod Autoscaler
지정된 지표를 모니터링하며, 해당 지표를 기반으로 파드의 리소스 스펙을 조절(수직 확장)하여 부하에 따라 리소스를 효율적으로 사용가능하다.
실습
# 코드 다운로드
git clone https://github.com/kubernetes/autoscaler.git
cd ~/autoscaler/vertical-pod-autoscaler/
tree hack

# openssl 버전 확인
openssl version
OpenSSL 1.0.2k-fips  26 Jan 2017

# openssl 1.1.1 이상 버전 확인
yum install openssl11 -y
openssl11 version
OpenSSL 1.1.1g FIPS  21 Apr 2020

# 스크립트파일내에 openssl11 수정
sed -i 's/openssl/openssl11/g' ~/autoscaler/vertical-pod-autoscaler/pkg/admission-controller/gencerts.sh

# Deploy the Vertical Pod Autoscaler to your cluster with the following command.
watch -d kubectl get pod -n kube-system
cat hack/vpa-up.sh
./hack/vpa-up.sh
kubectl get crd | grep autoscaling
kubectl get mutatingwebhookconfigurations vpa-webhook-config
kubectl get mutatingwebhookconfigurations vpa-webhook-config -o json | jq
pod 실행 후 약 2~3분 뒤에 pod resource.reqeust가 VPA에 의해 수정
# 모니터링
watch -d "kubectl top pod;echo "----------------------";kubectl describe pod | grep Requests: -A2"

# 공식 예제 배포
cd ~/autoscaler/vertical-pod-autoscaler/
cat examples/hamster.yaml | yh
kubectl apply -f examples/hamster.yaml && kubectl get vpa -w

# 파드 리소스 Requestes 확인
kubectl describe pod | grep Requests: -A2
    Requests:
      cpu:        100m
      memory:     50Mi
--
    Requests:
      cpu:        587m
      memory:     262144k
--
    Requests:
      cpu:        587m
      memory:     262144k

# VPA에 의해 기존 파드 삭제되고 신규 파드가 생성됨
kubectl get events --sort-by=".metadata.creationTimestamp" | grep VPA
2m16s       Normal    EvictedByVPA             pod/hamster-5bccbb88c6-s6jkp         Pod was evicted by VPA Updater to apply resource recommendation.
76s         Normal    EvictedByVPA             pod/hamster-5bccbb88c6-jc6gq         Pod was evicted by VPA Updater to apply resource recommendation.