Groupby
- SQL groupby 명령어와 같음
- split → apply → combine
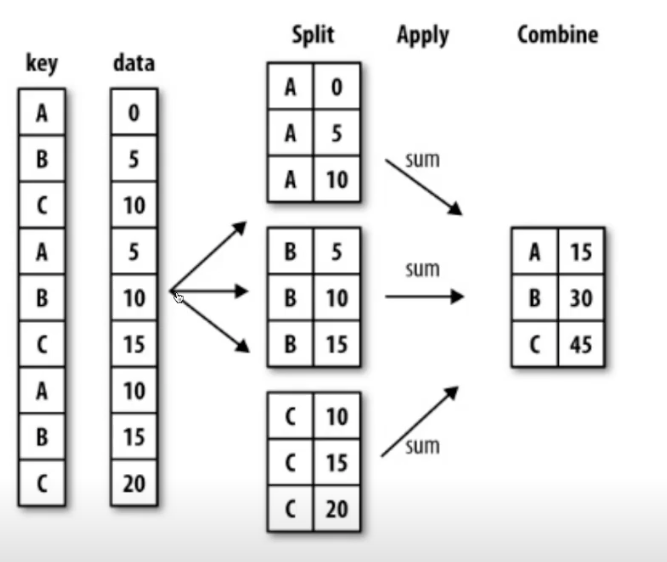
- 문법
- df.groupby("Team")['Point'].sum()
- df 데이터에서 팀별로 점수를 합산해서 구분해라.
import pandas as pd
ipl_data = {'Team': ['Riders', 'Riders', 'Devils', 'Devils', 'Kings',
         'kings', 'Kings', 'Kings', 'Riders', 'Royals', 'Royals', 'Riders'],
         'Rank': [1, 2, 2, 3, 3,4 ,1 ,1,2 , 4,1,2],
         'Year': [2014,2015,2014,2015,2014,2015,2016,2017,2016,2014,2015,2017],
         'Points':[876,789,863,673,741,812,756,788,694,701,804,690]}

df = pd.DataFrame(ipl_data)
df
'''
Team	Rank	Year	Points
0	Riders	1	2014	876
1	Riders	2	2015	789
2	Devils	2	2014	863
3	Devils	3	2015	673
4	Kings	3	2014	741
5	kings	4	2015	812
6	Kings	1	2016	756
7	Kings	1	2017	788
8	Riders	2	2016	694
9	Royals	4	2014	701
10	Royals	1	2015	804
11	Riders	2	2017	690
'''

df.groupby("Team")["Points"].sum()
'''
Team
Devils    1536
Kings     2285
Riders    3049
Royals    1505
kings      812
Name: Points, dtype: int64
'''

df = df.groupby(["Team", "Year"])["Points"].sum()
df
'''
Team    Year
Devils  2014    863
        2015    673
Kings   2014    741
        2016    756
        2017    788
Riders  2014    876
        2015    789
        2016    694
        2017    690
Royals  2014    701
        2015    804
kings   2015    812
Name: Points, dtype: int64
'''- 엑셀의 피벗테이블로도 할 수 있음
Hierarchical index
- 여러 인덱스를 데이터프레임 조회에 넣어서 해당 인덱스들 기준으로 보는 방법
- 위 그룹바이 마지막 예시도 마찬가지
- unstack() : 시리즈는 데이터프레임으로, 데이터프레임은 시리즈로 돌려줌
- reset_index() : 다른 인덱스로 구성된 시리즈나 데이터프레임을 기본인덱스 데이터프레임으로 돌려줌
df2 = df.unstack()
df2

'''
Year	2014	2015	2016	2017
Team
Devils	863.0	673.0	NaN	NaN
Kings	741.0	NaN	756.0	788.0
Riders	876.0	789.0	694.0	690.0
Royals	701.0	804.0	NaN	NaN
kings	NaN	812.0	NaN	NaN
'''

df3 = df.reset_index()
df3
'''
Team	Year	Points
0	Devils	2014	863
1	Devils	2015	673
2	Kings	2014	741
3	Kings	2016	756
4	Kings	2017	788
5	Riders	2014	876
6	Riders	2015	789
7	Riders	2016	694
8	Riders	2017	690
9	Royals	2014	701
10	Royals	2015	804
11	kings	2015	812
'''- swap_level() : 인덱스 순서(계층) 를 바꿔줌
- sort_index() : 인덱스 기준 정렬
- sort_values() : 값 기준 정렬
grouped
- 그룹바이에 의해 스플릿된 상태 추출
- 튜플로 키, 밸류가 엮여서 나옴
- 따로 함수는 아니고 groupby 로 나온 제너레이터 활용하는 방법임
- 타입은 pd.DataFrame.Groupby
grouped = df.groupby("Team")
for gr in grouped:
    print(gr)
'''
('Devils', Team    Year
Devils  2014    863
        2015    673
Name: Points, dtype: int64)
('Kings', Team   Year
Kings  2014    741
       2016    756
       2017    788
Name: Points, dtype: int64)
('Riders', Team    Year
Riders  2014    876
        2015    789
        2016    694
        2017    690
Name: Points, dtype: int64)
('Royals', Team    Year
Royals  2014    701
        2015    804
Name: Points, dtype: int64)
('kings', Team   Year
kings  2015    812
Name: Points, dtype: int64)
'''

for name, group in grouped:
    print(name)
    print(group)
'''
Devils
Team    Year
Devils  2014    863
        2015    673
Name: Points, dtype: int64
Kings
Team   Year
Kings  2014    741
       2016    756
       2017    788
Name: Points, dtype: int64
Riders
Team    Year
Riders  2014    876
        2015    789
        2016    694
        2017    690
Name: Points, dtype: int64
Royals
Team    Year
Royals  2014    701
        2015    804
Name: Points, dtype: int64
kings
Team   Year
kings  2015    812
Name: Points, dtype: int64
'''- grouped.get_group() : 특정 그룹 가져옴
grouped.get_group("Kings")
'''
Team   Year
Kings  2014    741
       2016    756
       2017    788
Name: Points, dtype: int64
'''- grouped 된 상태는 세 가지 유형의 apply 가능
- Aggregation : 요약된 통계정보 추출
grouped.agg(sum)
'''
Team
Devils    1536
Kings     2285
Riders    3049
Royals    1505
kings      812
Name: Points, dtype: int64
'''

# 여러 개도 가능
grouped.agg([sum, np.mean, max])
'''
sum	mean	max
Team
Devils	1536	768.000000	863
Kings	2285	761.666667	788
Riders	3049	762.250000	876
Royals	1505	752.500000	804
kings	812	812.000000	812
'''- Transformation : group 된 데이터에서 해당 함수대로 모든 행에 적용, 그룹 별 연산에서 각각의 값에 영향 주고 싶을 때 사용
score = lambda x: (x - x.mean()) / x.std()
grouped.transform(score)
'''
Rank	Year	Points
0	-1.500000	-1.161895	1.284327
1	0.500000	-0.387298	0.302029
2	-0.707107	-0.707107	0.707107
3	0.707107	0.707107	-0.707107
4	1.154701	-1.091089	-0.860862
5	NaN	NaN	NaN
6	-0.577350	0.218218	-0.236043
7	-0.577350	0.872872	1.096905
8	0.500000	0.387298	-0.770596
9	0.707107	-0.707107	-0.707107
10	-0.707107	0.707107	0.707107
11	0.500000	1.161895	-0.815759
'''- Filteration : 특정 정보 제거해서 보여주는 필터기능
df.groupby('Team').filter(lambda x: x["Points"].max() > 800)
'''
Team	Rank	Year	Points
0	Riders	1	2014	876
1	Riders	2	2015	789
2	Devils	2	2014	863
3	Devils	3	2015	673
5	kings	4	2015	812
8	Riders	2	2016	694
9	Royals	4	2014	701
10	Royals	1	2015	804
11	Riders	2	2017	690
'''
컬럼의 데이터 타입 바꾸기
- apply 사용
import dateutil

df_phone = pd.read_csv("./data/phone_data.csv")
df_phone.head()
'''
index	date	duration	item	month	network	network_type
0	0	15/10/14 06:58	34.429	data	2014-11	data	data
1	1	15/10/14 06:58	13.000	call	2014-11	Vodafone	mobile
2	2	15/10/14 14:46	23.000	call	2014-11	Meteor	mobile
3	3	15/10/14 14:48	4.000	call	2014-11	Tesco	mobile
4	4	15/10/14 17:27	4.000	call	2014-11	Tesco	mobile
'''

df_phone["date"] = df_phone["date"].apply(dateutil.parser.parse, dayfirst=True)
df_phone.dtypes
'''
index                    int64
date            datetime64[ns]
duration               float64
item                    object
month                   object
network                 object
network_type            object
dtype: object
'''
plot
- matplotlib 설치
- !conda install - - y matplotlib
- DF 나 시리즈 뒤에 .plot() 해주면 그림 나옴, 따로 임포트 안해도 됨
Pivot Table
- 엑셀의 기능과 같음
- index 축은 groupby 와 동일
- column 에 추가로 라벨링 값 추가하여 value 에 numeric 타입 값을 aggregation 하는 형태
df_phone.pivot_table(
    values=["duration"],
    index=[df_phone.month, df_phone.item],
    columns=df_phone.network,
    aggfunc="sum",
    fill_value=0,
)
'''
duration
network	Meteor	Tesco	Three	Vodafone	data	landline	special	voicemail	world
month	item
2014-11	call	1521	4045	12458	4316	0.000	2906	0	301	0
data	0	0	0	0	998.441	0	0	0	0
sms	10	3	25	55	0.000	0	1	0	0
2014-12	call	2010	1819	6316	1302	0.000	1424	0	690	0
data	0	0	0	0	1032.870	0	0	0	0
sms	12	1	13	18	0.000	0	0	0	4
2015-01	call	2207	2904	6445	3626	0.000	1603	0	285	0
data	0	0	0	0	1067.299	0	0	0	0
sms	10	3	33	40	0.000	0	0	0	0
2015-02	call	1188	4087	6279	1864	0.000	730	0	268	0
data	0	0	0	0	1067.299	0	0	0	0
sms	1	2	11	23	0.000	0	2	0	0
2015-03	call	274	973	4966	3513	0.000	11770	0	231	0
data	0	0	0	0	998.441	0	0	0	0
sms	0	4	5	13	0.000	0	0	0	3
'''

# groupby 로 구현
df_phone.groupby(["month", "item", "network"])["duration"].sum().unstack()
'''
network	Meteor	Tesco	Three	Vodafone	data	landline	special	voicemail	world
month	item
2014-11	call	1521.0	4045.0	12458.0	4316.0	NaN	2906.0	NaN	301.0	NaN
data	NaN	NaN	NaN	NaN	998.441	NaN	NaN	NaN	NaN
sms	10.0	3.0	25.0	55.0	NaN	NaN	1.0	NaN	NaN
2014-12	call	2010.0	1819.0	6316.0	1302.0	NaN	1424.0	NaN	690.0	NaN
data	NaN	NaN	NaN	NaN	1032.870	NaN	NaN	NaN	NaN
sms	12.0	1.0	13.0	18.0	NaN	NaN	NaN	NaN	4.0
2015-01	call	2207.0	2904.0	6445.0	3626.0	NaN	1603.0	NaN	285.0	NaN
data	NaN	NaN	NaN	NaN	1067.299	NaN	NaN	NaN	NaN
sms	10.0	3.0	33.0	40.0	NaN	NaN	NaN	NaN	NaN
2015-02	call	1188.0	4087.0	6279.0	1864.0	NaN	730.0	NaN	268.0	NaN
data	NaN	NaN	NaN	NaN	1067.299	NaN	NaN	NaN	NaN
sms	1.0	2.0	11.0	23.0	NaN	NaN	2.0	NaN	NaN
2015-03	call	274.0	973.0	4966.0	3513.0	NaN	11770.0	NaN	231.0	NaN
data	NaN	NaN	NaN	NaN	998.441	NaN	NaN	NaN	NaN
sms	NaN	4.0	5.0	13.0	NaN	NaN	NaN	NaN	3.0
'''
Crosstab
- 피벗테이블과 거의 동일
- 네트워크 데이터 (a 와 b 가 상관 있음) 에 사용하면 편함
- 인덱스, 컬럼, 벨류, 어그리게이션 세팅 하면됨
→ groupby, pivot_table, crosstab 다 가능
merge & concat
merge (join 과 같음)
- sql 에서 많이 사용하는 merge 와 같은 기능
- 두 개의 테이블을 하나로 합침
- 기준이 있어야함
- pd.merge(df_a, df_b, on='subject_id') # 두 테이블을 subject_id 를 기준으로 합침
- 두 테이블에서 컬럼명이 다를 때는 left_on 과 right_on 따로 적어주면 됨
- join method
- inner join : 겹치는 내용만 보여줌
- full join : 모든 내용 다 합쳐서 보여줌
- left join : 왼쪽 모든 내용 + 오른쪽 겹치는 내용 보여줌
- right join : left join 반대
- 없는 값은 NaN 으로 채워짐
- merge(~~, how="inner") 로 적어주면 됨, 기본은 inner
concat
- 컬럼을 더 넓히는게 아니라 데이터 양을 더 넓힘 (세로로) → 같은 컬럼을 갖고 있어야함
- axis=1 하면 옆으로 붙음
- pd.concat([df_a, df_b])
=> 여러 엑셀 파일들 합치고 필요한 정보 뽑을 때 groupby merge concat 등등 쓰면 유용
Persistance
DB 연결
sqlite3
- 로컬 디비
- import sqlite3 해서 써도 됨
- 원격 되는 mysql 등 써도 됨
엑셀 작성기
- !conda install —y XlsxWriter
- df_routes 사용가능
- writer = pd.ExcelWriter(...) 쓰고 df_routes.to_excel(writer, sheet_name="my_data") 하면 작성가능
- df_routes.to_pickle 가능
참조
BoostCamp AI Tech

데이터로 문제를 해결하는 엔지니어를 꿈꿉니다.