1. 의사결정나무 개념
1) 분류와 회귀 둘 다 사용 가능하다.
- 분류 : from sklearn.tree import DecisionTreeClassifier
- 회귀 : from sklearn.tree import DecisionTreeRegressor
- 2) Root Node : 시작 노드 // Terminal Node : 끝 마디(=Leaf Node) // Depth : 깊이 // 불순도 : 지니 불순도
- 3) 분류에서는 불순도(지니지수)를 측정하고 // 회귀에서는 MSE를 측정한다.
- 4) 가지가 내려갈수록 root node의 불순도 보다 terminal node의 가중평균 불순도가 더 낮아진다.
- 5) 정보 이득(gain) = 부모의 불순도 - 자식의 불순도 = 정보 이득이 크다는 의미는 불순도가 내려가고 있다를 의미한다.
- 6) depth가 커지게 되면 과대적합이 발생한다. 또한, 깊이를 지정하지 않으면 제한이 없기 때문에, 파라미터(max_depth)를 통해 depth를 조절하여 적절한 가지치기를 한다.
- 7) 주요 파라미터
- max_depth : 트리의 최대 깊이(확실한 가지치기)
- min_samples_split : 노드를 분할하기 위한 최소한의 샘플 개수(디폴트:2)
- min_samples_leaf : 리프 노드(terminal node)가 되기 위한 최소한의 샘플 수(디폴트:1)
- 8) model.featureimportances 를 확인하고, 변수 중요도 시각화 작업을 해야한다.
ex)
**1. 모델링**
-------------
# 불러오기
from sklearn.tree import DecisionTreeClassifier
from sklearn.metrics import counfusion_matrix, classification_report
-------------
# 선언하기
model = DecisionTreeClassifier(random_state=1, max_depth=7)
-------------
# 학습하기
model.fit(x_train, y_train)
-------------
# 예측하기
y_pred = model.predict(x_test)
-------------
# 평가하기
print(confusion_matrix(y_test, y_pred))
print(classification_report(y_test, y_pred))
-------------
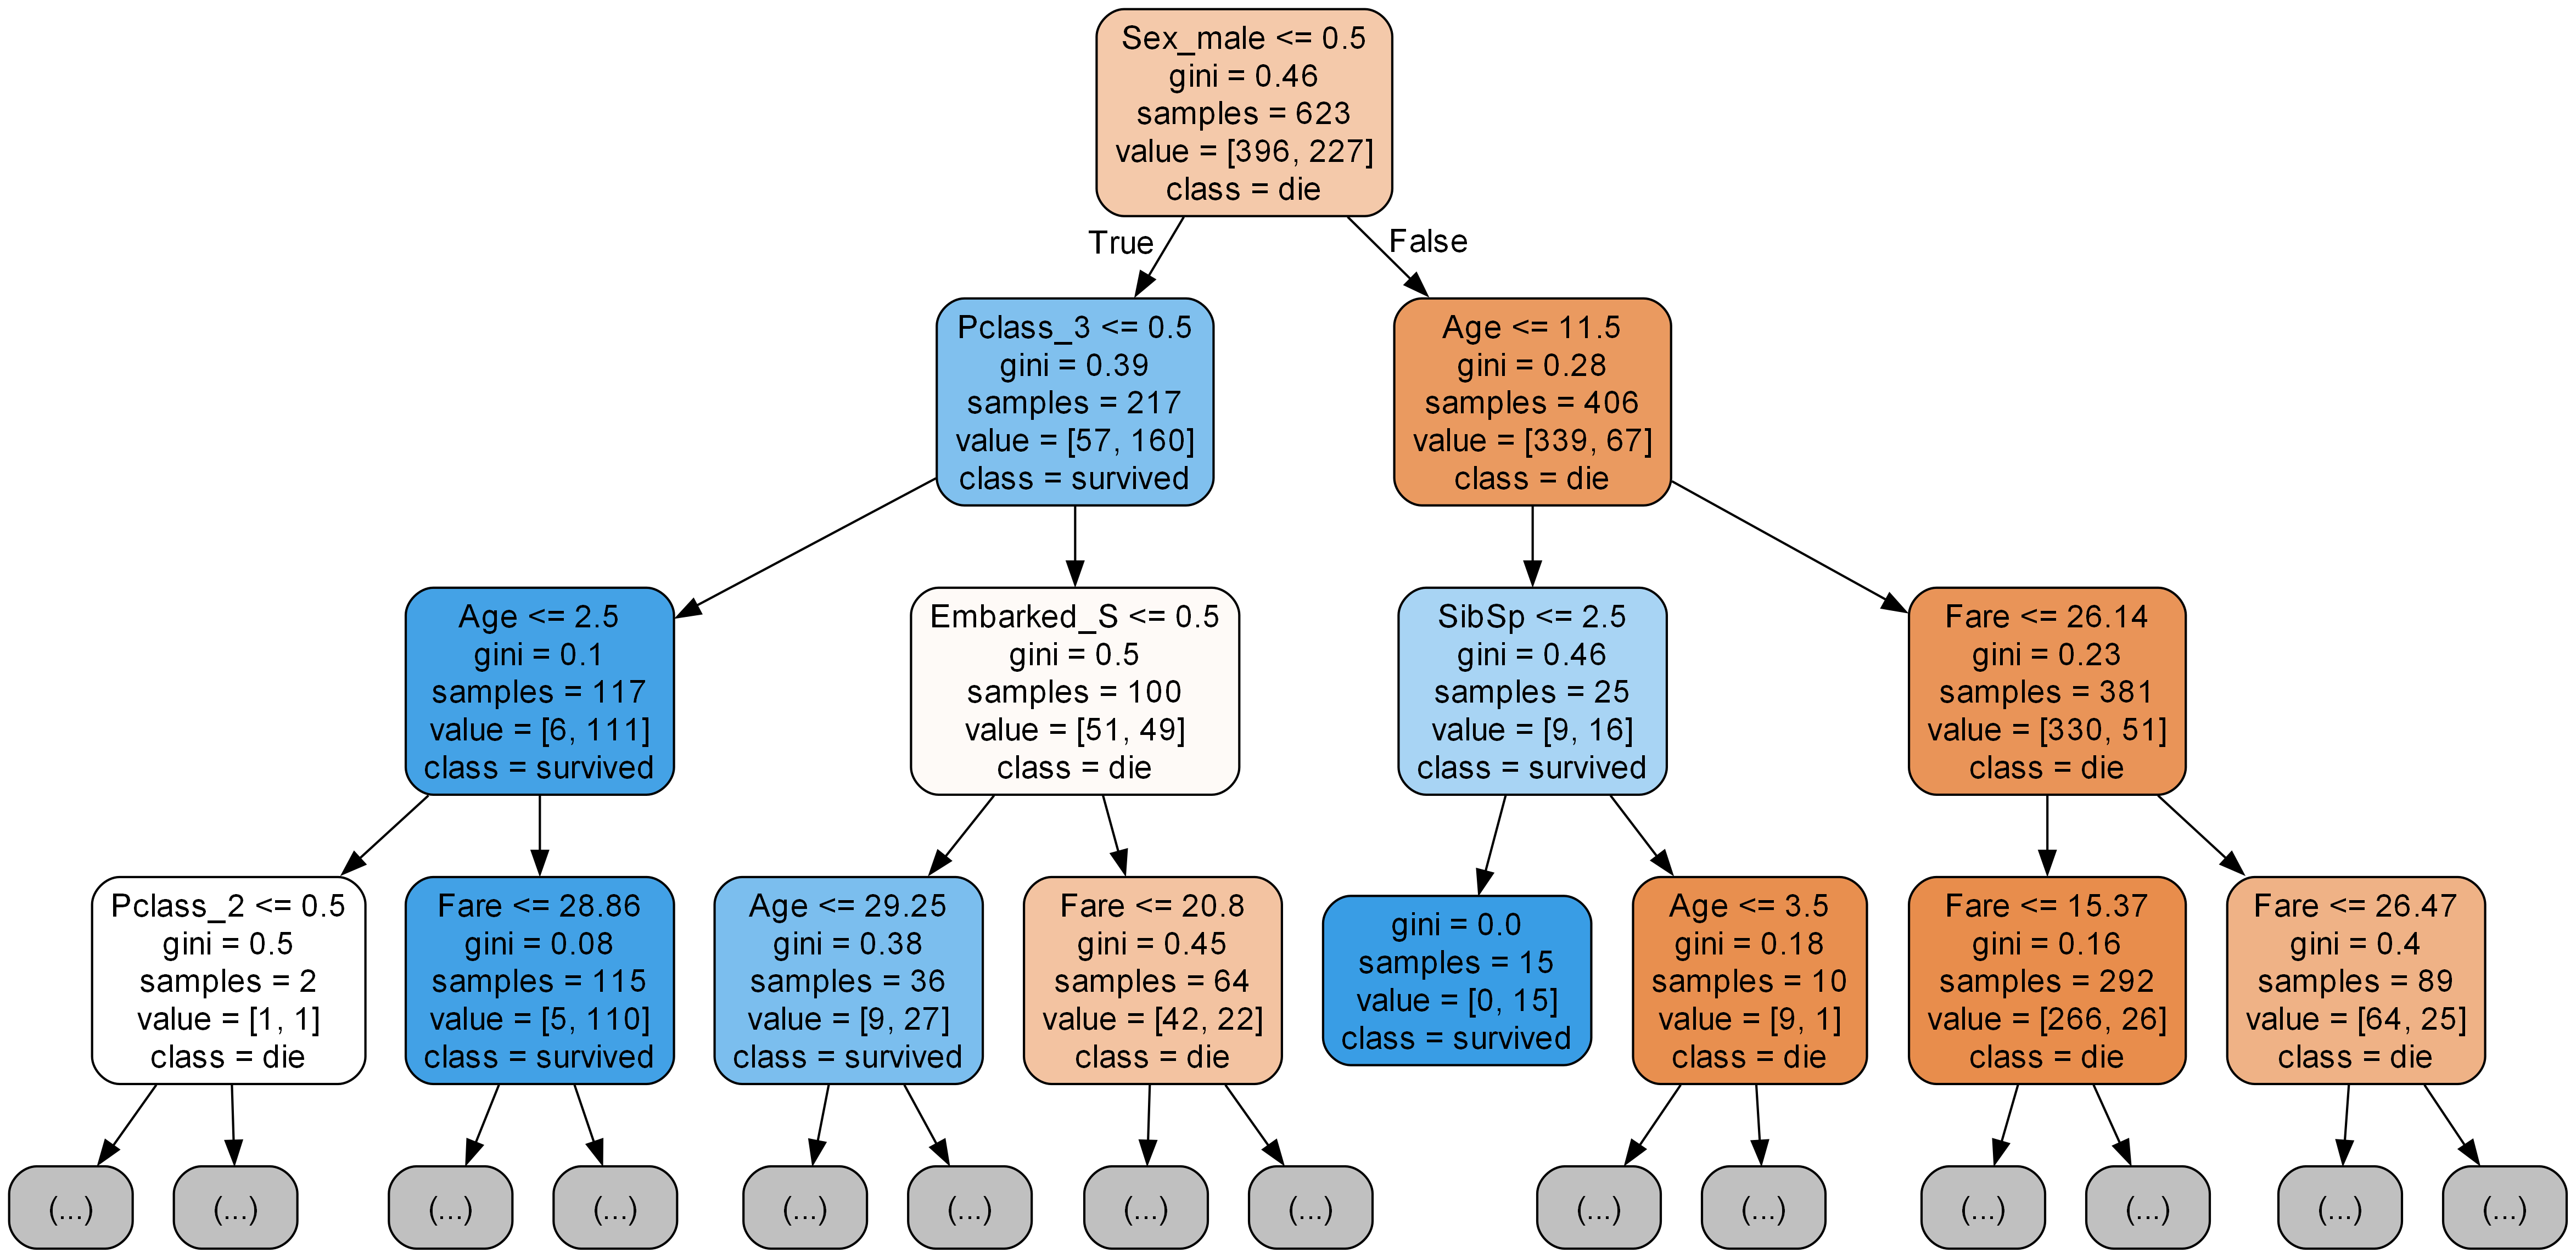
**2. 트리 시각화**
-------------
# 시각화 모듈 불러오기
from sklearn.tree import export_graphviz
from IPython.display import Image
-------------
# 이미지 파일 만들기
export_graphviz(model,                            # 모델 이름
				out_file='tree.dot',              # 파일 이름
                feature=list(x),                  # feature 이름
                class_name=['die','survived'],    # class_name은 분류 문제일 때만 사용한다. 그리고 0에 해당하는 값을 먼저 써야 됨. 순서가 중요하다.
                rounded=True,                     # 둥근 테두리
                precision=2,                      # 불순도 소수점
                max_depth=3,                      # 보여주는 트리 깊이 이미지
                filled=True,)                     # 박스 내부 색 채우기
-------------
# 파일 변환
!dot tree.dot -Tpng -otree.png -Gdpi=300
-------------
# 이미지 파일 표시
Image(filename='tree.png')
<출력>
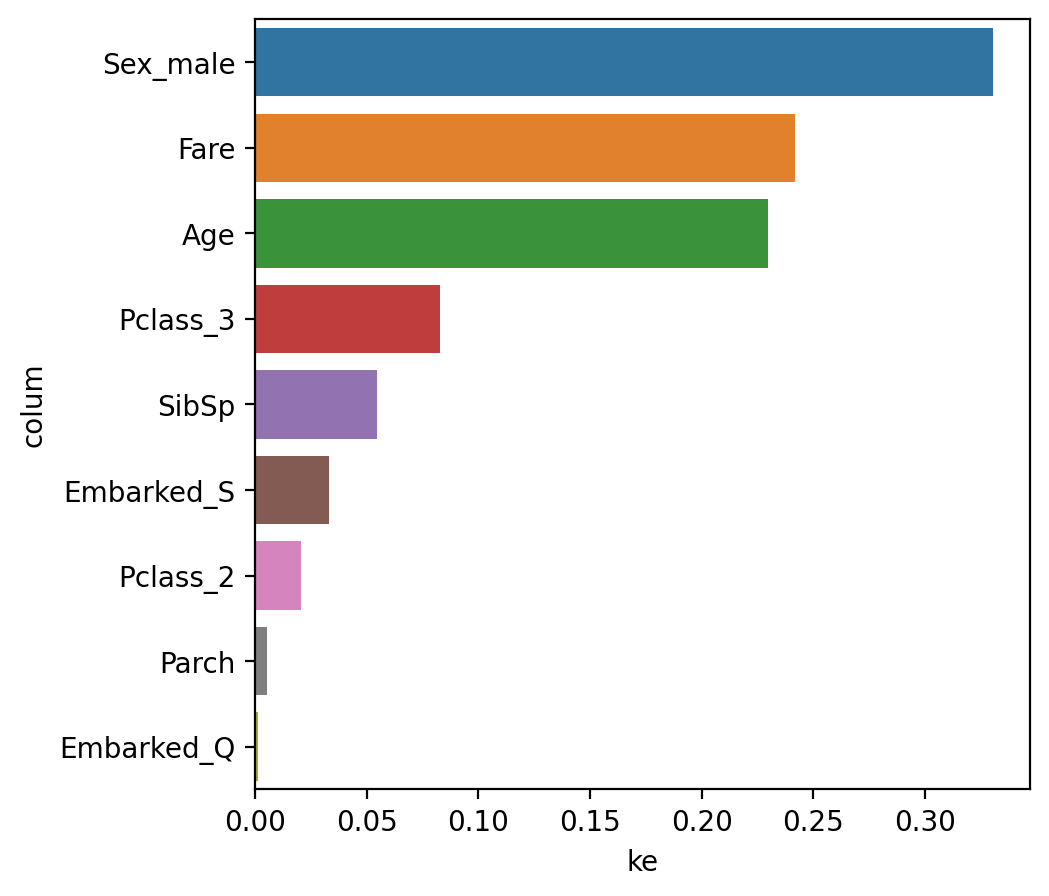
**3. 변수 중요도 시각화**
print(list(x))
print(model.feature_importance_)     # 변수 중요도, 중요도가 크면 정보이득이 크다는 의미.
<출력>
['Age', 'SibSp', 'Parch', 'Fare', 'Pclass_2', 'Pclass_3', 'Sex_male', 'Embarked_Q', 'Embarked_S']
[0.22951489 0.0545964  0.00534802 0.24163176 0.02072298 0.0830393, 0.33027867 0.00146473 0.03340326]
-------------
# 시각화
df = pd.DataFrame()
df['colum'] = list(x)
df['importance'] = model.feature_importances_
df.sort_values(by='importance', ascending=False)

sns.barplot(x='importance', y ='list', data = df)
<출력>
- maxdepth의 값이 크면, 다른 변수들의 importances도 커진다.

큐브가 필요하다...!!!