시작하기
Step 1. node-exporter 실행
node-exporter 는 호스트의 시스템 메트릭을 수집하는 툴이다 보니 설정할게 좀 있다.
따라서 docker-compose로 실행하는게 편하다.
services:
  node-exporter:
    image: prom/node-exporter:latest
    container_name: node-exporter
    restart: unless-stopped
    volumes:
      - /proc:/host/proc:ro
      - /sys:/host/sys:ro
      - /:/rootfs:ro
    command:
      - '--path.procfs=/host/proc'
      - '--path.rootfs=/rootfs'
      - '--path.sysfs=/host/sys'
      - '--collector.filesystem.mount-points-exclude=^/(sys|proc|dev|host|etc)($$|/)'
    ports:
      - 9100:9100
Step 2. Prometheus 수집
global:
  scrape_interval: 10s
  scrape_timeout: 10s
  evaluation_interval: 2m

scrape_configs:
  - job_name: 'System'
      scrape_interval: 10s
      scrape_timeout: 10s
      metrics_path: '/metrics'
      scheme: 'http'
      static_configs:
        - targets: ['*.*.*.*:9100']
          labels:
            service: 'system'
Step 3. Grafana 연동
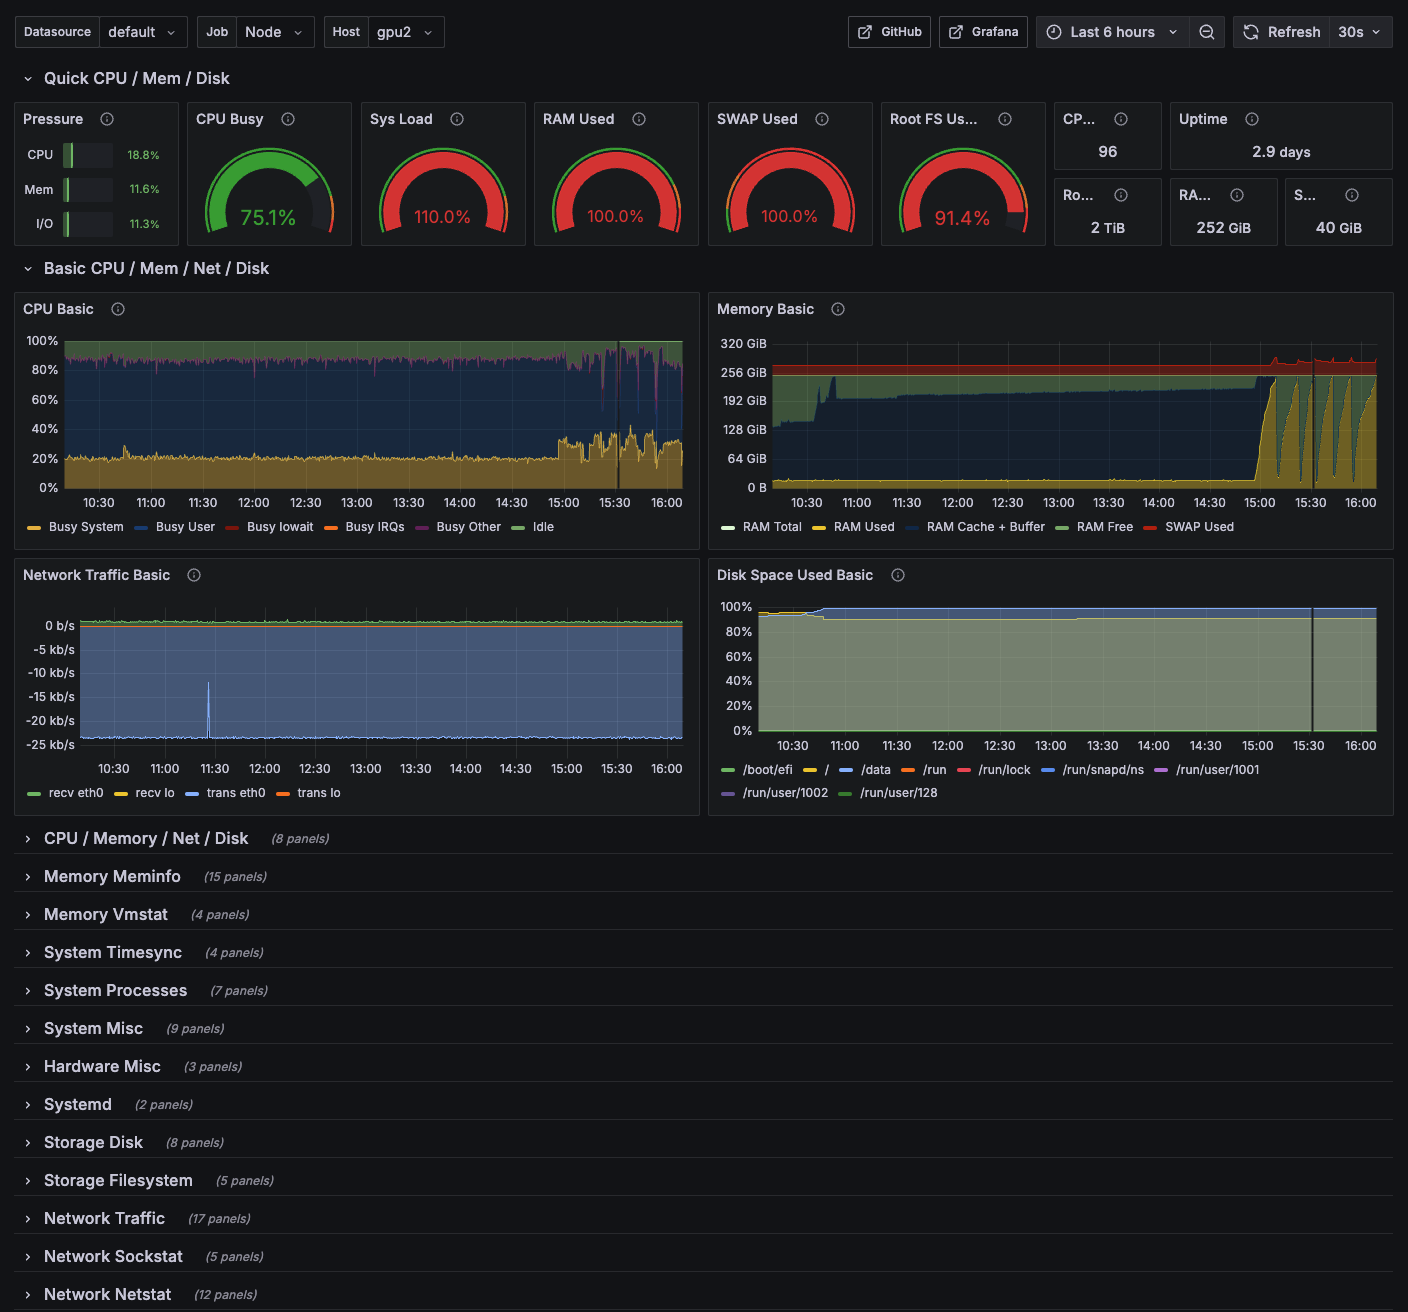
https://grafana.com/grafana/dashboards/1860-node-exporter-full/
Reference

🖥️