
시작하기
Step 1. django-prometheus 앱 추가
먼저 django-prometheus 라이브러리를 설치한다.
$ pip install django-prometheus# settings.py
INSTALLED_APPS = [
...
'django_prometheus',
...
]
MIDDLEWARE = [
'django_prometheus.middleware.PrometheusBeforeMiddleware',
# All your other middlewares go here, including the default
# middlewares like SessionMiddleware, CommonMiddleware,
# CsrfViewmiddleware, SecurityMiddleware, etc.
'django_prometheus.middleware.PrometheusAfterMiddleware',
]# urls.py
urlpatterns = [
...
path('', include('django_prometheus.urls')),
]위와 같이 아주 간단히 django-prometheus 앱 추가만으로도 서비스의 전반적인 상태를 파악할 수 있는 메트릭을 제공해준다.
Step 2. [Optional] Add more metrics
기본적인 요청/응답 상태 및 처리시간 외에도 추가적으로 DB, Cache 등의 메트릭도 간단하게 추가할 수 있다.
Monitoring your databases
# settings.py

DATABASES = {
    'default': {
        'ENGINE': 'django_prometheus.db.backends.sqlite3',
        'NAME': os.path.join(BASE_DIR, 'db.sqlite3'),
    },
}
Monitoring your caches
# settings.py

CACHES = {
    'default': {
        'BACKEND': 'django_prometheus.cache.backends.filebased.FileBasedCache',
        'LOCATION': '/var/tmp/django_cache',
    }
}
Monitoring your models
from django_prometheus.models import ExportModelOperationsMixin

class Dog(ExportModelOperationsMixin('dog'), models.Model):
    name = models.CharField(max_length=100, unique=True)
    breed = models.CharField(max_length=100, blank=True, null=True)
    age = models.PositiveIntegerField(blank=True, null=True)
Step 3. [Optional] Add your own metrics
만약 해당 패키지에서 수집하지 않는 메트릭이 필요하다면 아래 방법으로 추가할 수 있다.
Custom metric 추가
# metrics.py

from prometheus_client import Gauge

from django.core.cache import cache


binance_api_usage = Gauge(
    "binance_api_used_weight_1m",
    "Current Binance API usage in the last 1 minute",
)


def update_binance_api_usage():
    """Redis에서 Binance API 사용량을 가져와 Prometheus 메트릭을 업데이트"""
    try:
        usage = cache.get("rate_limit:binance:used_weight_1m")  # Redis에서 값 가져오기
        if usage:
            binance_api_usage.set(int(usage))  # Prometheus 메트릭 업데이트
    except Exception as e:
        print(f"Error fetching Binance API usage from Redis: {e}")
# views.py
from django_prometheus.exports import ExportToDjangoView
from config.metrics import update_binance_api_usage
def CustomMetricsView(request):
"""
Prometheus `/metrics/` 엔드포인트를 위한 Django 뷰.
Redis에서 값을 가져와 Prometheus 메트릭을 업데이트한 후 기존 ExportToDjangoView 호출.
"""
# Redis에서 최신 데이터를 가져와 Prometheus에 반영
update_binance_api_usage()
return ExportToDjangoView(request)# urls.py
from django.urls import path
from config.views import CustomMetricsView
urlpatterns = [
path("metrics/", CustomMetricsView, name="metrics"),
]Step 4. Prometheus 수집
global:
scrape_interval: 10s
scrape_timeout: 10s
evaluation_interval: 2m
scrape_configs:
- job_name: 'Django'
metrics_path: '/metrics'
scheme: 'http'
static_configs:
- targets: ['*.*.*.*']
labels:
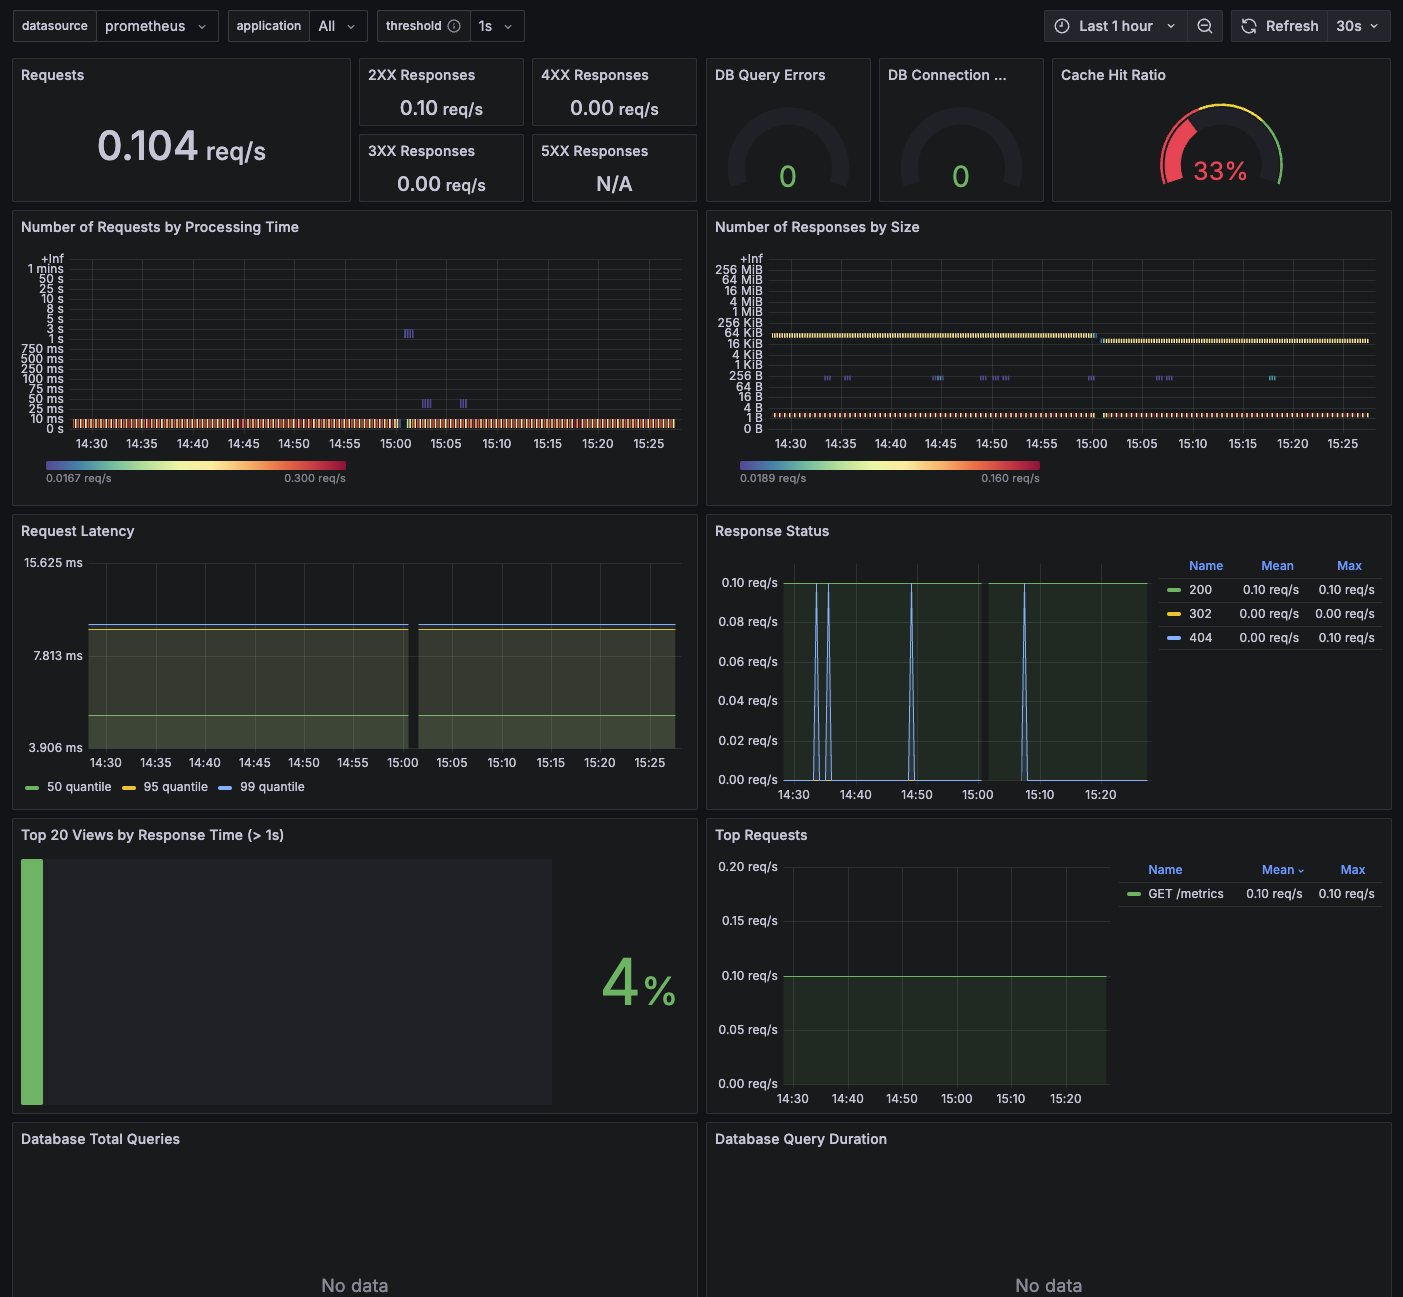
service: 'django'Step 5. Grafana 연동
https://grafana.com/grafana/dashboards/17658-django/
Reference

🖥️