Probability Theory
Mathematical framework for representing uncertain statements.
Sources of Uncertainty
1) Inherent stochasticity
2) Incomplete observability
3) Incomplete modeling
Two Types of Probability
1) Frequentist Probability - rates at which events occur, where the experiment is replicable
2) Bayesian Probability - qualitative levels of certainty, which can be represented as degree of belief
Random Variable
A variable that can take on different values randomly.
Random variables may be discrete or continuous.
A discrete random variable has a countable number of states.It is not always numerical.
A continuous random variable has real numerical value.
Probability Distribution
A description of how likely a random variable or a set of random variables is to take on each of its possible states.
Probability Mass Function (PMF)
A probability distribution over discrete variables
It is denoted as P(x), P(X=x)
- The domain of P must be the set of all possible states of X
- For all x in X, 0<= P(x) <= 1
- Sum of P(x) for all x in X equals 1
- In case of uniform distribution function where K equals to number of possible states of X, P(x) = 1/K
Probability Density Function (PDF)
A probability distribution over continuous variables
It is denoted as p(x)
- The domain of p must be the set of all possible states of X
- For all x in X, 0<= P(x)
- Integral of p(x) equals 1
- In case of uniform distribution function, the probability that x lies in interval [a,b] equals 1/(b-a)
Joint Probability Distribution
A probability distribution over many variables
It is denoted as P(X=x, Y=y), P(x,y)
Marginal Probability Distribution
A probability distribution over a subset of variables
For discrete random variables x and y, we can find P(x) with sum rule
-> for all x in X, P(X=x) equals sum of P(x,y) for all y
For continuous variables x and y, we can find p(x,y) with integration
-> for all x in X, p(x) equals integral of p(x,y) respect to y
Conditional Probability and Bayes' Rule
A probability of Y given X=x
It is denoted as P(Y=y|X=x)
P(Y=y|X=x) equals P(Y=y,X=x)/P(X=x)
Chain Rule of Conditional Probabilities
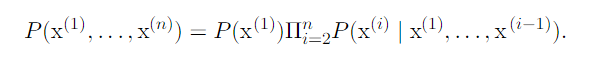
This is derived from P(Y=y|X=x) = P(Y=y,X=x)/P(X=x)
EX) P(a,b,c) = P(a|b,c) P(b,c)
P(b,c) = P(b|c) P(c)
-> P(a,b,c) = P(a|b,c) P(b|c) P(c)
Bayes' Rule
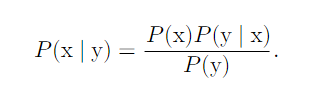
P(y) can be computed with sum rule.
Independence and Conditional Independence
- Two random variables X and Y are independent if
p(X=x,Y=y) = p(X=x) * p(Y=y)
- Two random variables X and Y are conditionally independent if
p(X=x,Y=y|Z=z) = p(X=x|Z=z) * p(Y=y|Z=z)
Expectation, Variance and Covariance
Expectation
The expectation, also called expected value, of some function f(x) with respect to a probability distribution P(X) is the mean value that f takes on when x is drawn from P.
It is denoted as E(X)
- E[f(x)] = summation of P(x)f(x) for all x in X "Discrete
- E[f(x)] = integral of p(x)f(x) respect to x "Continuous
- Expectations are linear
-> E[af(x)+bg(x)] = aE[f(x)] + bE[g(x)]
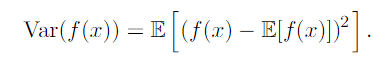
Variance
A measure of how much the values of a function of a random variable x vary as we sample different values of x from its probability distribution
Standard Deviation
The square root of the variance
Covariance
A measure of how much variables tend to deviate from their expected values and direction of linear relationship between two continuous vairables.

- Positive covariance means the variables are positively related and vice versa
- Two independent variables have zero covariance and two variable that have nonzero covariance are dependent.
- Zero covariance does not mean that the variables are independent from each other because there may be dependency which is not linear.
Correlation
A measure of the strength and direction of a linear relationship between two continuous variables.
- Correlation is scaled form of the covariance and thus better for comparison