Now, it's time to backtest!
There's a very convinient library called backtrader that provides you key indicators and plotting tools.
First, I created a SmaAmaStrategy class and wrote code that tells you when to buy and sell. I calculated the simple moving average for the 50 day windows and 200 days windows with this code:
self.sma50  = bt.indicators.Mean(self.data.close, period=50)
self.sma200 = bt.indicators.Mean(self.data.close, period=200)
Then, I wrote a function called, "next" that actually buys and sells the stocks:
def next(self):
        if not self.position:
            if self.sma50 > self.sma200:
                self.buy(size=50)
        else:
            if self.sma200 > self.sma50:
                self.sell(size=50)
- This is basically implementing a "Golden-cross & Death-Cross" Strategy where we buy when SMA50 is greater than SMA200 and vice versa.
- Again, "Golden-cross & Death-Cross" Strategy is a bullish signal in which a relatively short-term moving average crosses above a long-term moving average.
Starting with the seed money of $10,000, this strategy returned a profit of $8167.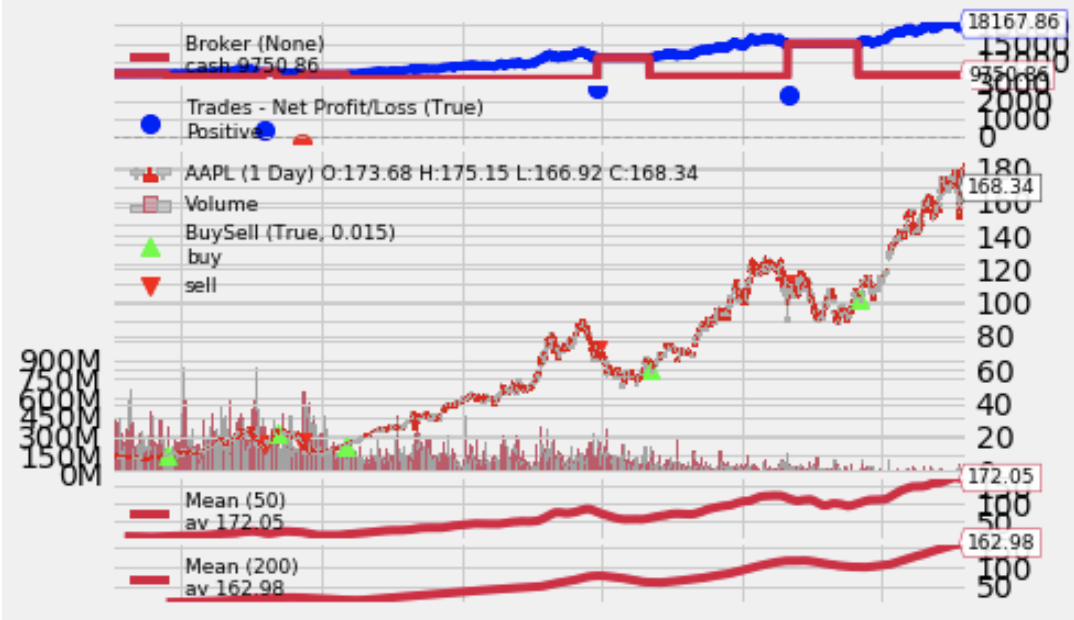
I wanted to implement a betterstrategy to SMA, and I decided to use an indicator called "AMA", which stands for "Adaptive Moving Average".
Wait, what is AMA? and why is better than SMA?
- AMA is very useful because it identifies the general trend of current market price action. When the KAMA indicator line is moving lower, it indicates the existence of a downtrend. When the KAMA line is moving higher, it shows an uptrend.
- The fatal weakness of SMA is that when used for trading signals, they tend to generate many false signals.
- As compared to the Simple Moving Average, the KAMA indicator is less likely to generate false signals that may cause a trader to incur losses.
- So, AMA filters out “market noise” by generateing fewer false signals – by not responding to short-term, insignificant price movements.
self.ama14 = bt.indicators.KAMA(self.data.close, period=14)
self.ama50 = bt.indicators.KAMA(self.data.close, period=50)
- I used a smaller window for AMA as it was conventional to use a 2-week period for smaller window and 50 days period for a bigger window.
Generally, we say the market is bullish When the price is greater than KAMA and KAMA is up. And, the market is bearish when the price is less than KAMA and KAMA is down, the short position is opened.
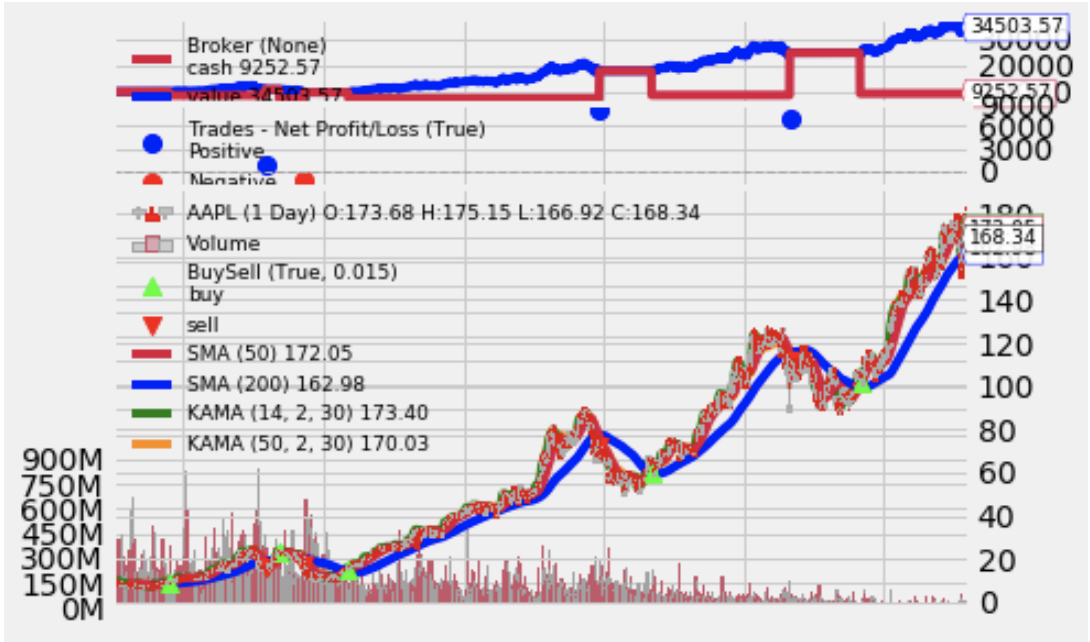
So, I added a nested if-statement to buy more stocks when both SMA50 and AMA14 are greater than the longer period averages. I bought even more shares when AMA14 was greater than AMA50 because then, I was confident this is a bull-signal.
    def next(self):
        if not self.position:
            if self.sma50 > self.sma200:
                self.buy(size=50)
                if self.ama14 > price and self.ama14 > self.ama50:
                    self.buy(size=100)
        else:
            if self.sma200 > self.sma50:
                self.sell(size=50)
                if self.ama14 < price and self.ama14 < self.ama50:
                    self.sell(size=100)
Fortunately, this returned the profit of $24,503 which is more than 3 times of the original profit.
Full Code:
from datetime import datetime
import backtrader as bt

class SmaAmaStrategy(bt.Strategy):
    def __init__(self):
        self.sma50  = bt.indicators.SMA(self.data.close, period=50)
        self.sma200 = bt.indicators.SMA(self.data.close, period=200)
        self.ama14 = bt.indicators.KAMA(self.data.close, period=14)
        self.ama50 = bt.indicators.KAMA(self.data.close, period=50)

    def next(self):
        if not self.position:
            if self.sma50 > self.sma200:
                self.buy(size=50)
                if self.ama14 > price and self.ama14 > self.ama50:
                    self.buy(size=100)
        else:
            if self.sma200 > self.sma50:
                self.sell(size=50)
                if self.ama14 < price and self.ama14 < self.ama50:
                    self.sell(size=100)

startcash = 10000
cerebro = bt.Cerebro()
cerebro.addstrategy(FirstStrategy)
aapl_data = bt.feeds.Quandl(
    dataname="AAPL",
    fromdate=datetime(2006,1,1),
    todate = datetime(2020,10,20),
    buffered=True)

cerebro.adddata(aapl_data)
cerebro.broker.setcash(startcash)
cerebro.run()
portvalue = cerebro.broker.getvalue()
pnl = portvalue - startcash

print('Final Portfolio Value: ${}'.format(portvalue))
print('P/L: ${}'.format(pnl))
cerebro.plot(style='candlestick')
Next time, I'm gonna be calculating the AMA by hand in the python file that I wrote in the previous post!
Thanks for reading :)

I'm a Junior studying Economics and Computer Science at Vanderbilt University.
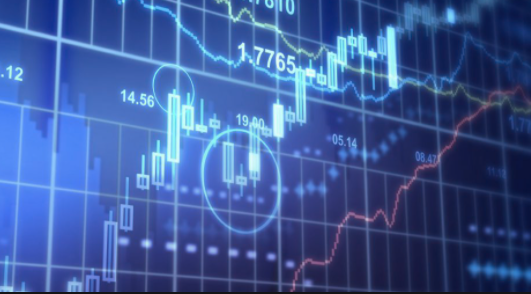
This is something I don’t get at all. Even though forex trading’s been around for a long time, I only recently decided to give it a shot. Yeah, I’ve got some issues with decision-making speed. So I figured I’d start with the theory, and especially with the psychology of trading https://brokersinsider.net/ebooks-psychology-of-trading/ . After all, trading and investing are all about risk, and if I have problems with self-control, nothing good is gonna come from this.