The Statistics of Algotrading
VIX (Cboe Volatility Index)
- A real-time market index that represents the market's expectation of 30-day forward-looking volatility.
- Tracks volatility of the S&P 500 using weighted average of out of the money puts and calls.
- It provides a measure of market risk and investors' sentiments.
- High VIX = high volatility
- Low VIX = low volatility
- Very complicated formula
- High volumes "USUALLY BUT NOT ALWAYS" corrleate with high volatility.
Exponential Moving Average
- Longer Lookback = Smoother Curve
- Smoother Curve = Less reactive to momentum movement signals.
- If the graph is choppy, you need to stay close to the graph.
- The choppier the graph and the larger the movements, the shorter the lookback periods there should be.
- If you're smoothing too much, you're gonna miss a lot of movements.
Example of EMA in graphs.
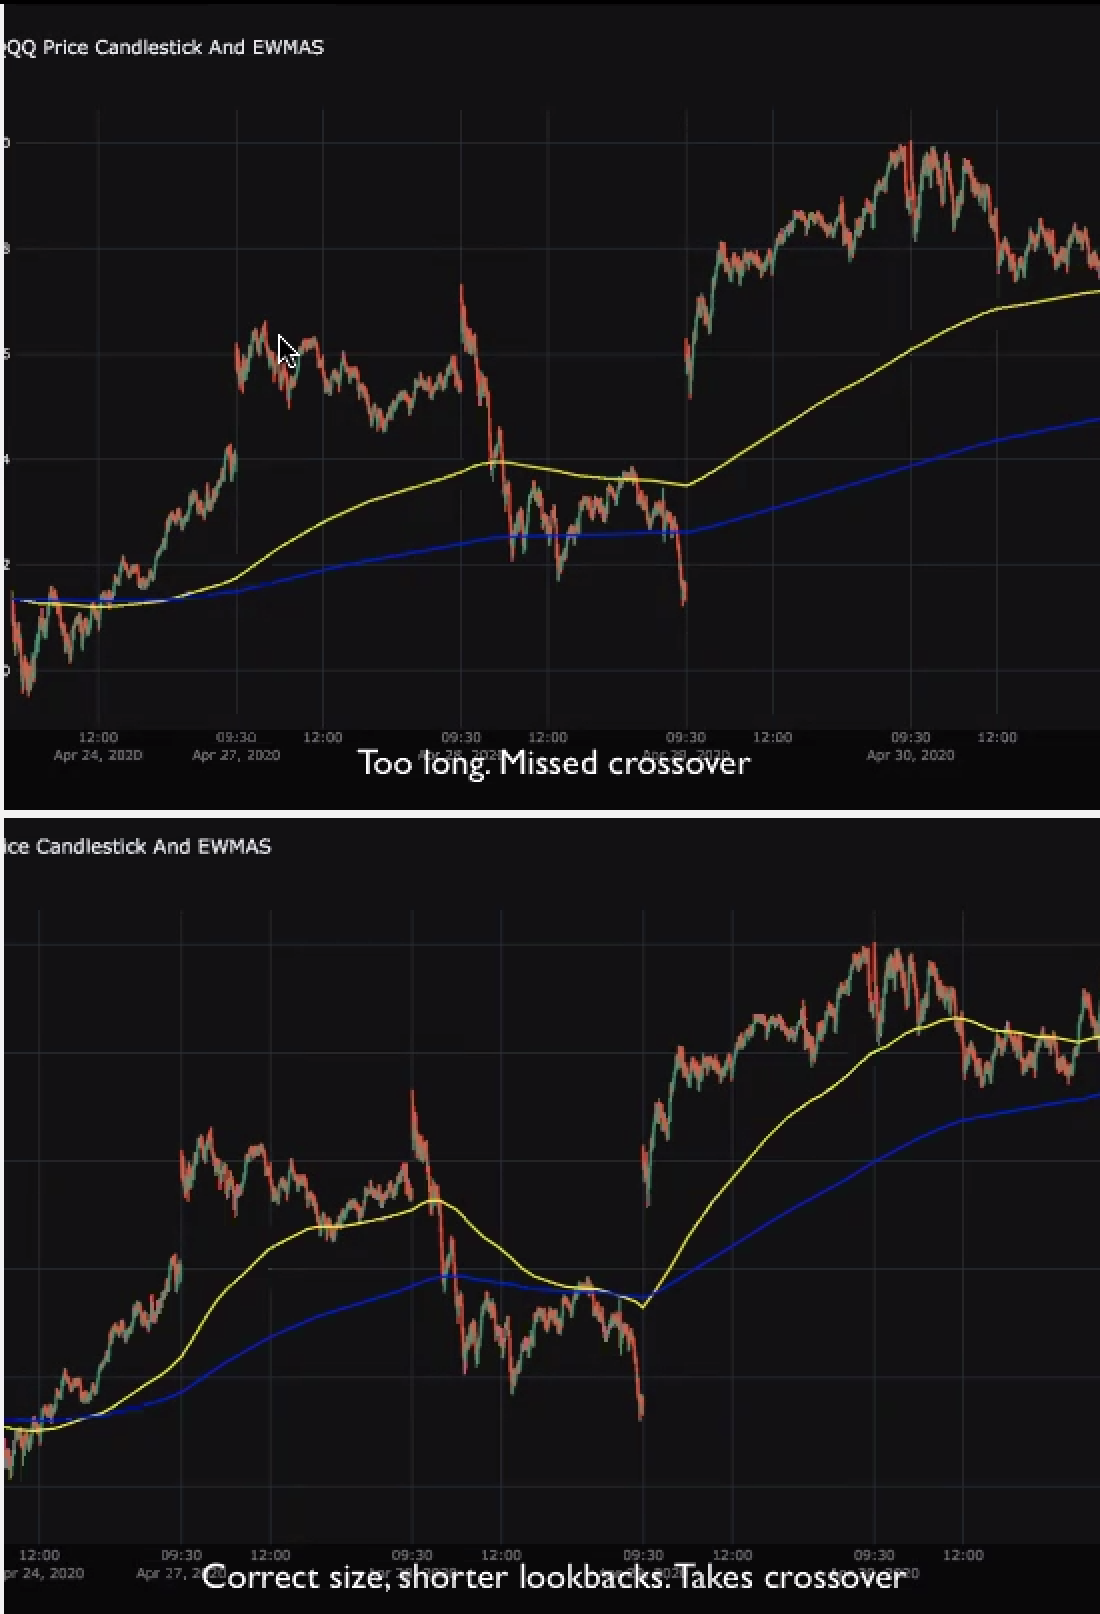
- This graph above is very choppy, which means high VIX.
- Again, olden Cross & Death Cross
- BUY = Short Moving Average > Longer Moving Average.
- Higher VIX (AKA Higher Volatality) = shorter lookbacks
- Lower VIX (AKA Lower Volatility) = longer lookbacks.
- Therefore, we conclude that the bottom graph is much more useful because the yellow trendline, which is a shorter lookbacks, reflect on the volatility much more than the smoother trendlines of the top graph.
Raw Indicators vs. Technical Indicators
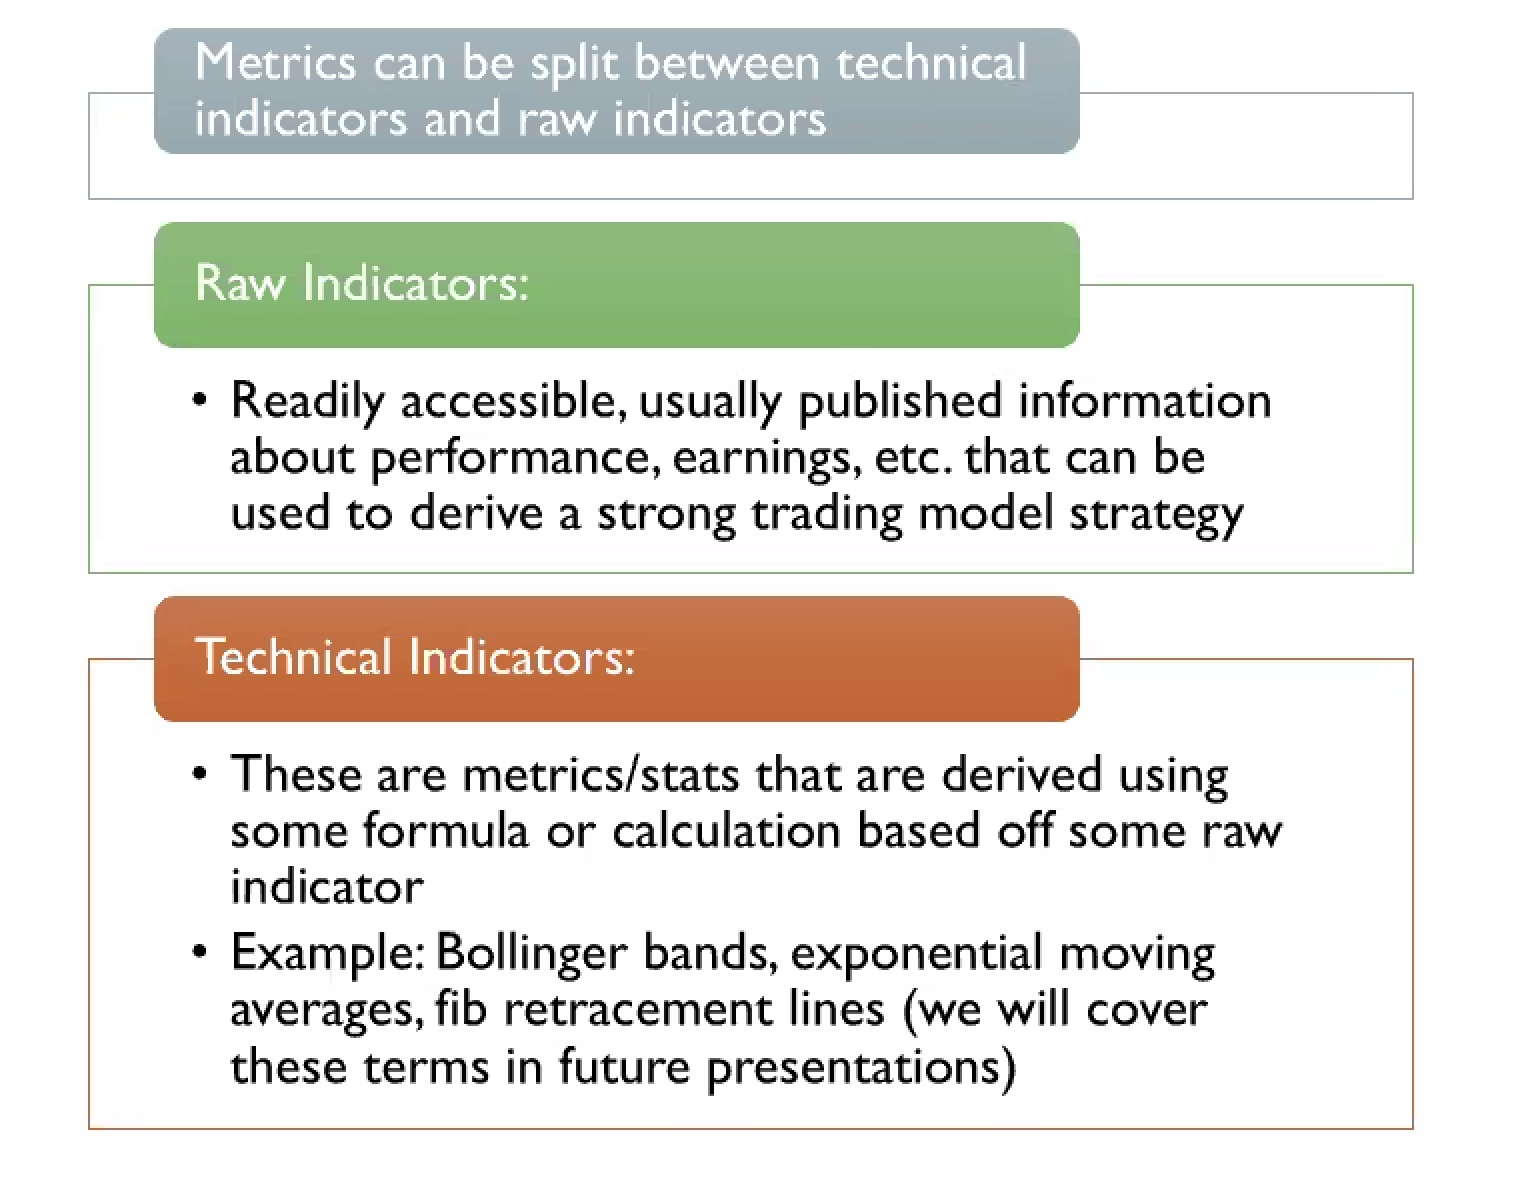
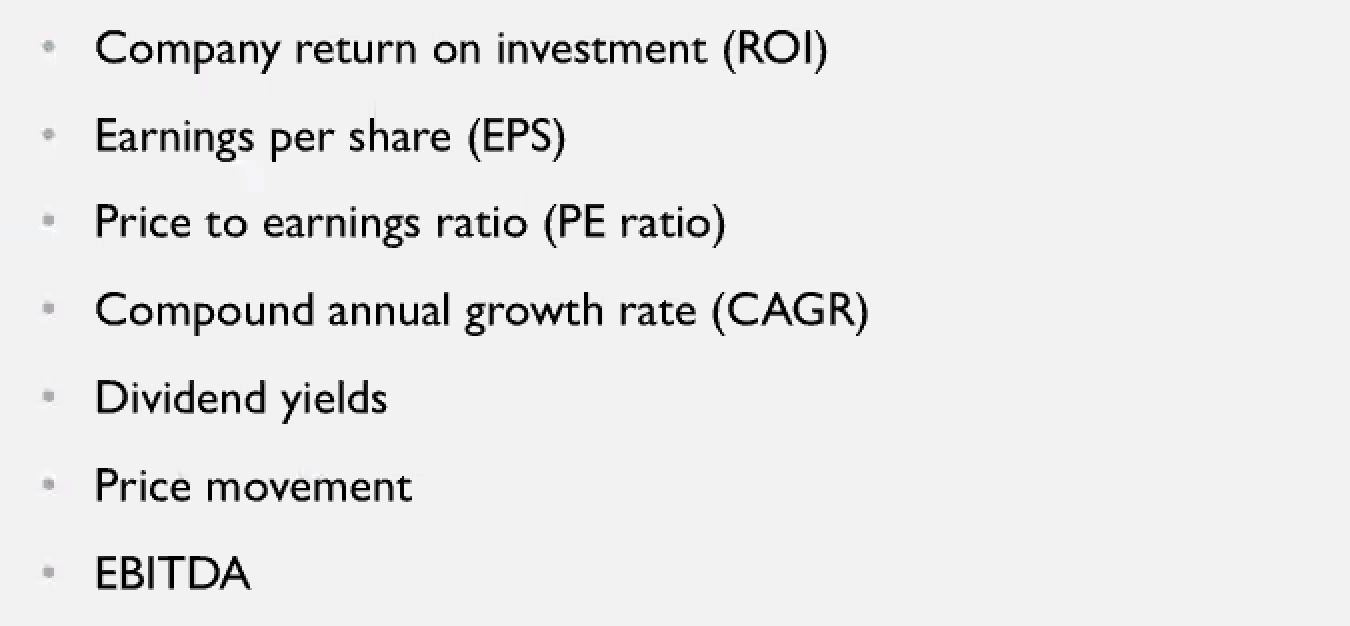
Examples of Raw Indicators
- Not super important for Quants because these are more about VALUE of the companies.
- Information on Financial Statement or that doesn't require calculations
Examples of Technical Indicators
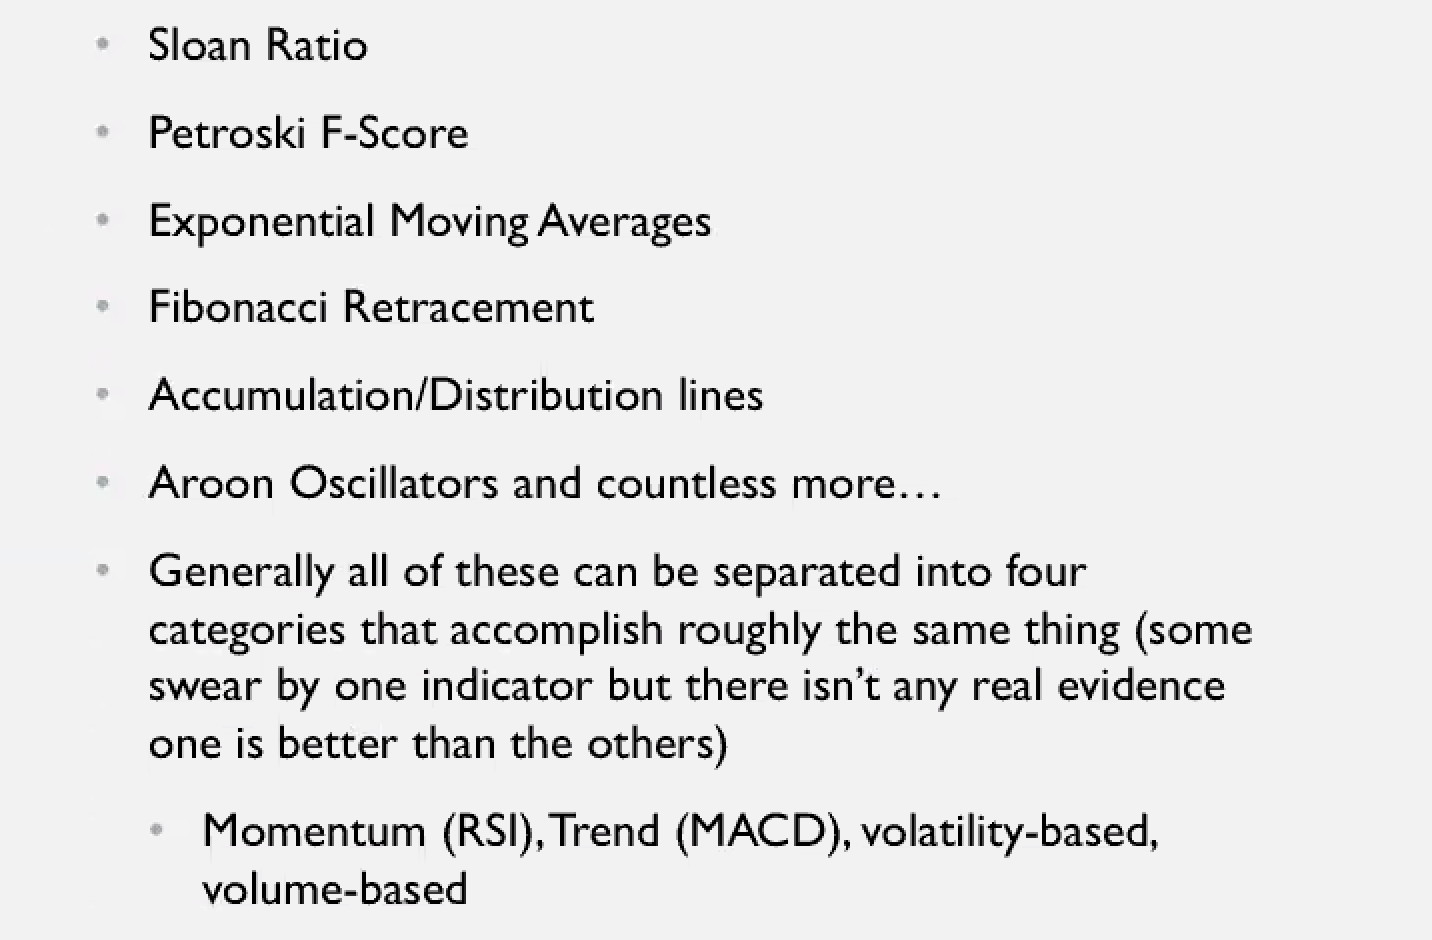
- 4 Categories: Momentum, Trend, Volatility, Volume
- In my opinion, algorithms based on news or tweets might not be the best algorithms because usually news reflect on the events that a lot of high-level investors already know.
- In other words, the market will reflect on the future events or possibilities. By the time, we web-crawl the Yahoo Finance and let algorithm decides if the market's bullish or bearish, the prices will already reflect those news. Unless, we have a Bloomberg Terminal, which is very expensive.
- And, we would need a very efficient/fast algorithm for web-crawling and effective classifcation of what is a good news and bad news.
Important Statistics
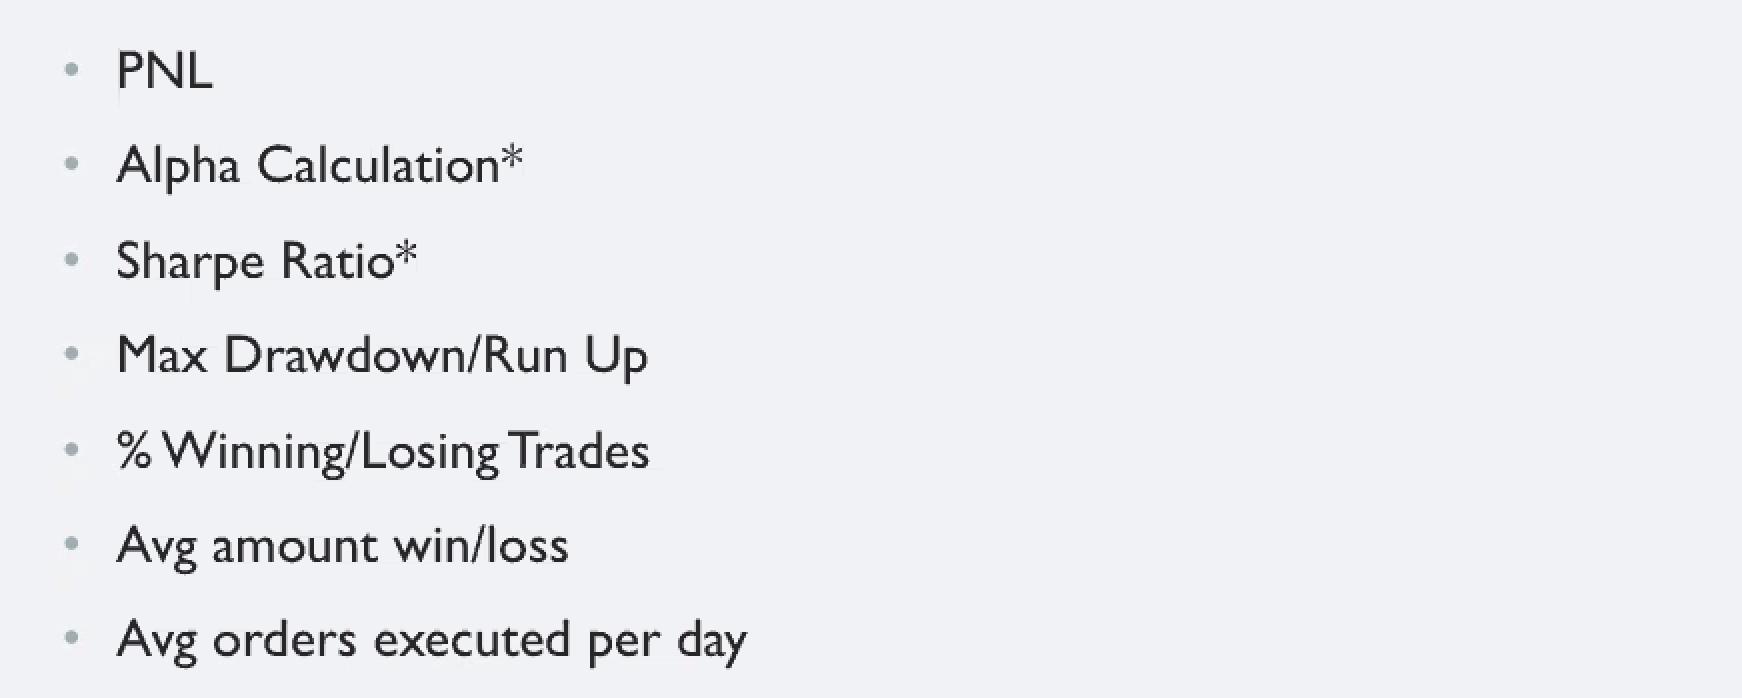
Alpha Calculation
- Alpha is defined as beating the market with some type of strategy. This is not solely relative to returns but also to risk.
- Example: Let's say the S&P 500 goes up 8% in a year.
- You have a momentum based strategy on airline companies that has a 12% profit at the end of the year.
- You may have made 4% "alpha". But, this needs to be consistent.
- Consistent returns are very very important for Alpha.
Sharpe Ratio !!!
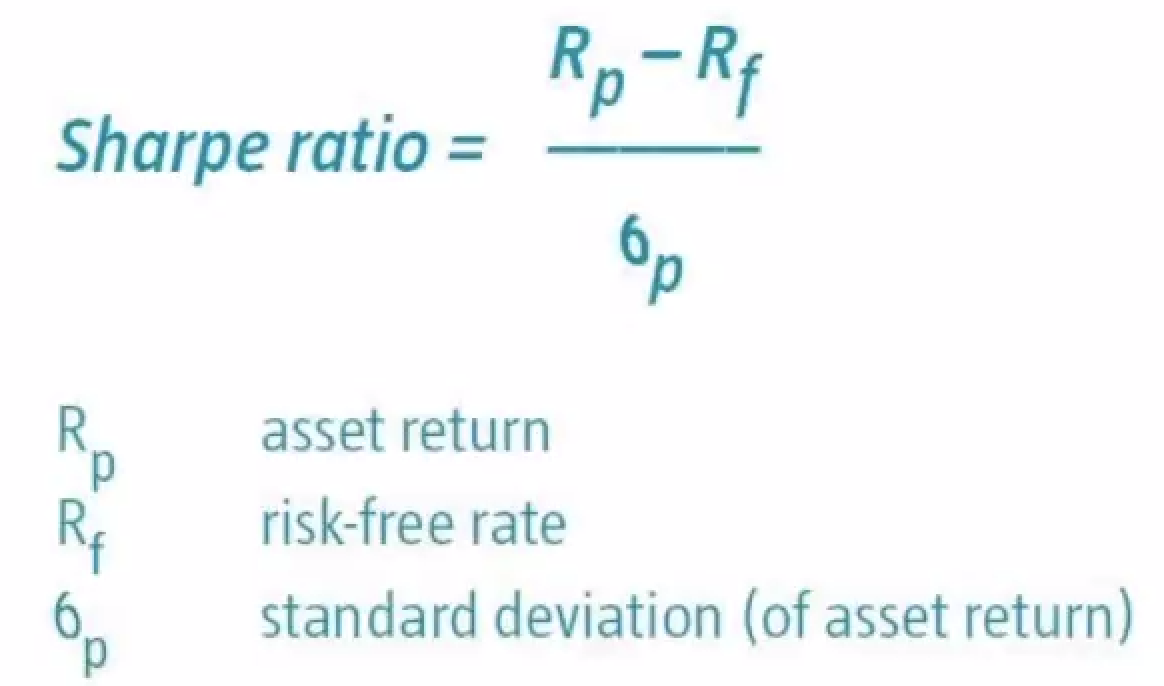
- Designed to help understand the return of an investment versus its risk.
- Risk-free rate can change all the time, but it's usually based on 10 year US Treasuary Bond (Very low-risk).
- Calculation: Average return earned in excess of risk free rate divided by how volatile your strategy is.
- High Sharpe = More Attractive and comes from high returns with low risk.
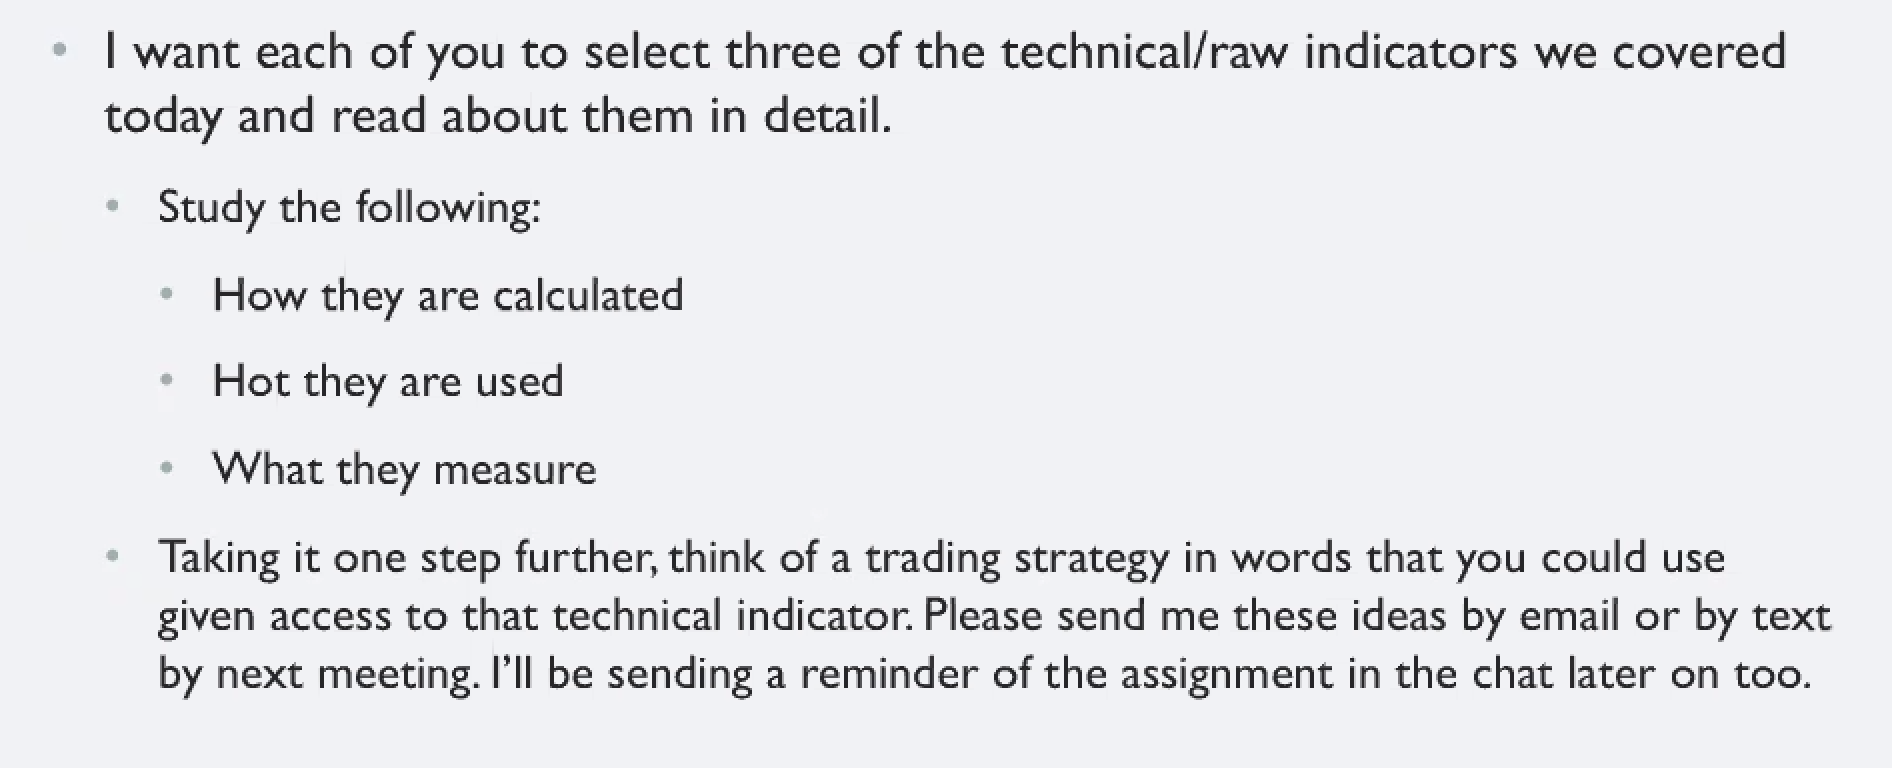
Assignment

I'm a Junior studying Economics and Computer Science at Vanderbilt University.