What is RSI?
Long story short, RSI is a trend indicator, which tells us if the market is bullish or bearish.
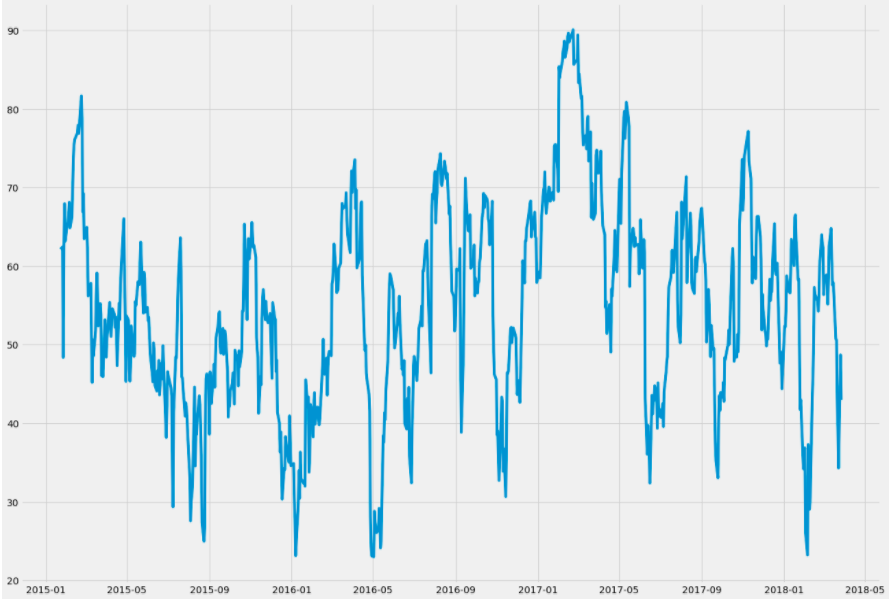
- Based on the general assumption, RSI with 70 or above usually means that very stock is overbought and is likely to be bearish soon.
- And, RSI with 30 or less usually means that very stock is oversold and viceversa. For example, if the RSI of your choice of stock is approaching at least 30, you can assume that the market is going to become bullish soon.

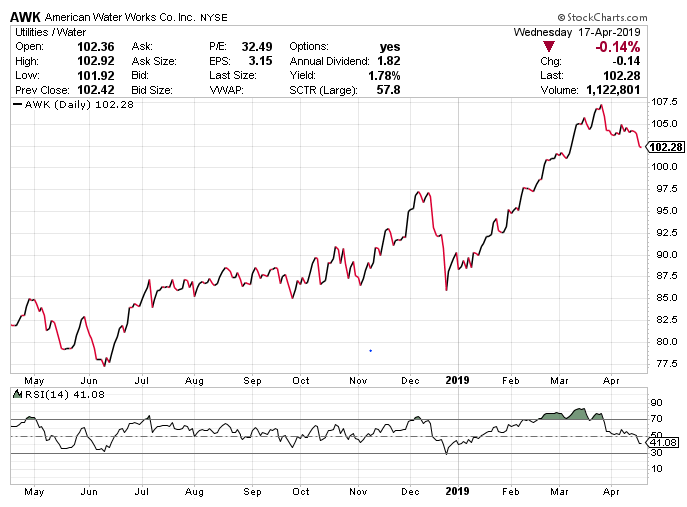
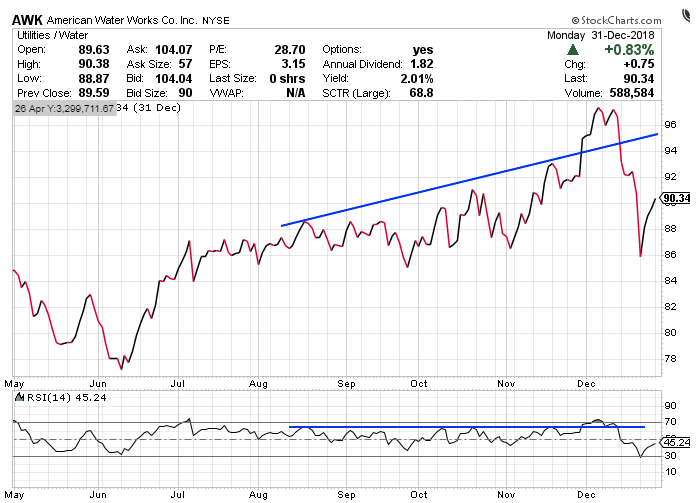
- As you can see in the graph, RSI in the early december was very high, almost exceeding 70. Since this data implies that this stock was overbought, it started going down. But then, once RSI value records low 30, it started bouncing back.
RSI is a long term trend indicator.

- Here, you can see that both RSI and the closing price went up.
- So, it is very important to determine if this accompanying rise can be sustained for a longer period.
Drawback of RSI
Code

#loading the data
import quandl
quandl.ApiConfig.api_key = "Wdq5f9Fa6Pq-h5zJjR5w"
data = quandl.get("WIKI/AAPL", start_date="2015-01-01", end_date="2020-10-30")

def calculateRSI(data, window):
    diff = data.diff(1).dropna()
    up = 0*diff
    down = 0*diff
    up[diff>0] = diff[diff>0]
    down[diff<0] = diff[diff<0]
    up = up.ewm(com=14, min_periods=window).mean()
    down = down.ewm(com=14, min_periods=window).mean()
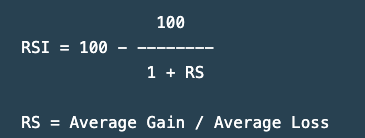
    rs = abs(up/down)
    rsi = 100-(100/(1+rs))
    RSI = rsi['Adj. Close']
    return RSI

rsi_df = calculateRSI(data,14)


Well, I don't even know how I can figure it out, because it looks very complicated. So far, I started by choosing a broker, using the advice from this site https://wonderfulengineering.com/6-top-tips-to-choose-licensed-broker/ , so there is much more to come, but I advise everyone to check out this source and read these great tips.