Bolinger Band consists of a center line and two bands above and below it.
- The centerline is an SMA (20 days), and the upper line is SMA (20 days) + Standard Deviation and the lower line is SMA (20 days) - Standard Deviation.
- And, Bollinger Band is usually more useful for day trading.
What the width of a band signify
- Narrow price band means that the volatility is low, meaning the price hasn't been changing that much.
- And, wide price band means that the volatility is high, meaning there is a lot of change in stocks' price.
My Strategy with the BB
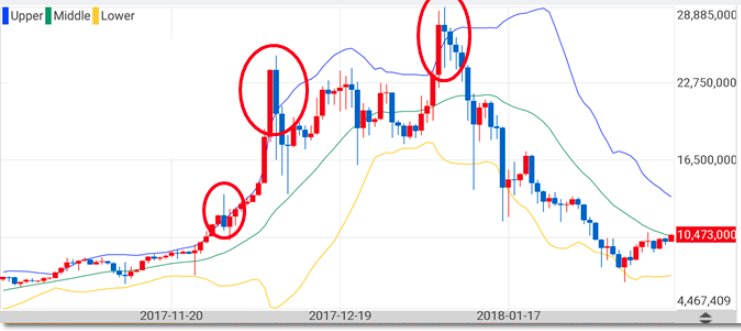
1. If the width of the band is narrowing down, and if the price goes over the upper line, you long. And, if the price goes below the lower line, you short.
- Here, you can see the width of the band was pretty narrow for a long time. However, in the circled section of the chart, you can see the price is increasing with a powerful momentum, eventually breaking the upper line. And, this is when you long!!! This also causes the width of the band to greatly increase.
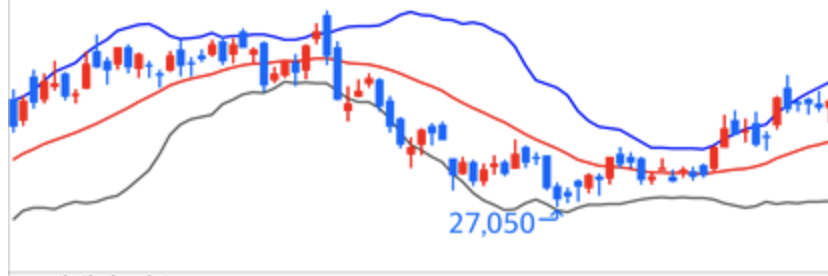
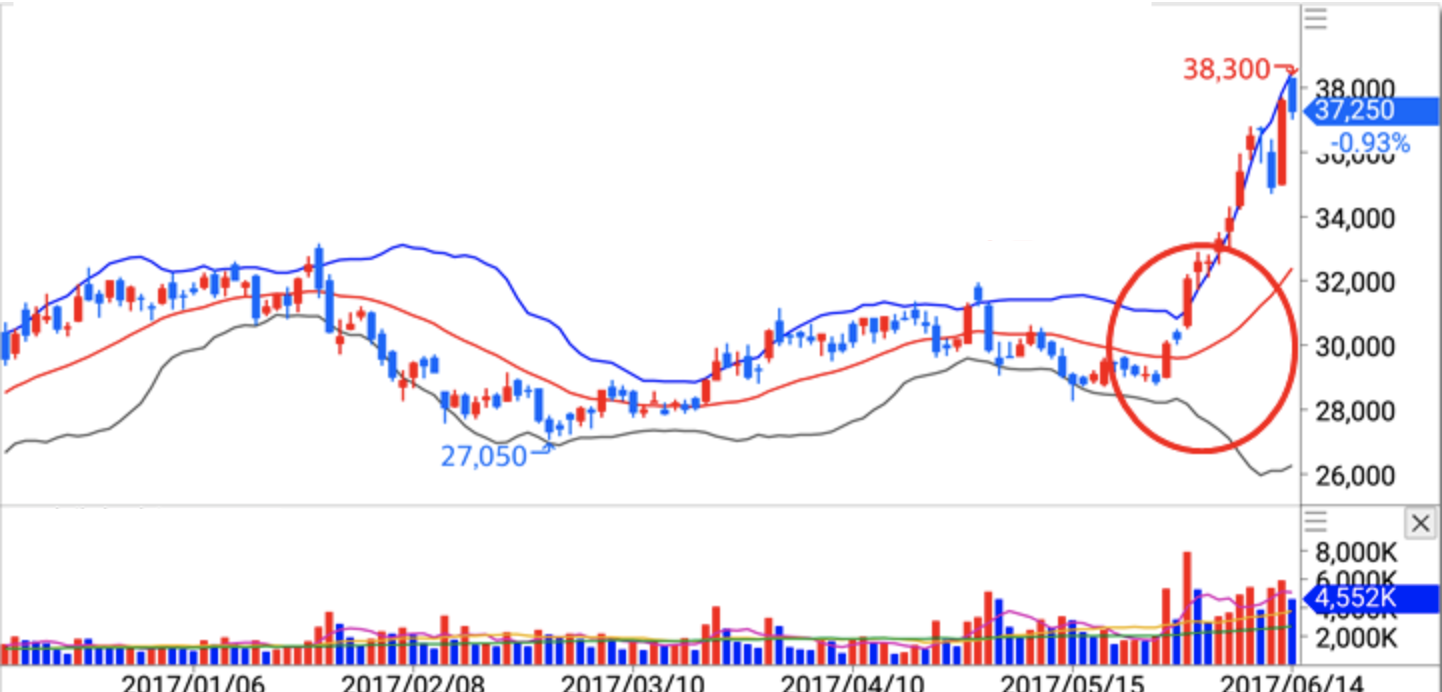
2. If the price is reaching (not just reaching, but go much below) the lower line, you long.
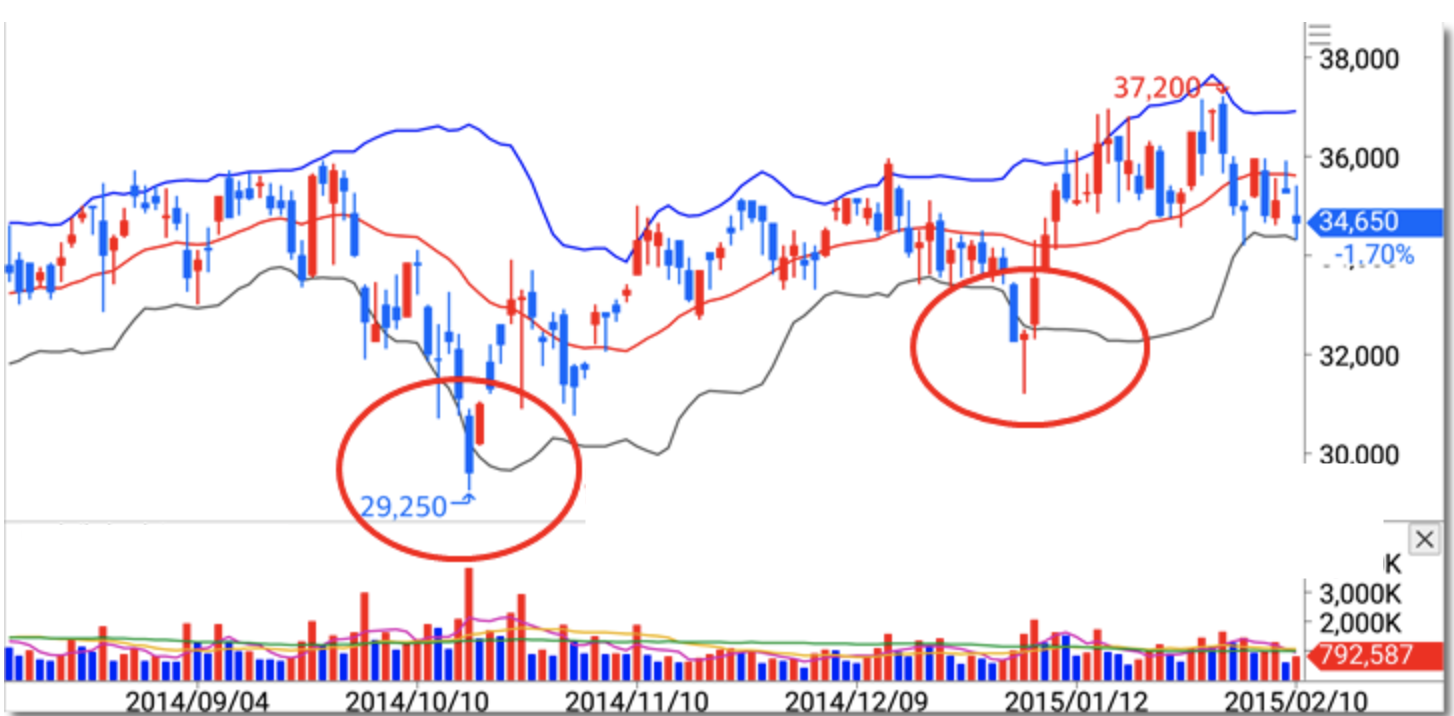
- Here, you can see the price has reached a lower limit at 29,250, crossing the lower line of the band. Plus, the trading volume was very high, which implies the increase in price. Eventually, price consistently increased up to its upper limit.
3. If the price is reaching the upper line, you short.
- We see another pattern here. Regardless of the width of the band, the price going far above the band's upper line signals a bear market trend, which is also a short signal.
In conclusion, no matter which side the price is moving, the price tends to return to fall inside the range of the band once it goes fall beyond, or below, the band.

I'm a Junior studying Economics and Computer Science at Vanderbilt University.