한전 데이터를 시각화하는 업무를 맡게 됐다. 사업장의 년도별, 월별, 일별, 시간별 사용량/요금현황 데이터를 콤비네이션 차트로 한번에 보여주어야 한다. 나는 가장 군더더기 없는 Recharts 라이브러리를 선택했다.
1. Recharts 설치하기
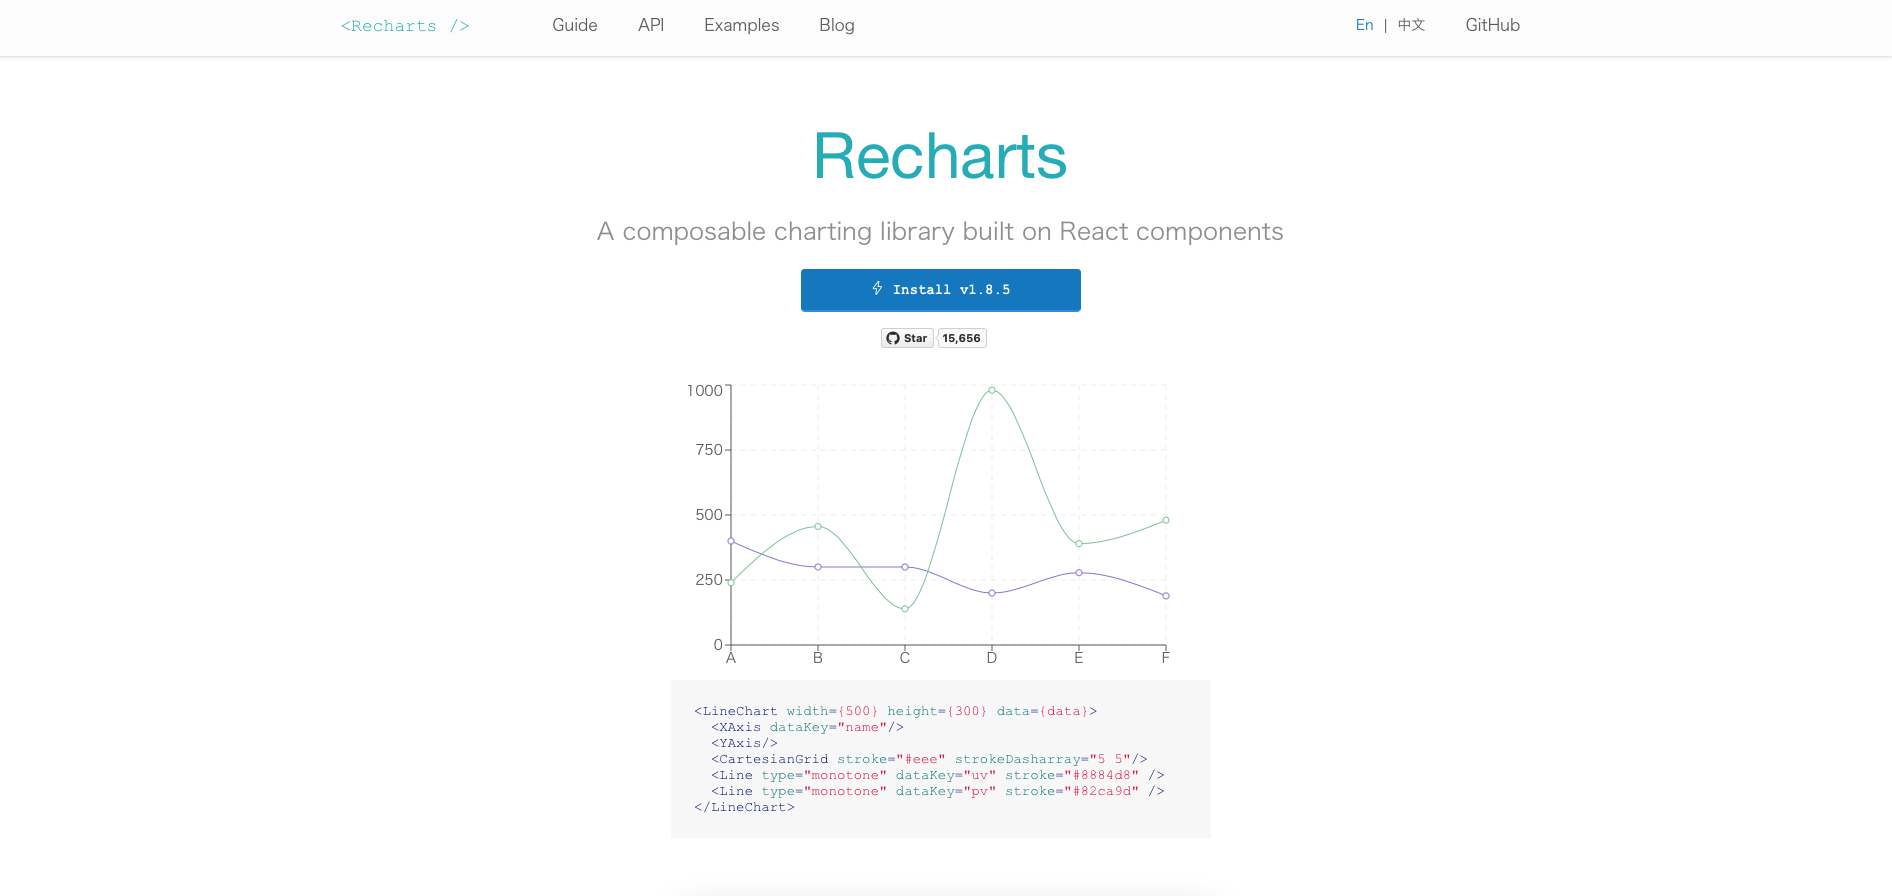
리차트 공식 홈페이지에 들어가면 이렇게 생겼다.

설치해준다.
npm install recharts --savepackage.json 파일에서 잘 설치됐는지 확인한다.
"recharts": "^2.0.3",2. 코드 적용하기
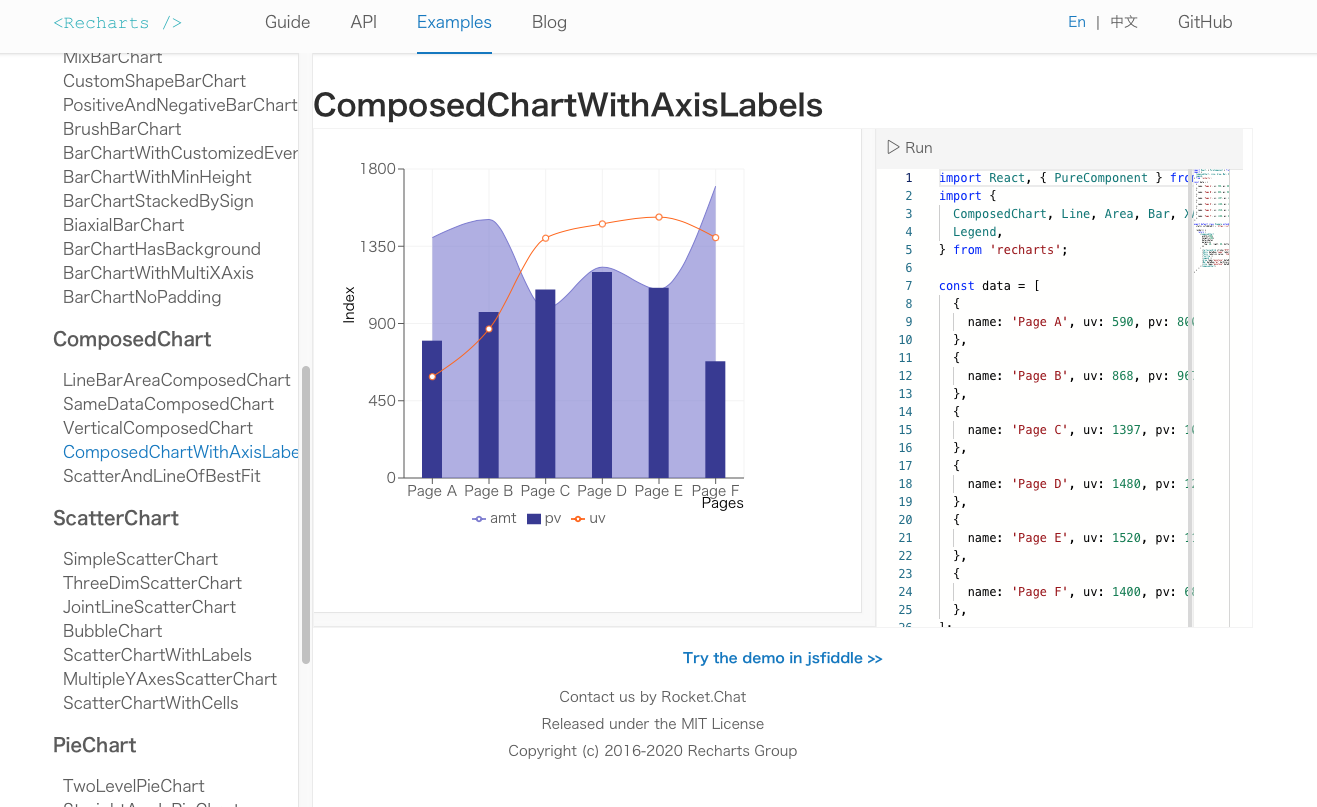
사이트에서 Examples 메뉴에 들어가 보면 다양한 차트가 있다. 원하는 차트를 선택해서 코드를 확인한다.

차트를 그리고자 하는 컴포넌트에 import 한다.
import {
	ResponsiveContainer,
	ComposedChart,
	Line,
	Bar,
	XAxis,
	YAxis,
	CartesianGrid,
	Tooltip,
	Legend,
} from 'recharts';
코드를 그대로 긁어서 내 컴포넌트에 추가해 준다.
    return (
      <ComposedChart
        width={500}
        height={400}
        data={data}
        margin={{
          top: 20, right: 80, bottom: 20, left: 20,
        }}
      >
        <CartesianGrid stroke="#f5f5f5" />
        <XAxis dataKey="name" label={{ value: 'Pages', position: 'insideBottomRight', offset: 0 }} />
        <YAxis label={{ value: 'Index', angle: -90, position: 'insideLeft' }} />
        <Tooltip />
        <Legend />
        <Area type="monotone" dataKey="amt" fill="#8884d8" stroke="#8884d8" />
        <Bar dataKey="pv" barSize={20} fill="#413ea0" />
        <Line type="monotone" dataKey="uv" stroke="#ff7300" />
      </ComposedChart>
여기서 나는 Area 타입은 필요없어서 지우고, Y축이 오른쪽에도 필요했기 때문에 yAxisId를 추가해 주었다. 데이터도 새로 받아온 것으로 수정해주었다.
3. 적용 결과
const UsageAndBill = ({ tabButtonKey }) => {
  const [usageStatus, setUsageStatus] = useState([]);

  useEffect(() => {
    axios.get('/data/SmartView/usageAndBill.json')
      .then((res) => {
      const dataTemp = res.data[tabButtonKey].map((data) => {
        return {
          xAxis: data.MR_HHMI,
          usage: data.F_AP_QT,
          usageLast: data.LYEAR_F_AP_QT,
          bill: data.KWH_BILL,
        };
      });
      setUsageStatus([{}, ...dataTemp, {}]);
    });
  }, [tabButtonKey]);

  return (
    <ResponsiveContainer>
      <ComposedChart
        width={600}
        height={400}
        data={usageStatus}
        margin={{ top: 40, right: 40, bottom: 30, left: 40 }}
      >
        <CartesianGrid stroke="#f5f5f5" />
        <XAxis dataKey="xAxis" />
        <YAxis yAxisId="left" />
        <YAxis yAxisId="right" orientation="right" />
        <Tooltip />
        <Legend />
        <Bar yAxisId="left" dataKey="bill" barSize={30} fill="#7ac4c0" />
        <Line yAxisId="right" type="monotone" dataKey="usage" stroke="#ff7300" />
        <Line yAxisId="right" type="monotone" dataKey="usageLast" stroke="#8884d8" />
      </ComposedChart>
    </ResponsiveContainer>
  );
};
역대급으로 코드 단순하고 적용하기 편한 라이브러린데, x, y축 커스텀이 쉽지 않다는 게 단점이다. 공식문서 다시 정독하러 간다...


안녕하세요! 해당 포스팅을 보고 궁금한 점이 있는데 년, 월 , 일별로 새롭게 보여줄 때 백엔드에서 넘어오는 API는 년, 월, 일 다 다르게 날아오는 건가요?