AI Tech Day 6 (DL 역사, MLP, Matplotlib)

1. 오늘 일정
1) 학습
2) 피어세션
2. 학습 내용
Deep Learning Basic
1강: Historical Review
What make you a good deep learner?
- Implementation Skills (Tensor Flor, Pytorch)
- Math Skills (Linear Algebra, Probability)
- Knowing a lot of recent Paper
Introduction
-
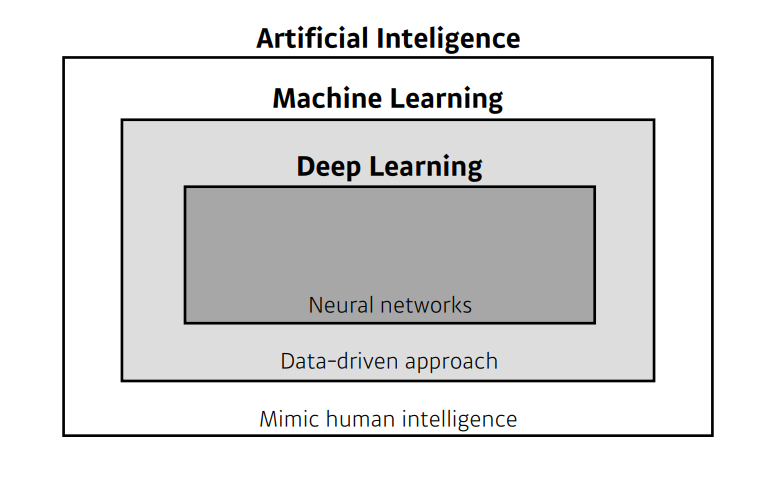
AI, ML, DL의 차이?
-
딥러닝에서 중요 포인트
- 데이터
- 모델
- 손실 함수
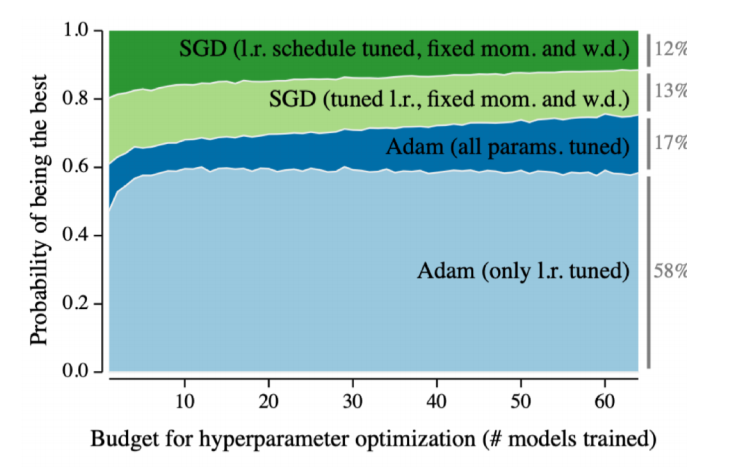
- 알고리즘 (loss를 최소하기 위해서 파라미터를 조정하는..like SGD, ADAM 등)
Data
- 데이터는 풀어야할 문제의 유형에 의존한다.
Model
- 같은 데이터가 주어져도 모델에 따라 결과가 다르다.
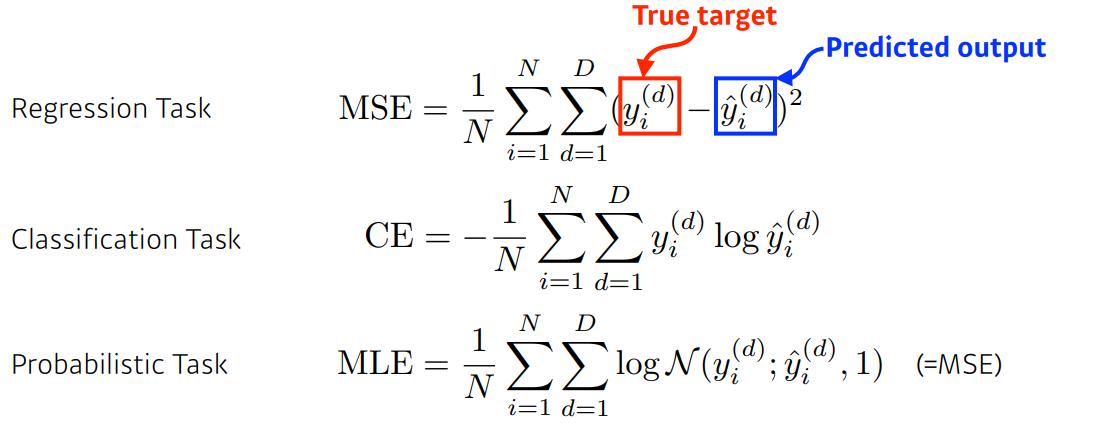
Loss
- 모델을 어떻게 학습할지? parameter를 어떻게 업데이트 할지?
- Reression:
- Classification:
- Probabilistic: = (MSE)
Optimization
Historical Review
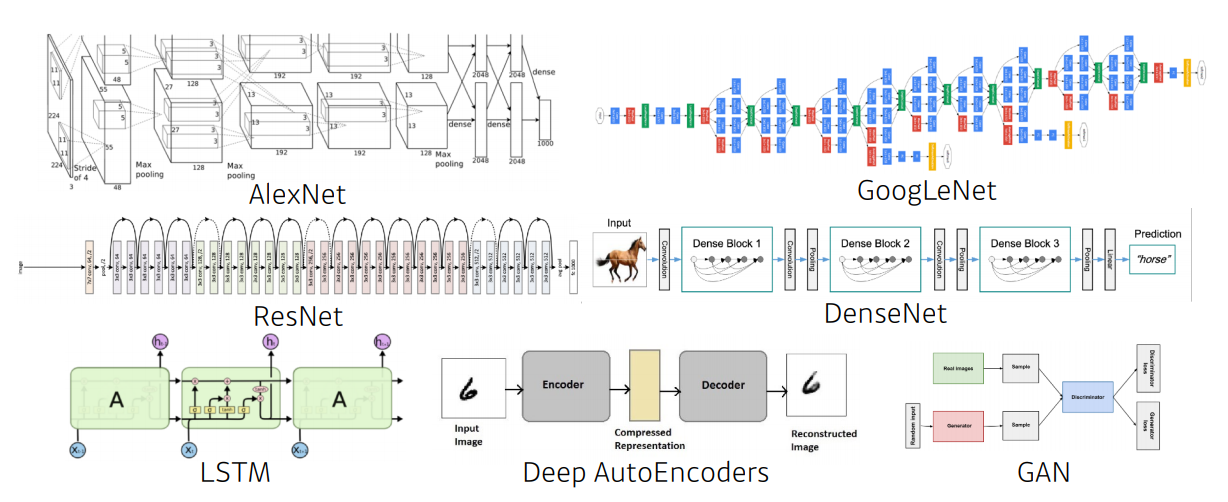
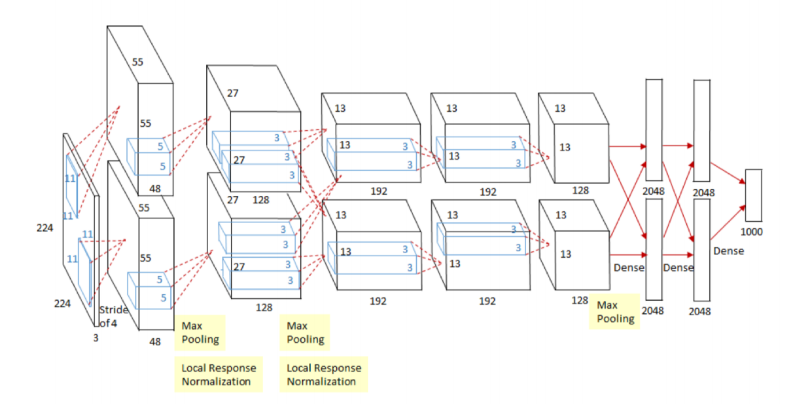
2012 - AlexNet
- 딥러닝이 실제로 성능을 발휘
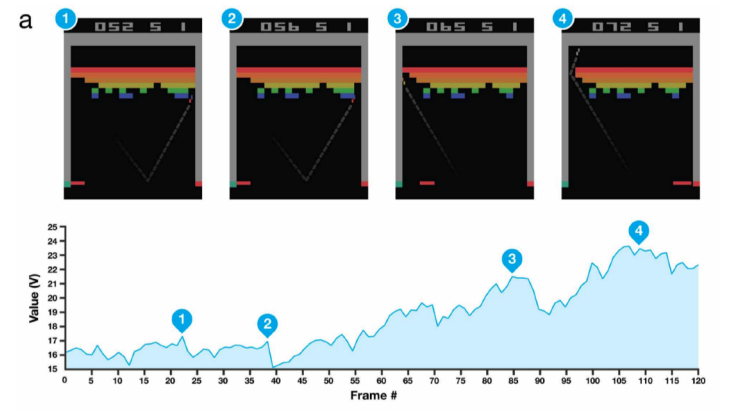
2013 - DQN
- 강화학습
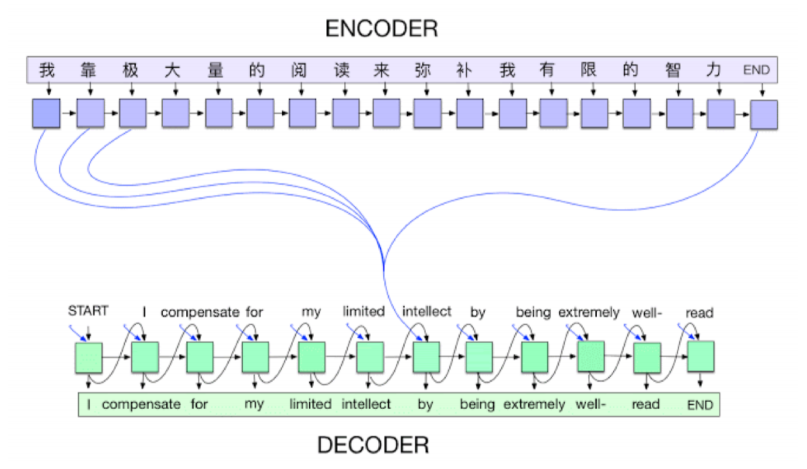
2014 - Endocer / Decoder
- 기계어 번역의 트렌드 변화
2014 - Adam Optimizer
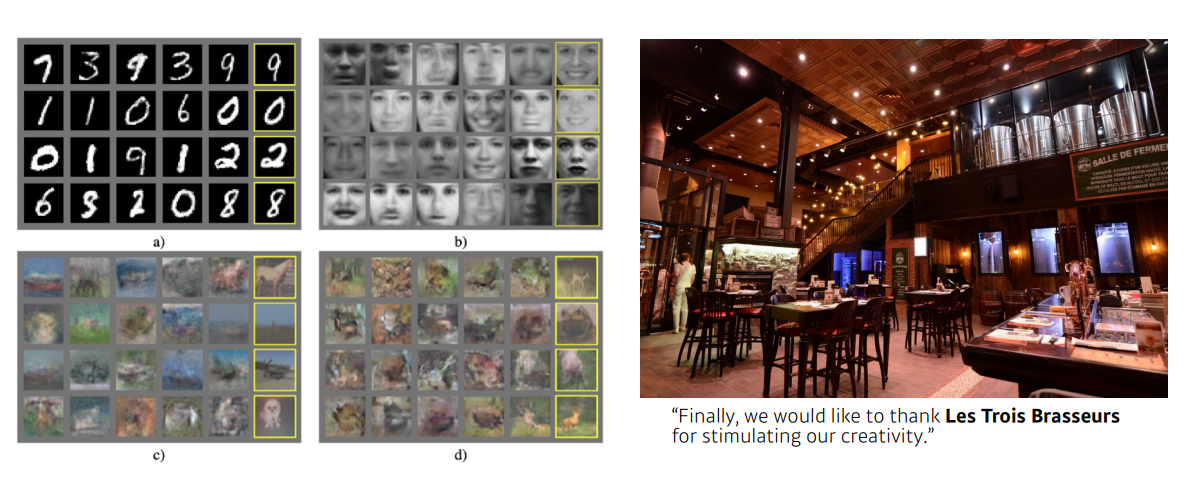
2015 - GAN(Generative Adversarial Network)
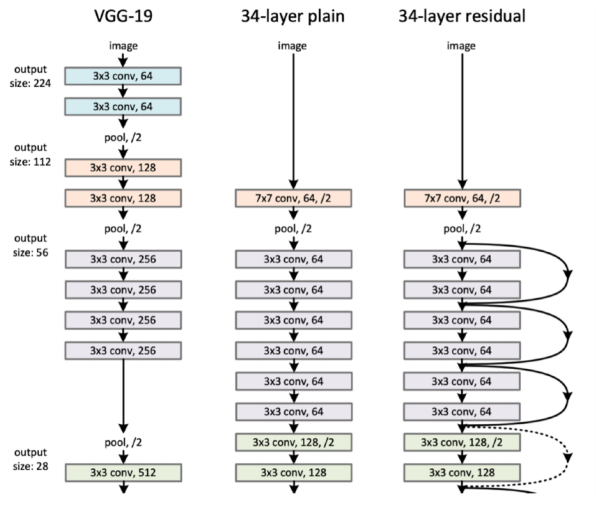
2015 - Residual Networks
- 네트워크를 어느정도 깊게 쌓을 수 있음을 증명
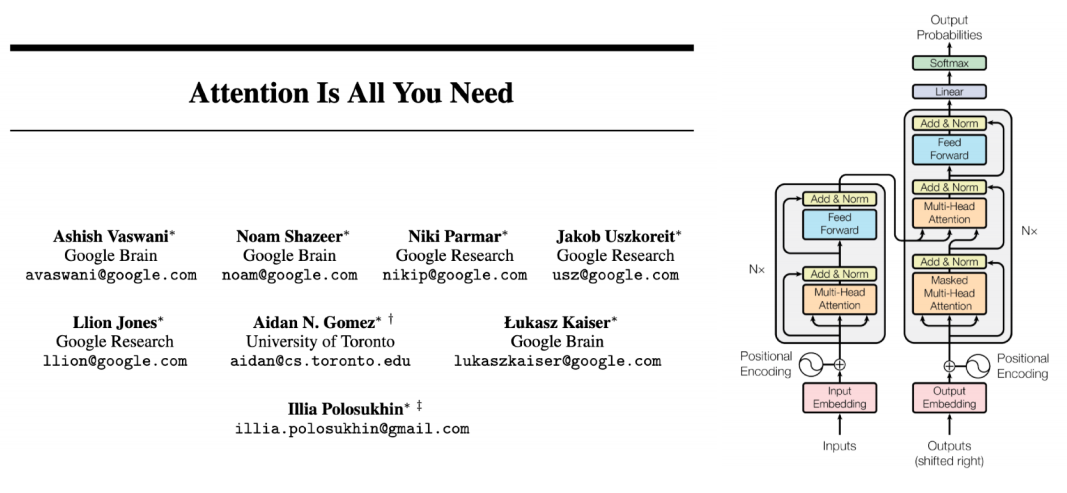
2017 - Transformer
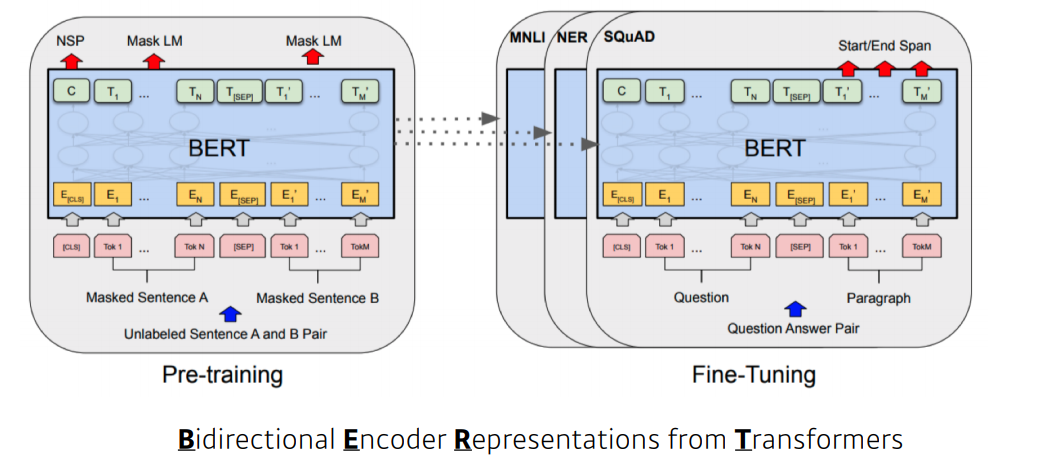
2018 - BERT
- 위키피디아 같은 다수의 데이터로 Pre-training 후 소수의 데이터로 Fine-Tuning
2019 - BIG Language Models
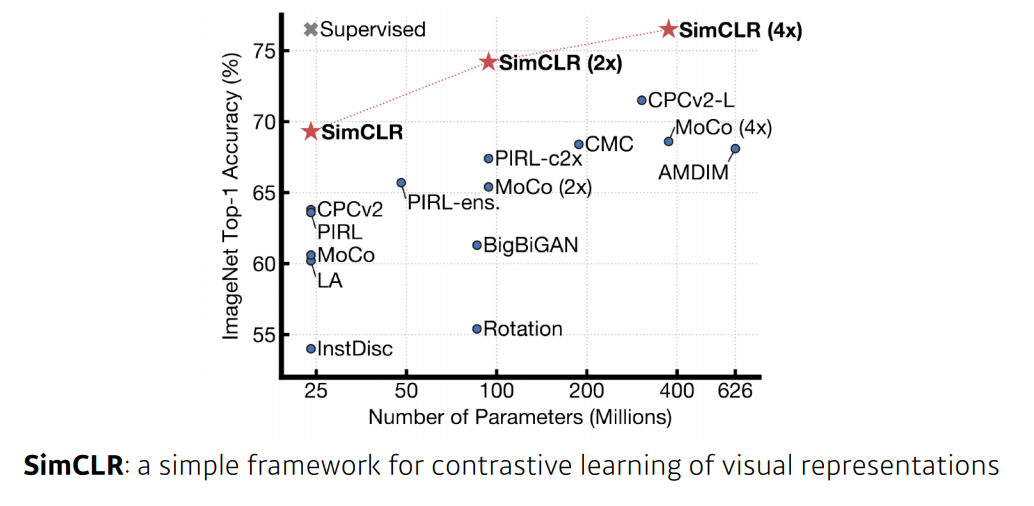
2020 - Self Supervised Learning
2강: 뉴럴 네트워크 - MLP (Multi-Layer Perceptron)
신경망(Neural Networks)
- 신경망은 동물의 뇌를 구성하는 생물학적 신경망에서 막연하게 영감을 받은 컴퓨팅 시스템이다. (비행기를 생각하면 쉬움)
- 신경망은 affine transformations(행렬 곱)과 비선형 연산이 반복적으로 일어나는 함수를 근사하는 모델이다.
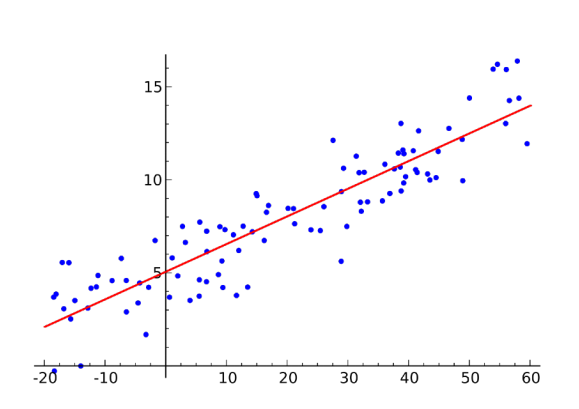
Linear Neural Networks
- Data:
- Model:
- Loss:
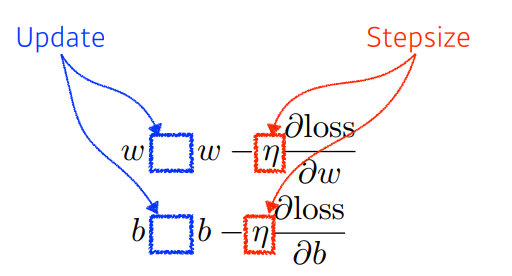
- 적절한 Stepsize를 잡는게 중요하다!
- 물론, 우리는 다수의 행렬 인풋, 아웃풋을 다룰 수 있다.
- stack을 더 쌓는다면?
- 표현력을 극대화하기 위해 활성화함수 추가
- 활성화 함수

MLP (Multi-Layer Perceptron)
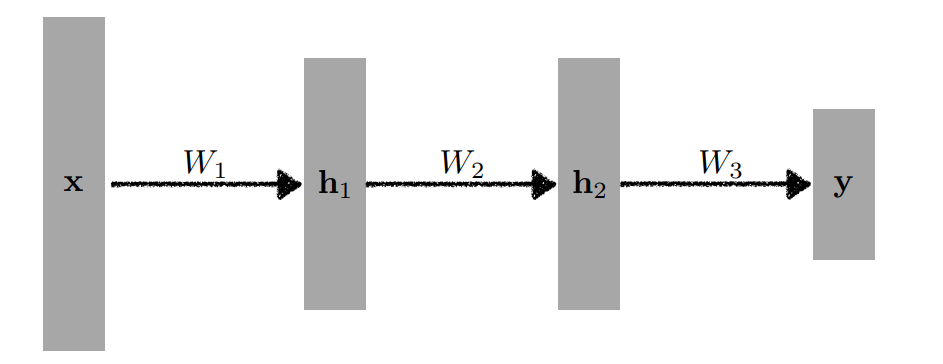
Data Viz
1-1강: Welcome to Visualization(OT)
데이터 시각화란?
데이터 시각화란 데이터를 그래픽 요소로 매핑하여 시각적으로 표현하는 것
- 시각화는 다양한 요소가 포함된 Task
- 목적: 왜 시각화 하는가?
- 독자: 시각화 결과는 누구를 대상으로 하는가?
- 데이터: 어떤 데이터를 시각화하는가?
- 스토리: 어떤 흐름으로 인사이트를 전달할 것인가?
- 방법: 전달하고자 하는 내용에 맞게 효과적인 방법을 사용하는가?
- 디자인: UI에서 만족스러운 디자인을 가지고 있는가?
1-2강: 시각화의 요소
1) 데이터 이해하기
- 데이터 시각화를 위해서는 데이터가 우선적으로 필요
- 시각화를 진행할 데이터
- 데이터셋 관점 (global)
- 개별 데이터의 관점 (local)
- 데이터들이 있는지, 어떤 내용을 전달할 수 있을지 살펴봅시다.
데이터셋의 종류 1
- 정형 데이터
- 테이블 형태로 제공되는 데이터, 일반적으로 csv, tsv 파일로 제공
- row가 데이터 1개 item
- column은 attribute(feature)
- 가장 쉽게 시각화할 수 있는 데이터셋
- 시계열 데이터
- 시간 흐름에 따른 데이터
- 기온, 주가 등 정형데이터와 음성, 비디오와 같은 비정형 데이터 존재
- 시간 흐름에 따른 추세(Trend), 계절성(Seasonality), 주기성(Cycle) 등을 살핌
- 지리 데이터
- 지도 정보와 보고자 하는 정보 간의 조화가 중요
- 관계형(네트워크) 데이터
- 객체와 객체 간의 관계를 시각화
- 계층적 데이터
- 관계 중에서도 포함관계가 분명한 데이터
- 다양한 비정형 데이터
데이터셋의 종류 2
- 수치형 (numerical)
- 연속형 (continuous): 길이, 무게, 온도 등
- 이산형 (discrete): 주사위 눈금, 사람 수 등
- 범주형 (categorical)
- 명목형 (norminal): 혈액형, 종교 등
- 순서형 (ordinal): 학년, 별점, 등급 등
마크와 채널
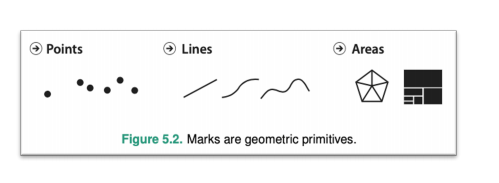
- 마크: 이미지에서 기본적인 graphical 요소 (점, 선, 면)
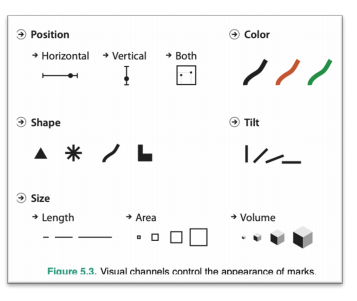
- 채널: 각 마크를 변경할 수 있는 요소들
전주의적 속성
- Pre-attentive Attribute
- 주의를 주지 않아도 인지하게 되는 요소
- 시각적으로 다양한 전주의적 속성이 존재
- 동시에 사용하면 인지하기 어려움
- 적절하게 사용할 때, 시각적 분리(visual popout)
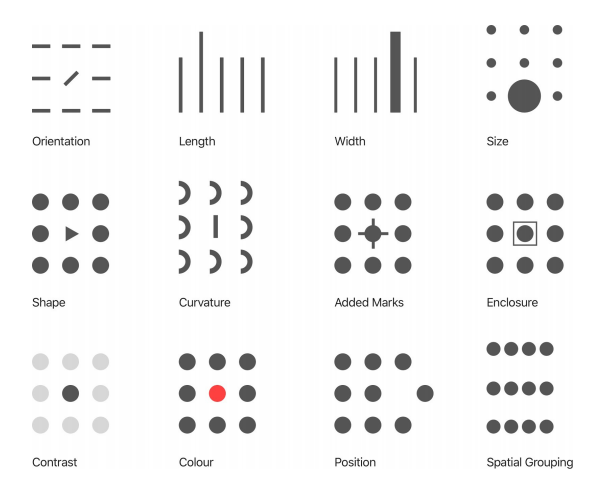
- 적절하게 사용할 때, 시각적 분리(visual popout)
1-3강: Python과 Matplotlib
Matplotlib를 쓰는 이유?
- Matplotlib는 Python에서 사용할 수 있는 시각화 라이브러리
- 현재 사용되고 있는 다양한 데이터 분석 및 머신러닝/딥러닝은 Python에서 이뤄지고 있음
- numpy와 scipy를 베이스로 하여 다양한 라이브러리와 호환성이 좋음
- Scikit-Learn, PyTorch, Tensorflow
- Pandas
- 다양한 시각화 방법론 제공
- 막대그래프
- 선그래프
- 산점도
- ETC
import
import numpy as np
import matplotlib as mpl
import matplotlib.pyplot as plt
기본 Plot
# 기본 틀
fig = plt.figure()
plt.show()

# 서브 플롯 추가
flg = plt.figure()
ax = fig.add_subplot()
plt.show()

# figure사이즈 조절
flg = plt.figure(figsize=(12, 7))
ax = fig.add_subplot()
plt.show()

# 여러개 그리기
fig = plt.figure()
ax = fig.add_subplot(121)
ax = fig.add_subplot(122)
plt.show()
기본 예제
fig = plt.figure()
ax = fig.add_subplot()

x = [1, 2, 3]

plt.plot(x)
plt.show()

# 서브플롯 객체에 그리기
fig = plt.figure()

x1 = [1, 2, 3]
x2 = [3, 2, 1]

ax1 = fig.add_subplot(211)
ax2 = fig.add_subplot(212)

ax1.plot(x1)
ax2.plot(x2)
plt.show()

# 한 서브플롯에 여러 개 그리기
fig = plt.figure()
ax = fig.add_subplot(111)
# 3개의 그래프 동시에 그리기
ax.plot([1, 1, 1]) # 파랑
ax.plot([1, 2, 3]) # 주황
ax.plot([3, 3, 3]) # 초록

plt.show()

# 다른 종류 그래프 그리기
fig = plt.figure()
ax = fig.add_subplot(111)

# 선그래프와 막대그래프 동시에 그리기 (색 명시해주어야 한다.)
ax.plot([1, 2, 3], [1, 2, 3])
ax.bar([1, 2, 3], [1, 2, 3])

plt.show()
색상 지정하기
fig = plt.figure()
ax = fig.add_subplot(111)
# 3개의 그래프 동시에 그리기
ax.plot([1, 1, 1], color='r') # 한 글자로 정하는 색상
ax.plot([2, 2, 2], color='forestgreen') # color name
ax.plot([3, 3, 3], color='#000000') # hex code (BLACK)
plt.show()
텍스트 사용하기
fig = plt.figure()
ax = fig.add_subplot(111)
ax.plot([1, 1, 1], label='1')
ax.plot([2, 2, 2], label='2')
ax.plot([3, 3, 3], label='3')
ax.set_title('Basic Plot')
ax.legend()
plt.show()
fig = plt.figure()
ax1 = fig.add_subplot(1, 2, 1)
ax2 = fig.add_subplot(1, 2, 2)
ax1.set_title('ax1')
ax2.set_title('ax2')
fig.suptitle('fig') # super
plt.show()축 사용하기
fig = plt.figure()
ax = fig.add_subplot(111)
ax.plot([1, 1, 1], label='1')
ax.plot([2, 2, 2], label='2')
ax.plot([3, 3, 3], label='3')


ax.set_title('Basic Plot')
ax.set_xticks([0, 1, 2])
ax.legend()
plt.show()
텍스트 추가하기
ax.text(x=1, y=2, s='This is Text')

ax.annotate(text='This is Annotate', xy=(1, 2),
           xytext=(1.2, 2.2),
            arrowprops=dict(facecolor='black'),
           )
3. 피어 세션 정리
- 오늘 강의 (DL) 요약
- 지난주 선택과제 리뷰
- 앞으로 멘토링 등 어떻게 할지?
4. 과제 수행 과정
- 강의 내용과 같았음
5. 회고
- 오늘부터는 조금 널널했음
- 딥러닝 제대로 하기 시작하니 재밌다
- 새로운 한 주이다 화이팅!
6. 내일 할일
- 시각화 마무리
- optimizer 강의
- 필수 과제
- 수학 스터디 대비

