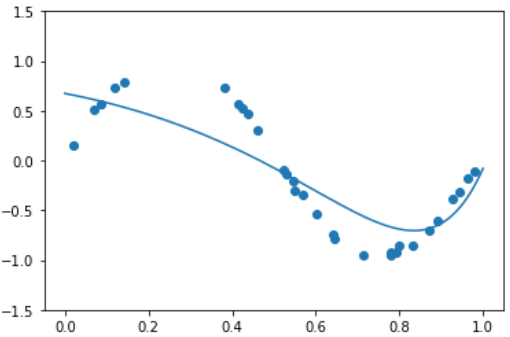
지도학습 - 규제 선형모델 Ridge_Lasso_Regression
지도학습 - 규제 선형모델 배경
- 선형 회귀의 문제
- 단순 선형 회귀 : 단 하나의 특성을 가지고 라벨 값 또는 타깃을 예측하기 위한 회귀 모델을 찾는 것
- 다중 선형 회귀 : 여러 개의 특성을 활용해서 회귀 모델을 찾는 것
- 다중 선형 회귀 모델은 과대적합 될 때가 종종 발생
주어진 샘플들의 특성 값들과 라벨 값의 관계를 필요 이상으로 복잡하게 분석하는 것
=> 새로운 데이터가 주어졌을 때 제대로 예측하기 어려움(일반화가 어려움)
=> Ridge / Lasso / Elastic Regression 등장
-
편향 오차와 분산 오차
특성이 증가하면 복잡성이 증가 -> 분산은 증가, 편향은 감소 -> overfitting 발생
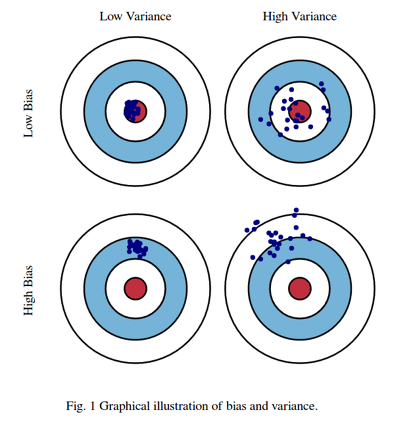
Bias(편향) 오차와 Variance(분산) 오차를 표현편향 감소가 분산의 증가와 같아지는 최적의 point를 찾아야 함
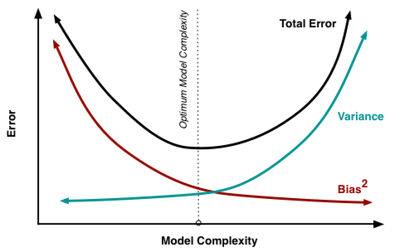
- 편향 오차가 낮고 분산 오차가 높은 경우 -> 모델 복잡, 과대적합
- 편향 오차가 높고 분산 오차가 낮은 경우 -> 모델 단순, 과소적합
- 편향 에러가 높아지는 것은 데이터를 고려하지 않아 정확한 예측을 하지 못한 경우
- 분산 에러는 노이즈까지 전부 학습하여 약간의 input에도 예측값이 크게 흔들리는 것
- 두가지 에러가 상호 Trade-off관계이기 때문에 이 둘을 모두 잡는 것은 불가능한 딜레마이다
-
정규화 (Regularization/규제)
과대적합이 되지 않도록 모델을 강제로 제한하는 것을 의미
가중치 값을 조정하여 제약을 주는 것- L1 규제 : Lasso
- w의 모든 원소에 똑같은 힘으로 규제를 적용, 특정 계수는 0
- 특성선택이 자동으로 이루어진다
- L2 규제 : Ridge
- w의 모든 원소에 골고루 규제를 적용하여 0에 가깝게 만듦
- L1 규제 : Lasso
Ridge Regression
- 평균 제곱 오차식에 Alpha 항이 추가된 모델
- Alpha 값을 크게 하면 패널티 효과가 커진다 (가중치 감소)
- Alpha 값을 작게 하면 그 반대가 된다
- 기존 선형회귀의 가중치와 편향에 추가적인 제약조건(규제항)을 포함, 가중치에 대한 제곱의 합을 사용한다
- MSE가 최소가 되게하는 가중치와 편향을 찾는 동시에 MSE와 규제항의 합이 최소가 되어야한다 => 가중치의 모든 원소가 0이 되거나 근사하도록 학습한 가중치의 제곱을 규제항 (L2규제)으로 사용한다
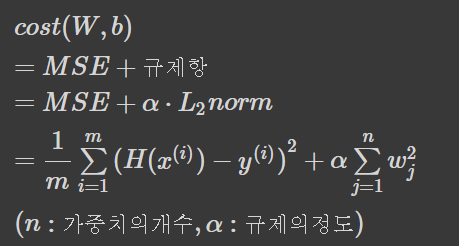
- MSE에 의한 Overfitting을 줄이기 위해 Alpha를 크게하면 정확도가 감소한다
=> Alpha가 너무 크면 MSE의 비중이 작아져서 과소적합 가능성이 증가한다
- Alpha가 증가하면 편향은 증가하고 분산은 감소하며 Alpha가 0이 되면 MSE와 동일하게 되어 선형 회귀모델이 된다
=> Ridge 모델은 편향을 손해보면서 분산을 크게 줄여 성능을 향상 시킨다
- 단점 : 몇몇 변수가 중요하더라도 모든 변수에 대해 동일하게 규제를 준다
- Ridge()
Ridge(alpha, fit_intercept, normalize, copy_X, max_iter, tol, solver, random_state)- alpha : 값이 클수록 강력한 정규화(규제) 설정하여 분산을 줄임, 양수로 설정
- fit_intercept : 모형에 상수항 (절편)이 있는가 없는가를 결정하는 인수 (default : True)
- normalize : 매개변수 무시 여부
- copy_X : X의 복사 여부
- max_iter : 계산에 사용할 작업 수
- tol : 정밀도
- solver : 계산에 사용할 알고리즘 (auto, svd, cholesky, lsqr, sparse_cg, sag, saga)
- random_state : 난수 seed 설정Ridge_Regression 실습
- 라이브러리 가져오기
import numpy as np
import matplotlib.pyplot as plt
from sklearn.linear_model import LinearRegression, Ridge, Lasso, ElasticNet
%matplotlib inline- 데이터 가져와서 전처리하기
# 확장 보스턴 집값
import mglearn
from sklearn.model_selection import train_test_split

X, y = mglearn.datasets.load_extended_boston()
X_train, X_test, y_train, y_test = train_test_split(X, y, random_state=0)
X_train.shape
=> (379, 104)
- 선형 회귀 모델을 적용시킨 결과
model = LinearRegression().fit(X_train, y_train)

print('훈련 점수:', model.score(X_train, y_train) )
print('테스트점수:', model.score(X_test, y_test) )
- 릿지 회귀 모델을 적용시킨 결과 1
# model_ridge
model_ridge = Ridge().fit(X_train, y_train)

print('훈련 점수:', model_ridge.score(X_train, y_train) )
print('테스트점수:', model_ridge.score(X_test, y_test) )
- 릿지 회귀 모델을 적용시킨 결과 2
model_ridge_10 = Ridge(alpha=10).fit(X_train, y_train)

print('훈련 점수:', model_ridge_10.score(X_train, y_train) )
print('테스트점수:', model_ridge_10.score(X_test, y_test) )
- 릿지 회귀 모델을 적용시킨 결과 3
model_ridge_01 = Ridge(alpha=0.1).fit(X_train, y_train)

print('훈련 점수:', model_ridge_01.score(X_train, y_train) )
print('테스트점수:', model_ridge_01.score(X_test, y_test) )
- alpha값에 따른 가중치를 시각화
# α 값의 변화에 따른 가중치 (coef_)의 변화를 시각화
plt.plot(model_ridge_10.coef_, '^', label='Ridge alpha=10')
plt.plot(model_ridge.coef_, 's', label='Ridge alpha=1')
plt.plot(model_ridge_01.coef_, 'v', label='Ridge alpha=0.1')
plt.plot(model.coef_, 'o', label='LinearRegression')
plt.hlines(0, 0, len(model.coef_))
plt.ylim(-25, 25)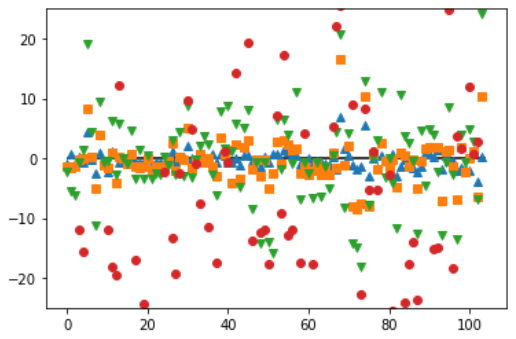
Lasso Regression
- Ridge 회귀의 단점을 해결하기 위해 학습한 가중치의 절댓값을 규제항(L1 규제)으로 사용한다
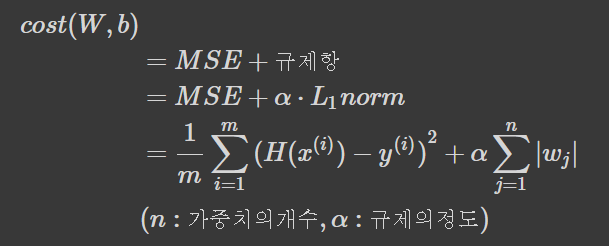
- 적당한 Alpha만으로 몇몇 계수를 정확하게 0으로 만들 수 있다 -> 해석을 용이하게 한다
- MSE와 규제항의 합이 최소가 되게 하는 가중치와 편향을 찾는 것이 Lasso의 목표이다
- MSE항이 작아질 수록 오차가 작아지고 L1-Norm이 작아질 수록 많은 가중치들이 0에 가까워진다 -> 데이터 전처리에 주로 사용한다
- Ridge와 Lasso의 성능 차이는 사용하는 데이터의 상황에 따라 다르다
=> 유의미한 변수가 적을 때는 Lasso가 좋고 반대는 Ridge가 좋다
- Lasso()
Lasso(alpha, fit_intercept, normalize, precompute, copy_X, max_iter, tol, warm_start, positive, solver, random_state, selection)- alpha : 값이 클수록 강력한 정규화(규제) 설정하여 분산을 줄임, 양수로 설정
- fit_intercept : 모형에 상수항 (절편)이 있는가 없는가를 결정하는 인수 (default : True)
- normalize : 매개변수 무시 여부
- precompute : 계산속도를 높이기 위해 미리 계산된 그램 매트릭스를 사용할 것인지 여부
- copy_X : X의 복사 여부
- max_iter : 계산에 사용할 작업 수
- tol : 정밀도
- warm_start : 이전 모델을 초기화로 적합하게 사용할 것인지 여부
- positive : 계수가 양수로 사용할 것인지 여부
- solver : 계산에 사용할 알고리즘 (auto, svd, cholesky, lsqr, sparse_cg, sag, saga)
- random_state : 난수 seed 설정
- selection : 계수의 업데이트 방법 설정 (random으로 설정하면 tol이 1e-4보다 높을 때 빠른 수렴)Lasso Regression 실습
- 라이브러리 가져오기
import numpy as np
import matplotlib.pyplot as plt
from sklearn.linear_model import LinearRegression, Ridge, Lasso, ElasticNet
%matplotlib inline- 데이터 가져오기 및 전처리
# 확장 보스턴 집값
import mglearn
from sklearn.model_selection import train_test_split

X, y = mglearn.datasets.load_extended_boston()
X_train, X_test, y_train, y_test = train_test_split(X, y, random_state=0)- Lasso 회귀 모델을 적용시킨 결과 1
from sklearn.linear_model import Lasso

# lasso
model_lasso = Lasso().fit(X_train, y_train)

print('훈련 점수:', model_lasso.score(X_train, y_train) )
print('테스트점수:', model_lasso.score(X_test, y_test) )
print('사용한 특성 수:', np.sum( model_lasso.coef_ != 0 ) )

- Lasso 회귀 모델을 적용시킨 결과 2
model_lasso_001 = Lasso(alpha=0.01, max_iter=10000).fit(X_train, y_train)

print('훈련 점수:', model_lasso_001.score(X_train, y_train) )
print('테스트점수:', model_lasso_001.score(X_test, y_test) )
print('사용한 특성 수:', np.sum( model_lasso_001.coef_ != 0 ) )
- Lasso 회귀 모델을 적용시킨 결과 3
model_lasso_00001 = Lasso(alpha=0.0001, max_iter=100000).fit(X_train, y_train)

print('훈련 점수:', model_lasso_00001.score(X_train, y_train) )
print('테스트점수:', model_lasso_00001.score(X_test, y_test) )
print('사용한 특성 수:', np.sum( model_lasso_00001.coef_ != 0 ) )
- alpha값에 따른 가중치를 시각화
plt.plot(model_lasso.coef_, 's', label='Lasso alpha=1')
plt.plot(model_lasso_001.coef_, '^', label='Lasso alpha=0.01')
plt.plot(model_lasso_00001.coef_, 'v', label='Lasso alpha=0.0001')

plt.plot(model.coef_, 'o', label='LinearRegression')
plt.hlines(0, 0, len(model.coef_))
plt.ylim(-25, 25)
plt.legend(ncol=2, loc=(0, 1.05))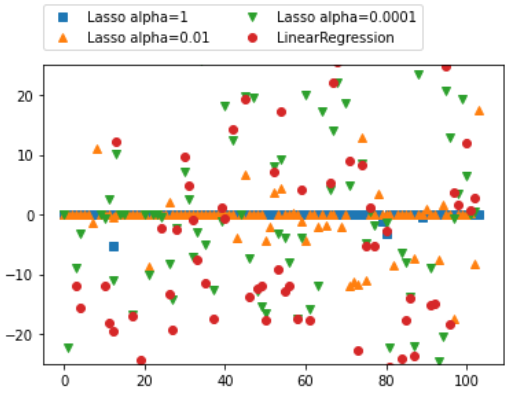
ElasticNet Regression
- 선형 회귀에 2가지 규제항 (L1, L2)을 추가한 모델
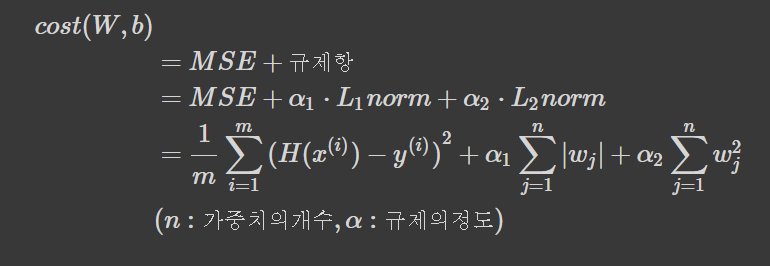
- ElasticNet()
ElasticNet(alpha, l1_ratio, fit_intercept, normalize, precompute, max_iter, copy_X,
tol, warm_start, positive, random_state, selection)
- alpha : 값이 클수록 강력한 정규화(규제) 설정하여 분산을 줄임, 양수로 설정
- l1_ratio : L1 규제의 비율 (혼합비율?)
- fit_intercept : 모형에 상수항 (절편)이 있는가 없는가를 결정하는 인수 (default : True)
- normalize : 매개변수 무시 여부
- precompute : 계산속도를 높이기 위해 미리 계산된 그램 매트릭스를 사용할 것인지 여부
- copy_X : X의 복사 여부
- max_iter : 계산에 사용할 작업 수
- tol : 정밀도
- warm_start : 이전 모델을 초기화로 적합하게 사용할 것인지 여부
- positive : 계수가 양수로 사용할 것인지 여부
- random_state : 난수 seed 설정
- selection : 계수의 업데이트 방법 설정 (random으로 설정하면 tol이 1e-4보다 높을 때 빠른 수렴)다항 회귀
- 데이터 전처리
import numpy as np
import matplotlib.pyplot as plt
%matplotlib inline

n = 100
x = 6 * np.random.rand(n, 1) - 3
y = 0.5 * x**2 + 1 * x + 2 + np.random.rand(n, 1)
plt.scatter(x, y, s=5)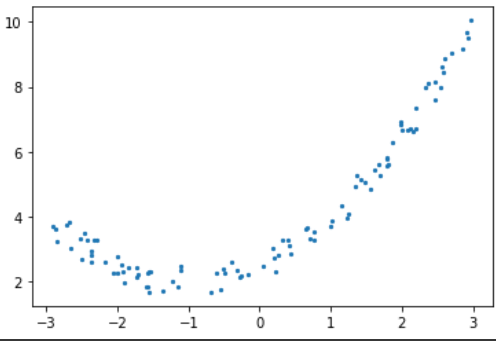
- 선형회귀 모델로 학습
from sklearn.linear_model import LinearRegression
from sklearn.preprocessing import PolynomialFeatures

# 데이터 변환 과정과 머신러닝을 연결해주는 파이프라인
from sklearn.pipeline import make_pipeline

ploy_features = PolynomialFeatures(degree=2, include_bias=False)
x_poly = ploy_features.fit_transform(x)

model = LinearRegression().fit(x_poly, y)
model_lr = make_pipeline(PolynomialFeatures(degree=2, include_bias=False),
                         LinearRegression())
model_lr.fit(x, y)- 예측한 그래프
# 다항회귀 그래프
plt.scatter(x, y, s=5)
xx = np.linspace(-3, 3, 1000)
yy = model_lr.predict(xx[:, np.newaxis])  # xx.reshape(-1, 1)과 같음
plt.plot(xx, yy)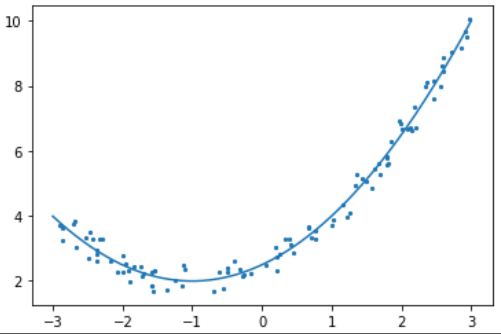
- PolynomialFeatures()
PolynomialFeatures(degree=2, *, interaction_only=False, include_bias=True) - degree : 차수
- interaction_only: True면 2차항에서 상호작용항만 출력
- include_bias : 상수항 생성 여부
-
다항 변환
-
입력값 x를 다항식으로 변환한다
x→[1,x,x2,x3,⋯]만약 열의 갯수가 두 개이고 2차 다항식으로 변환하는 경우에는 다음처럼 변환한다.
[x1,x2]→[1,x1,x2,x21,x1x2,x22]
예) [x1=0,x2=1]→[1,0,1,0,0,1]
[x1=2,x2=3]→[1,2,3,4,6,9]
-
- X 배열 생성
from sklearn.preprocessing import PolynomialFeatures
X = np.arange(6).reshape(3, 2)
X
- PolynomialFeatures() 함수 실행 결과
poly = PolynomialFeatures(2)
poly.fit_transform(X)
# 다항차수는 적용하지 않고, 오직 상호작용(교호작용) 효과만을 분석하려면
# interaction_only=True 옵션을 설정해주면 됩니다.
# degree를 가지고 교호작용을 몇 개 수준까지 볼지 설정해줄 수 있습니다.

poly = PolynomialFeatures(2, interaction_only=True)
poly.fit_transform(X)
Linear , Ridge , Lasso , ElasticNet 비교
| 구분 | Ridge | Lasso | ElasticNet |
|---|---|---|---|
| 제약식 | L2 Norm | L1 Norm | L1+L2 Norm |
| 변수선택 | 불가능 | 가능 | 가능 |
| solution | closed form | 명시해 없음 | 명시해 없음 |
| 장점 | 변수간 상관관계가 높아도 좋은 성능 | 변수간 상관관계가 높으면 낮은 성능 | 변수간 상관관계를 반영한 정규화 |
| 특징 | 크기가 큰 변수를 우선적으로 줄임 | 비중요 변수를 우선적으로 줄임 | 상관관계가 큰 변수를 동시에 선택/배제 |
- 데이터 가져와서 그래프로 나타내기
import seaborn as sb

np.random.seed(0)
n_samples = 30
X = np.sort( np.random.rand(n_samples) )
y = np.sin(2 * np.pi * X) + np.random.rand(n_samples) * 0.1
plt.scatter(X, y)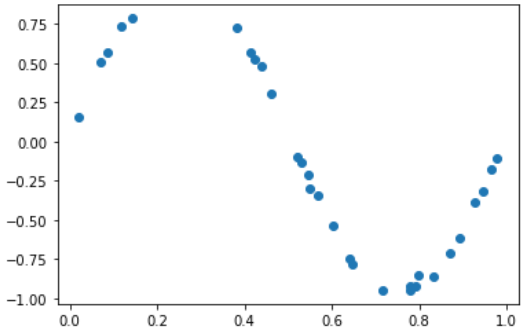
- Linear Regression 적용 결과
model_lr = make_pipeline(PolynomialFeatures(9), LinearRegression())
model_lr.fit(X.reshape(-1, 1), y)
print( model_lr.steps[1][1].coef_ )

xx = np.linspace(0, 1, 1000)
y_pred = model_lr.predict( xx.reshape(-1, 1) )
plt.plot(xx, y_pred)
plt.scatter(X, y)
plt.ylim(-1.5, 1.5)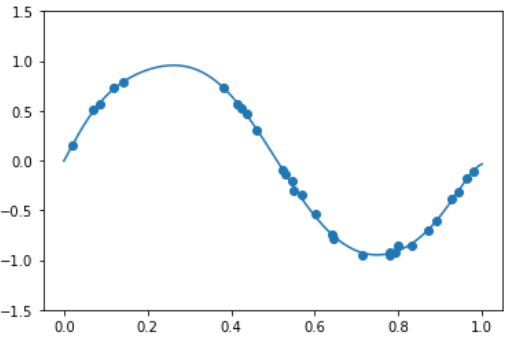
- Ridge Regression 적용 결과
model_lr = make_pipeline(PolynomialFeatures(9), Ridge(alpha=0.01))
model_lr.fit(X.reshape(-1, 1), y)
print( model_lr.steps[1][1].coef_ )

xx = np.linspace(0, 1, 1000)
y_pred = model_lr.predict( xx.reshape(-1, 1) )
plt.plot(xx, y_pred)
plt.scatter(X, y)
plt.ylim(-1.5, 1.5)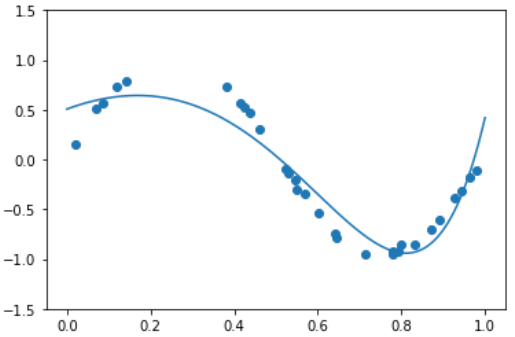
- Lasso Regression 적용 결과
model_lr = make_pipeline(PolynomialFeatures(9), Lasso(alpha=0.01))
model_lr.fit(X.reshape(-1, 1), y)
print( model_lr.steps[1][1].coef_ )

xx = np.linspace(0, 1, 1000)
y_pred = model_lr.predict( xx.reshape(-1, 1) )
plt.plot(xx, y_pred)
plt.scatter(X, y)
plt.ylim(-1.5, 1.5)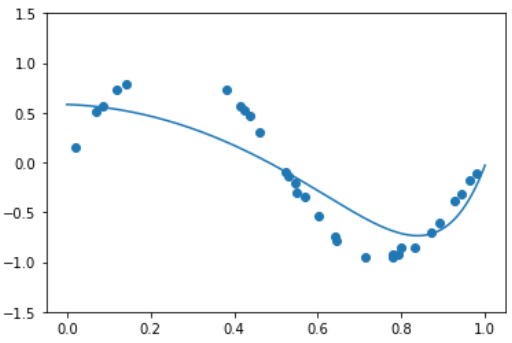
- ElasticNet Regression 적용 결과
model_lr = make_pipeline(PolynomialFeatures(9), ElasticNet(alpha=0.01, l1_ratio=0.5))
model_lr.fit(X.reshape(-1, 1), y)
print( model_lr.steps[1][1].coef_ )

xx = np.linspace(0, 1, 1000)
y_pred = model_lr.predict( xx.reshape(-1, 1) )
plt.plot(xx, y_pred)
plt.scatter(X, y)
plt.ylim(-1.5, 1.5)