이번 포스팅에서는 구조화된 데이터의 처리를 지원하는 라이브러리인 pandas에 대한 내용과 다루는 방법에 대하여 정리를 해 보았습니다.
pandas(panel data)
- pandas는 왜 사용할까?
- 고성능 array계산 라이브러리인 numpy와 통합하여, 강력한 "스프레드시트"처리 기능
- 인덱싱, 연산용 함수, 전처리 함수등을 제공함
- 데이터 처리 및 통계 분석시 유용하게 사용
pandas 사용법 및 특징
데이터 로딩 방법
#sep : 정규식 표현을 통한 데이터 분리
#header : column미지정
df_data = pd.read_csv(
    "csv자원 경로", sep="\s+", header=None
)

# 컬럼의 이름 지정
df_data.columns = ["col1", "col2", "col3"]
#데이터들을 가져올 수 있음(타입은 ndarray형식)
df_data.values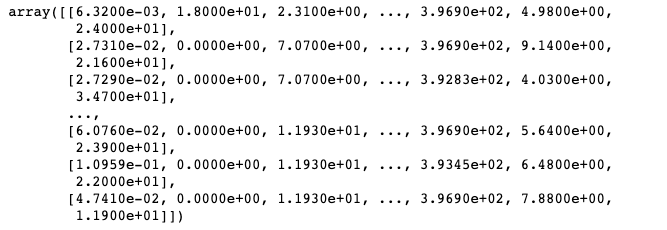
- dataFrame은 Series(하나의 컬럼)들의 집합으로 이뤄져 있다.
- series는 column vector를 표현하는 object이다.
- index로 접근하여 값 변경이 가능
#선언방식
example_obj = Series()

list_data = [1, 2, 3, 4, 5]
example = Series(data=list_data) #데이터와 인덱싱이 숫자 혹은 문자로 지정이 가능

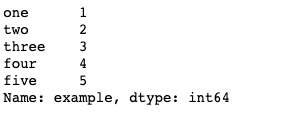
list_data = [1, 2, 3, 4, 5]
list_name = ["one", "two", "three", "four", "five"]
example = Series(data=list_data, index=list_name,name="example_data")

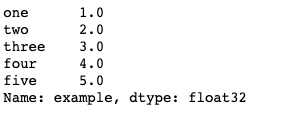
dict_data = {"one": 1, "two": 2, "three": 3, "four": 4, "five": 5}
example = Series(dict_data, dtype=np.float32, name="example_data")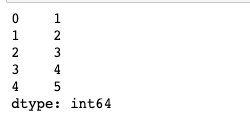
# 값 할당 및 타입 지정 가능
example["one"] = 11

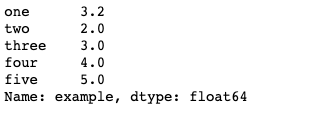
example = example_obj.astype(float)
example["one"] = 3.2

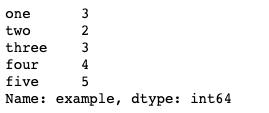
example = example_obj.astype(int)
example["one"] = 3.2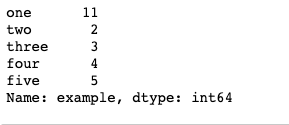
#값, 인덱스 정보 가져오기
example.values

example.index

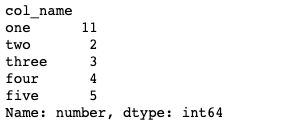
#이름과 column이름 지정 가능
example.name = "number" #이름 지정
example.index.name = "col_name" #컬럼 이름 지정

- dataFrame: Series로 이뤄진 Column들의 Data Table전체를 포함하는 Object
dict_data_1 = {"a": 1, "b": 2, "c": 3, "d": 4, "e": 5}
#시리즈 데이터는  인덱스가 기준!
indexes = ["a", "b", "c", "d", "e", "f", "g", "h"] # 지정 인덱스 수가 많으면 NaN으로 채워줌
series = Series(dict_data_1, index=indexes)
dataFrame의 생성
from pandas import DataFrame
raw_data = {
    "first_name": ["kim", "lee", "park"],
    "last_name": ["t1", "t2", "t3"],
    "age": [20, 30, 40],
    "city": ["city1", "city2", "city3"],
}
df = DataFrame(raw_data, columns=["first_name", "last_name", "age", "city"])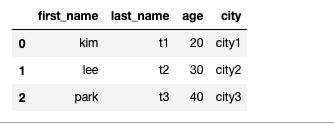
DataFrame(raw_data, columns=["age", "city"])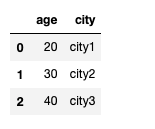
#칼럼 기준으로 가져올 때 없으면 NaN값을 채워 가져옴
DataFrame(raw_data, columns=["first_name", "last_name", "age", "city", "debt"])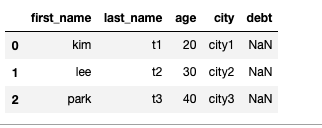
DataFrame을 Series형태로 가져오기
print(df.first_name)
print(type(df.first_name))
loc, iloc(Series, DataFrame에서 사용이 가능)
- loc - index location, iloc - index position
- loc은 이름 즉, 원소의 데이터를 기준으로 판단하여 가져오게 되고 iloc은 index number을 기준으로 데이터를 가져오게 된다.
s = pd.Series(np.nan, index=[9,8,7,6,5,4,3,2,1])

s.loc[:3]
s.iloc[:3]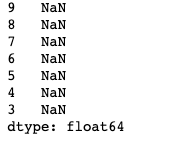

- 조건에 맞는 Series를 다음과 같이 boolean의 형태로써 가져 올 수 있다.
df.age > 3
DataFrame에 Series추가하기
values = Series(data=["a", "b"], index=[0, 1])

df["append"] = values #values에 없는 인덱스에 데이터에는 NaN이 들어가 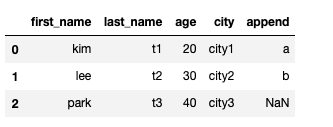
DataFrame의 Transformation
df.head(3).T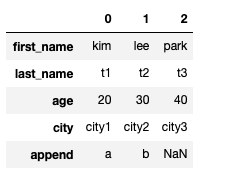
DataFrame의 데이터 삭제 방법
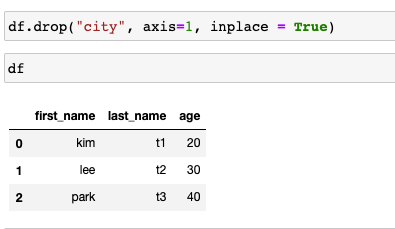
- 1, drop: 해당 데이터를 뺀 데이터만 리턴(asix를 통한 데이터 삭제 가능 - 0: 행삭제, 1: 열삭제, inpace 파라미터 사용시 df자체가 변화)
- 2, del : 메모리 자체가 삭제
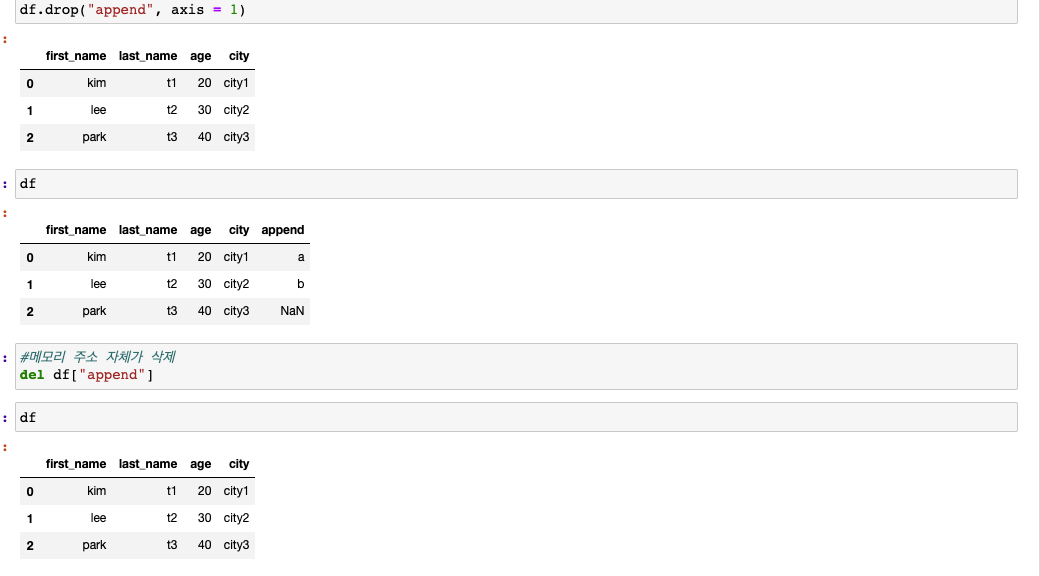
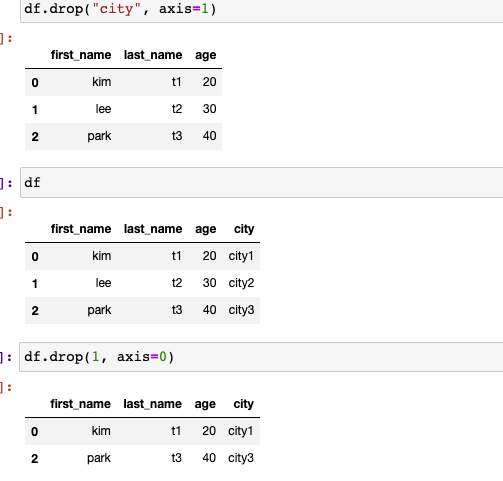
DataFrame의 데이터 접근 방법
- 1, loc, iloc을 이용하는 방법
- 2, 2차원 list접근 방식으로 접근 가능 단, 접근 방식이 다름(인덱스 표현에 상관없이 수가 들어가는 곳은 row, column명이 들어가는 곳은 column으로 슬라이싱) - 단, iloc, loc쓸때는 순서가 있음(row, col순으로)
raw_data = {
    "first_name": ["kim", "lee", "park"],
    "last_name": ["t1", "t2", "t3"],
    "age": [20, 30, 40],
    "city": ["city1", "city2", "city3"],
}

df[["first_name","last_name"]].head(3)

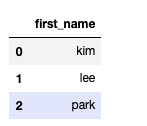
# 값으로 넣으면 시리즈, 벡터로 넣으면 데이터 프레임으로 나옴
df["first_name"].head(3)

df[["first_name"]].head(3)

df[:2]

df.iloc[2]

df['first_name'][:2]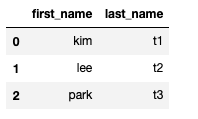



age_series = df['age']
age_series[[0,1]]

# Series에 boolean index를 통해서 데이터를 뽑아 올 수 있음
age_series[age_series < 25]

# fancy index 이용
age_serires[list(range(0, 2))]


df.loc[[0,2], ["age"]]

df.iloc[:2, :3]

DataFrame의 인덱스 재설정
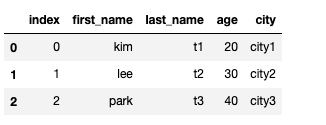
- index를 통한 변경
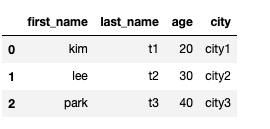
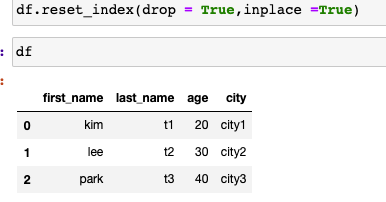
- reset_index를 통한 변경(inpace 파라미터 사용시 df자체가 변화)
df.index = list(range(3,0,-1))

df.reset_index()

#drop파라미터 사용시 기존 인덱스 삭제
df.reset_index(drop = True)

#df자체 변화
df.reset_index(drop = True,inplace =True)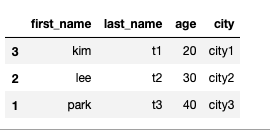
DataFrame, Series간의 연산 기능
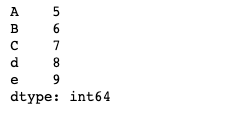
s1 = Series(range(1,6), index = list("abcde"))
s2 = Series(range(5,10), index = list("ABCde"))

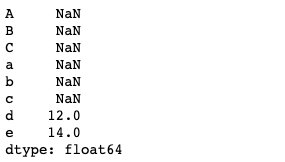
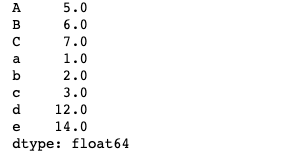
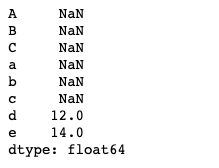
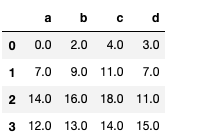
#같은 인덱스를 기준으로 연산이 수행되고
#fill_value파라미터를 이용하면
#인덱스 값이 존재하지 않는 DataFrame에 대하여 값을 채우고
#수행이 됨
s1.add(s2)
s1.add(s2, fill_value = 0)

s1 + s2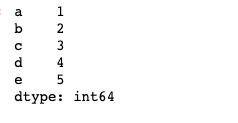
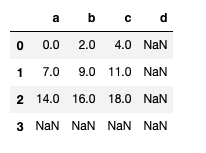
df1 = DataFrame(np.arange(9).reshape(3, 3), columns=list("abc"))
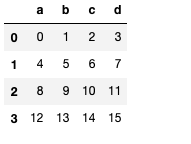
df2 = DataFrame(np.arange(16).reshape(4, 4), columns=list("abcd"))

df1 + df2
df1.add(df2, fill_value = 0)
df1.mul(df2, fill_value = 0)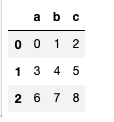
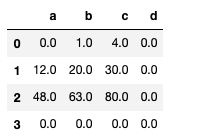
# series 와 dataframe의 연산
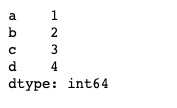
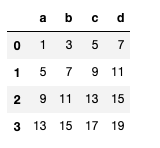
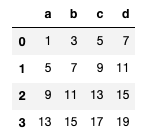
df = DataFrame(np.arange(16).reshape(4, 4), columns=list("abcd"))
s = Series(np.arange(1, 5), index=list("abcd"))

df + s
df.add(s, axis = 1)
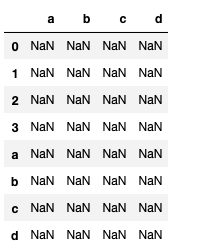
#인덱스가 일치하지 않아 NaN으로 채워져 리턴
df.add(s, axis = 0)

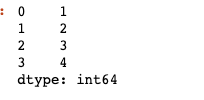
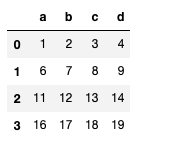
s = Series(np.arange(1, 5), index= range(4))
df.add(s, axis = 0)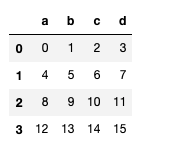
lambda, map의 사용
- map을 이용하여 원소의 값, 타입 변화 가능(lambda 이용, function이용, dictionary이용,Series이용 가능) - map은 Series, DataFrame전체는 apply사용
- DataFrame에서 column접근 후 값 변경 가능
s1 = Series(np.arange(10))

# s1메모리 자체의 값이 변하지는 않음
s1.map(lambda x : x**2).head(5) #lambda이용

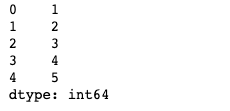
def func(x):
    return x + 1

s1.map(func).head(5) #function 이용

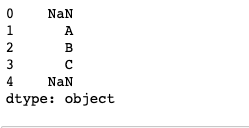
#dictionary이용
z = {1: 'A', 2: 'B', 3: 'C'}
s1.map(z).head(5) # dict 타입으로 데이터 교체, 없는 값은 NaN

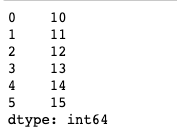
#Series이용
s2 = Series(np.arange(10,20))
s1.map(s2).head(6)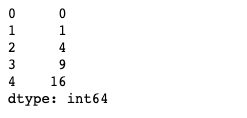
raw_data = {
    "first_name": ["kim", "lee", "park"],
    "last_name": ["t1", "t2", "t3"],
    "age": [20, 30, 40],
    "city": ["city1", "city2", "city2"],
}
df = pd.DataFrame(raw_data, columns=["first_name", "last_name", "age", "city"])

df.city.map({"city1" : 'a', "city2": 2})
unique
- column값들 중에서 유일한 값만 가져옴raw_data = {
"first_name": ["kim", "lee", "park"],
"last_name": ["t1", "t2", "t3"],
"age": [20, 30, 40],
"city": ["city1", "city2", "city2"],
}
df = pd.DataFrame(raw_data, columns=["first_name", "last_name", "age", "city"])
df.city.unique()
replace
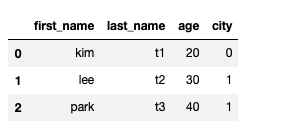
- map대신 replace를 사용해 주워 column값을 변형할 수 있다(implace를 사용하여 DataFrame자체 변화 가능)
df.city.replace({"city1" : 'a', "city2": 2}).head()

df.city.replace(["city1", "city2"], [0,1], inplace= True)
apply
- map과 달리 Series전체에 해당 함수 적용
raw_data = {
    "one": [1, 2, 3],
    "two": [10, 20,30],
    "three": [100, 200, 300]
}
df = pd.DataFrame(raw_data, columns=["one", "two", "three"])

f = lambda x: x.max() - x.min()
df.apply(f)

f = lambda x: np.mean(x)
df.apply(f)

df.apply(np.mean)

df.apply(sum)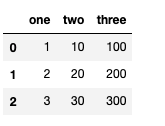


def f(x):
    return Series(
        [x.min(), x.max(), x.mean(), sum(x.isnull())],
        index=["min", "max", "mean", "null"],
    )


df.apply(f)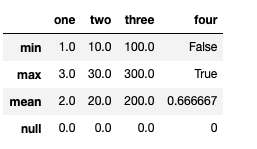
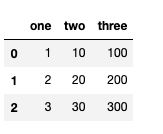
applymap
- Series간위가 아닌 elemen단위로 함수를 적용
f = lambda x : -x
df.applymap(f).head(5)

f = lambda x : -x
df['one'].apply(f).head(5)
describe
- numeric type 데이터의 요약 정보를 보여줌
df.describe()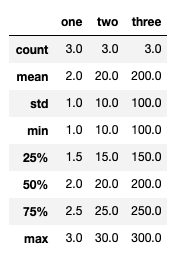
isnull
- NaN인지 아닌지 보여줌
df.isnull()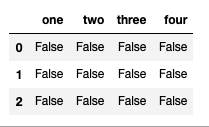
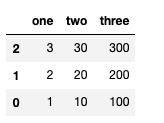
sum, sort_values
- sum : 합을 도출(axis로 기준 축 설정 가능)
- sort_value : column별로 값 정렬
df.sum()

df.sum(axis = 0) # 행을 기준으로

df.sum(axis = 1) # 열을 기준으로

df.sort_values(['one','two'],ascending = False).head(10)


corr, cov,corrwith
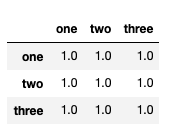
- corr : 두 값의 상관관계를 도출
- cov : rhdqnstks
- corrwith : 한 값을 기준으로 나머지의 전체값의 상관관계
df.one.corr(df.two) # 두 값의 상관관계

df.one.cov(df.two) # 공분산

df.corrwith(df.two) #two와 나머지의 전체값의 상관관계

df.corr() # 모든 상관관계를 보여줌


panda 정보 갯수 지정
- DataFrame의 보고싶은 정보의 갯수 지정 가능
#row가 잘리는 현상 방지
pd.options.display.max_rows = 2000
Reference
Naver BoostCamp AI Tech - edwith 강의
https://m.blog.naver.com/PostView.nhn?blogId=acornedu&logNo=220934409189&proxyReferer=https:%2F%2Fwww.google.com%2F
