
1. Google Charts 접속
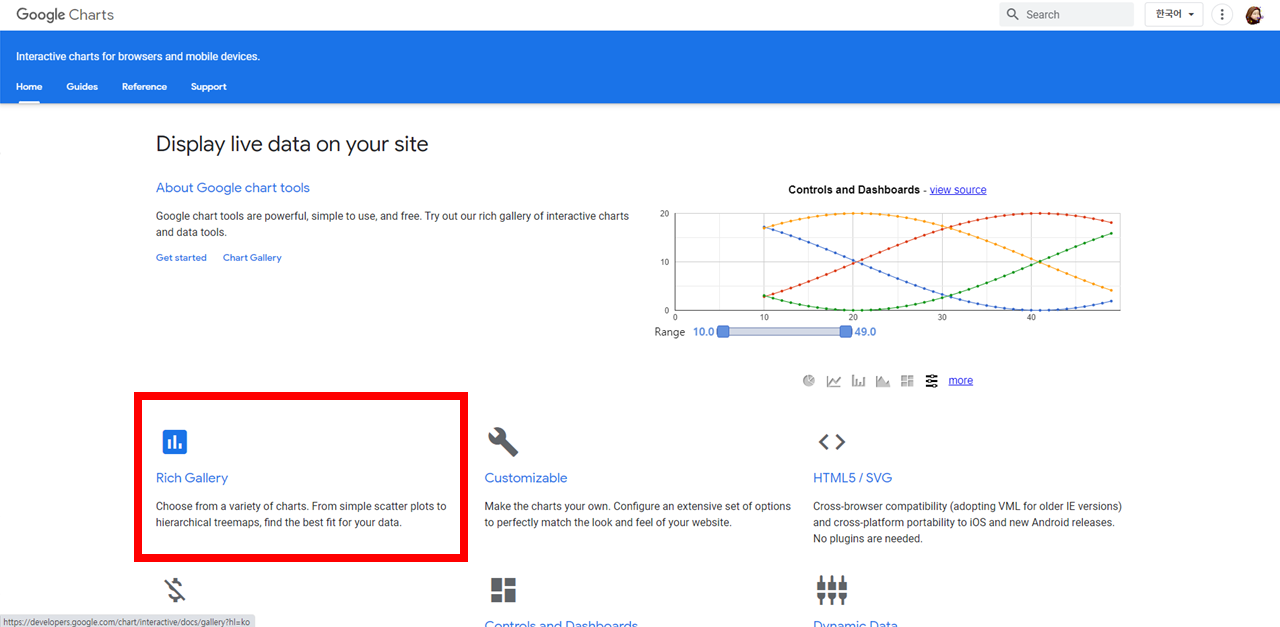
2. Rich Gallery 클릭
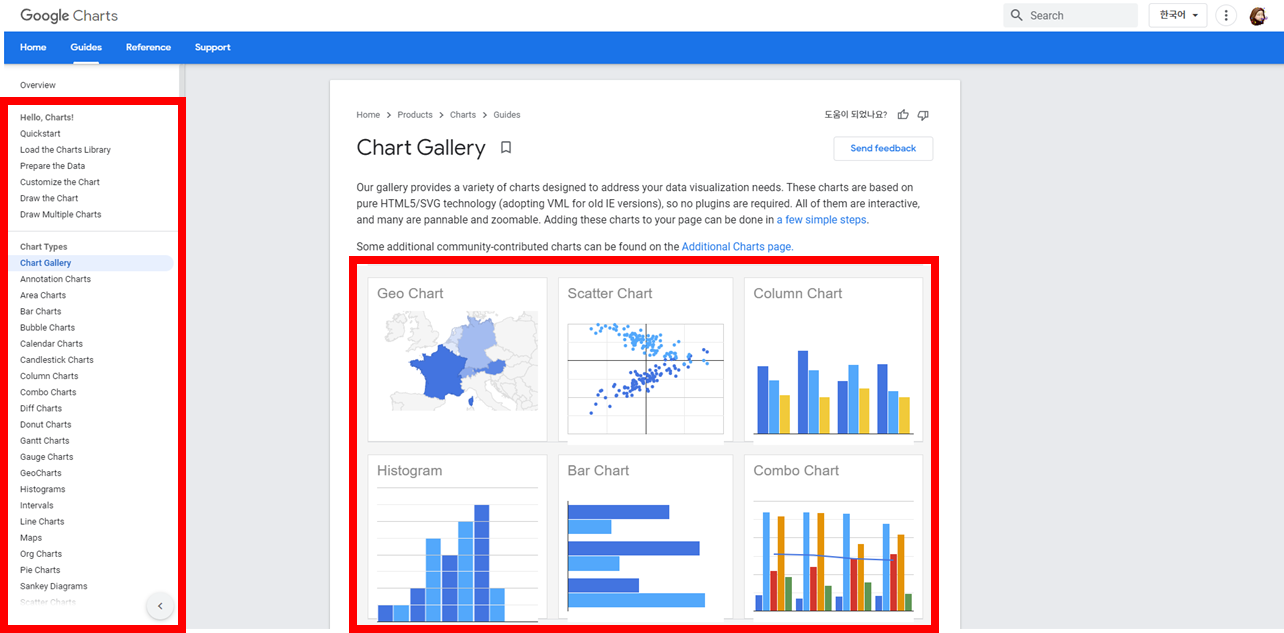
3. 원하는 형식의 차트 선택
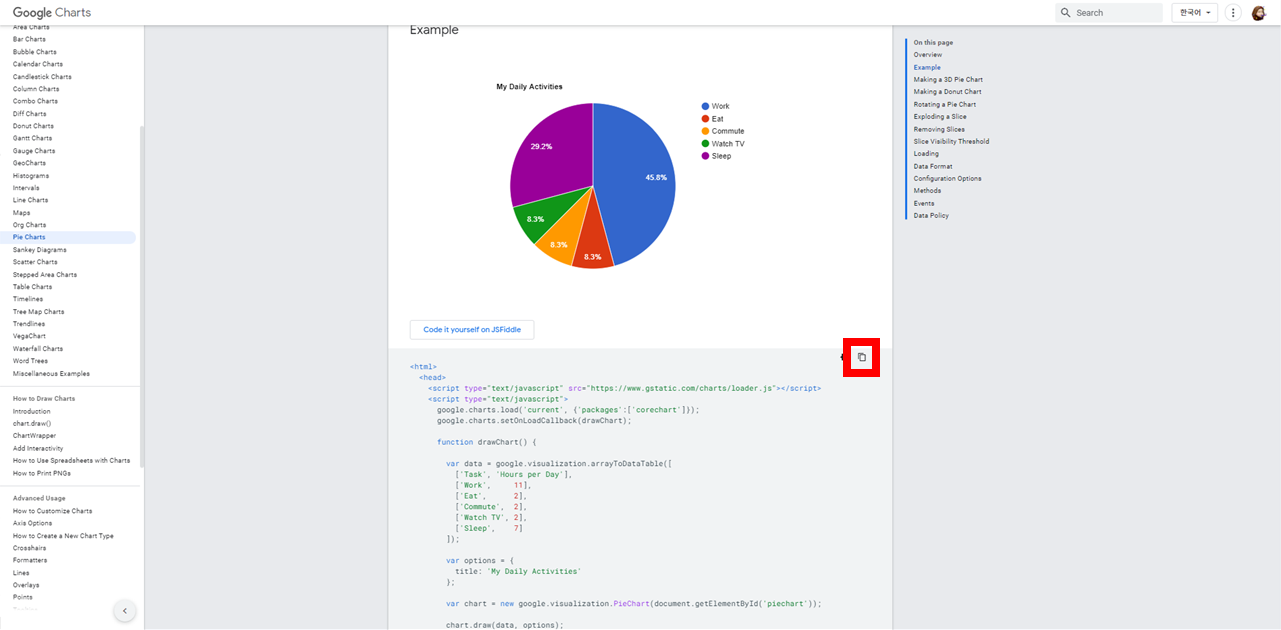
4. 적용 예시 확인 후 js코드 복사
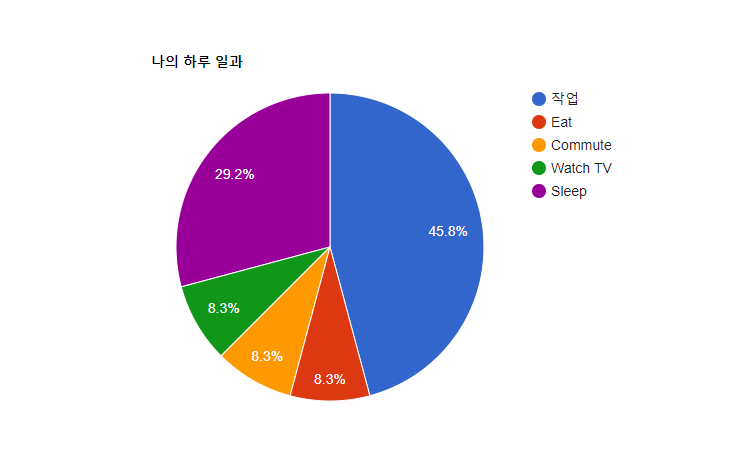
5. 코드 분석
<!DOCTYPE html>
<html>
  <head>
    <script type="text/javascript"
    src="https://www.gstatic.com/charts/loader.js"></script>


    <script type="text/javascript">
      //google에서 기본 차트 관련된 package(모듈)명
      //chart 종류에 따라서 google 개발 문서 참조 필수
      google.charts.load('current', {'packages':['corechart']});
      google.charts.setOnLoadCallback(drawChart);

      function drawChart() {
        //2차원 배열로 데이터 처리
        var data = google.visualization.arrayToDataTable([
          ['Task', 'Hours per Day'],
          ['작업',     11], //원하는대로 데이터 내용 바꾸어 사용
          ['Eat',      2],
          ['Commute',  2],
          ['Watch TV', 2],
          ['Sleep',    7]
        ]);

        /* options 변수명은 다른 변수명으로 선언 및 사용 가능
           title 속성 : 구글 차트에서 title로 사용되는 정보이기 때문에 속성명 수정 불가, 구글 차트가 제공하는 이름
        */
        var options = {
          title: '나의 하루 일과'
        };

        //어떤 위치에 chart를 표현할 것인지에 대한 html tag 정보 반영
        //<div id="piechart" style="width: 900px; height: 500px;"></div>
        var chart = new google.visualization.PieChart(document.getElementById('piechart'));

      	//data와 option값을 적용하여 chart 그리기
        chart.draw(data, options);
      }
    </script>
  </head>
  <body>
    <div id="piechart" style="width: 900px; height: 500px;"></div> //pieChart가 적용되는 위치
  </body>
</html>
6. 코드 응용(보이기, 숨기기 버튼)
보기버튼과숨기기버튼 추가보기를 누르면 버블차트가 보이고,숨기기버튼 누르면 버블차트가 다시 숨겨짐div.style.display="block"과div.style.display="none"활용- 주의🔥) google chart에서 코드를 복사해오면 script 코드가 head에 위치
→ addEventLister() 함수 활용시, 이 기능을 등록 받을 tag가 먼저 실행되어 객체로 존재해야함
→ script단을 body 아래로 내려주어야 함
<!DOCTYPE html>
<html>
  <head>
    <script
      type="text/javascript"
      src="https://www.gstatic.com/charts/loader.js"
    ></script>
  </head>
  <body>
    //body 출력 부분
    <h3>버블 차트</h3>
    <hr />

    //보기 버튼과 숨기기 버튼
    <button id="bubble">보기</button> - <button id="hide">숨기기</button>
    <div id="series_chart_div" style="width: 900px; height: 500px"></div>

    //script단
    <script type="text/javascript">
      google.charts.load("current", { packages: ["corechart"] });

      document
        .querySelector("#bubble")
        .addEventListener("click", bubbleChartView);
      document
        .querySelector("#hide")
        .addEventListener("click", bubbleChartHide);

      function bubbleChartView() {
        document.getElementById("series_chart_div").style.display = "block"; //적용할 객체가 하나일 때 주로 사용
        //document.querySelector("#series_chart_div").style.display = "block"; //여러 개에 한번에 적용할 때 주로 사용
        google.charts.setOnLoadCallback(drawSeriesChart);
      }

      function bubbleChartHide() {
        document.getElementById("series_chart_div").style.display = "none";
        //document.querySelector("#series_chart_div").style.display = "none";
      }

      function drawSeriesChart() {
        var data = google.visualization.arrayToDataTable([
          ["ID", "Life Expectancy", "Fertility Rate", "Region", "Population"],
          ["CAN", 80.66, 1.67, "North America", 33739900],
          ["DEU", 79.84, 1.36, "Europe", 81902307],
          ["DNK", 78.6, 1.84, "Europe", 5523095],
          ["EGY", 72.73, 2.78, "Middle East", 79716203],
          ["GBR", 80.05, 2, "Europe", 61801570],
          ["IRN", 72.49, 1.7, "Middle East", 73137148],
          ["IRQ", 68.09, 4.77, "Middle East", 31090763],
          ["ISR", 81.55, 2.96, "Middle East", 7485600],
          ["RUS", 68.6, 1.54, "Europe", 141850000],
          ["USA", 78.09, 2.05, "North America", 307007000],
        ]);

        var options = {
          title:
            "Fertility rate vs life expectancy in selected countries (2010)." +
            " X=Life Expectancy, Y=Fertility, Bubble size=Population, Bubble color=Region",
          hAxis: { title: "Life Expectancy" },
          vAxis: { title: "Fertility Rate" },
          bubble: { textStyle: { fontSize: 11 } },
        };

        var chart = new google.visualization.BubbleChart(
          document.getElementById("series_chart_div")
        );
        chart.draw(data, options);
      }
    </script>
  </body>
</html>

사부작 사부작