
개요
지난번 포스팅까지는 각 소프트웨어의 Metrics 정보를 수집하였습니다.
이번 포스팅에서는 각 소프트웨어가 설치된 VM Metrics 정보를 수집하는 작업을 진행합니다.
1. Node Exporter 설치
가장 먼저 VM metrics 수집을 위한 Node Exporter 설치가 필요합니다.
Redis Server 연결을 예시로 설명하고자 합니다.
Node Exporter 설치
가장 먼저 Node Exporter를 설치해야 합니다.
wget https://github.com/prometheus/node_exporter/releases/download/v1.3.1/node_exporter-1.3.1.linux-amd64.tar.gz;
tar xvfz node_exporter-1.3.1.linux-amd64.tar.gz;
mv node_exporter-1.3.1.linux-amd64 vm_node_exporter;
Node Exporter 서비스 등록
Service 파일 생성
- /etc/systemd/system/vm-exporter.service
[Unit]
Description=Prometheus VM Exporter
After=network.target

[Service]
User=root
Group=root
Type=simple
Restart=always
ExecStart=${Node Exporter 경로}/node_exporter \
--web.listen-address=0.0.0.0:9100

[Install]
WantedBy=multi-user.target
Service 등록 및 실행
   sudo systemctl daemon-reload
   sudo systemctl enable --now vm-exporter.service
Node Exporter 동작 확인
-
systemctl 명령어
sudo systemctl status vm-exporter.service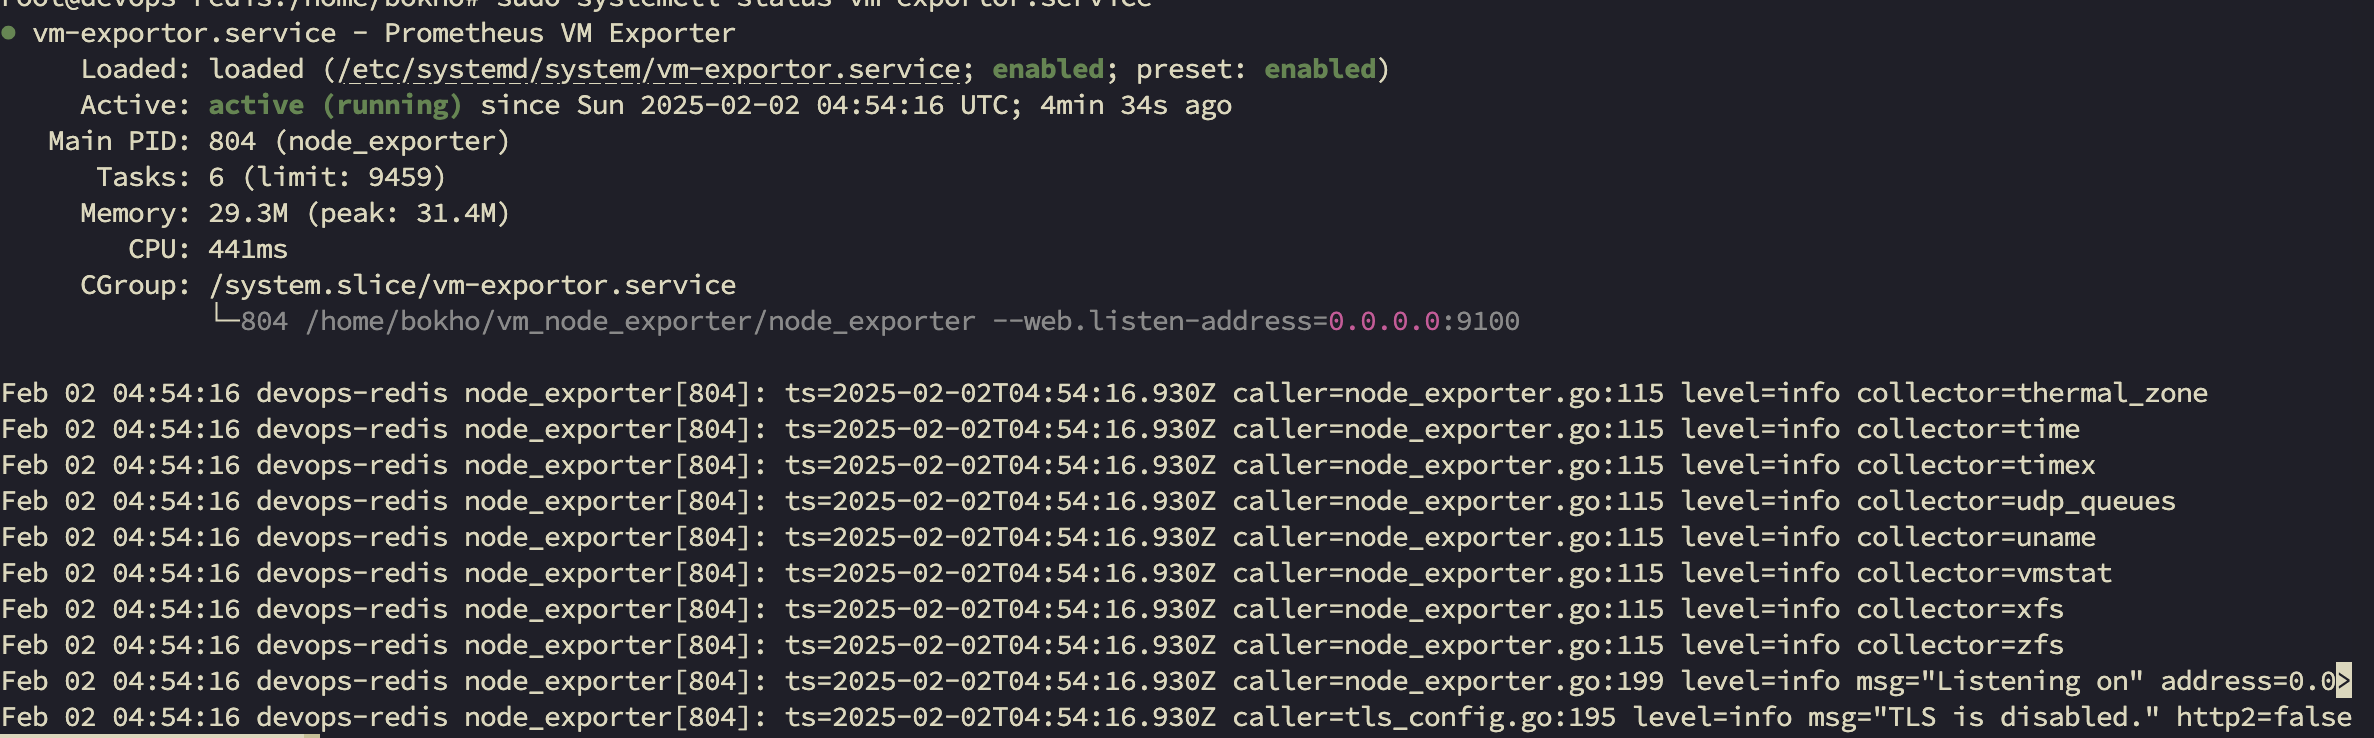
-
netstat 명령어
- 9100 Port LISTEN 확인
netstat -tnlp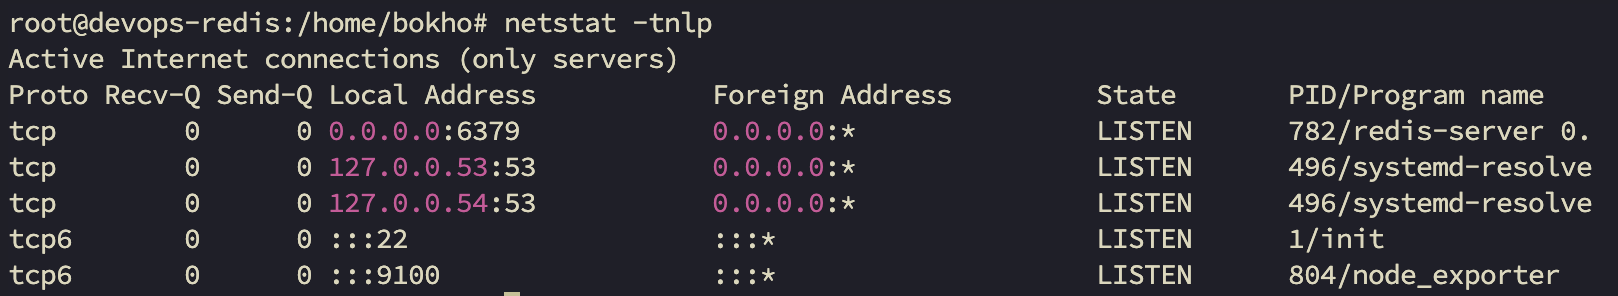
2. Prometheus 연동
각 VM 별로 Node Exporter 설치 및 실행이 완료되었다면 이제 Prometheus 설정이 필요합니다.
VM Prometheus 설정
우선 /etc/prometheus/prometheus.yml 에 각 VM 설정 작업을 추가해야 합니다.
scrape_configs:

# 아래 내용 추가
- job_name: 'redis-server-vm'
  static_configs:
   - targets: ['${redis_server_ip}:9100']
Prometheus 재기동
설정이 완료되었다면 Prometheus를 재기동 합니다.
    systemctl restart prometheus
    systemctl status prometheus
Prometheus 동작 확인
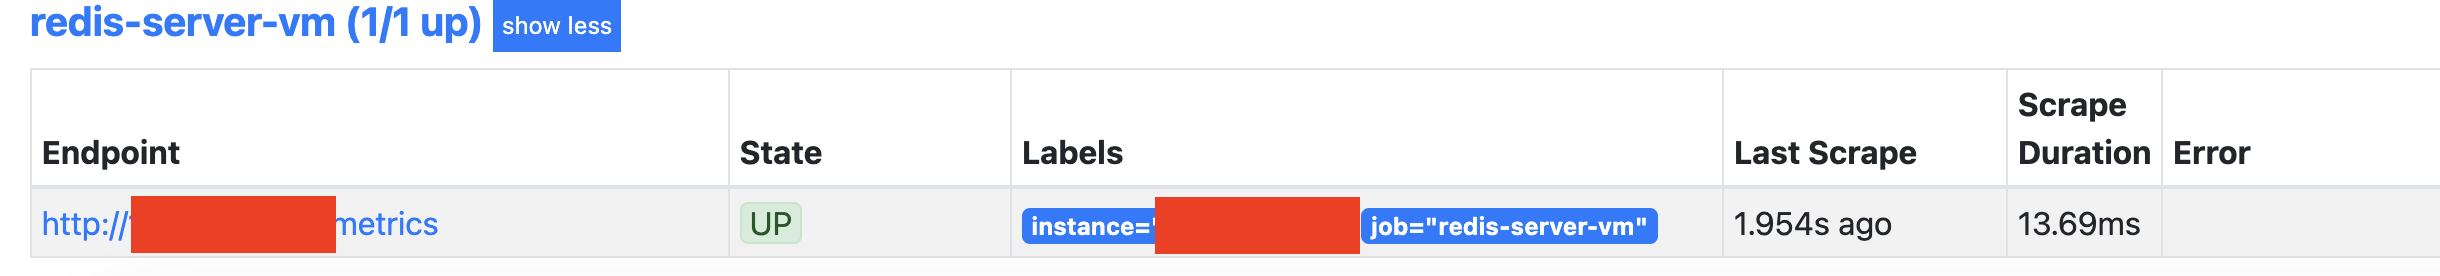
Prometheus를 재기동 하였다면 브라우저로 접근하여 연결 되었는지 확인이 필요합니다.
- http://${prometheus_server_ip}:9090/classic/targets
- endpoint에 state 가 Up인지 확인한다
3. Grafana VM 연동
대시보드 선택
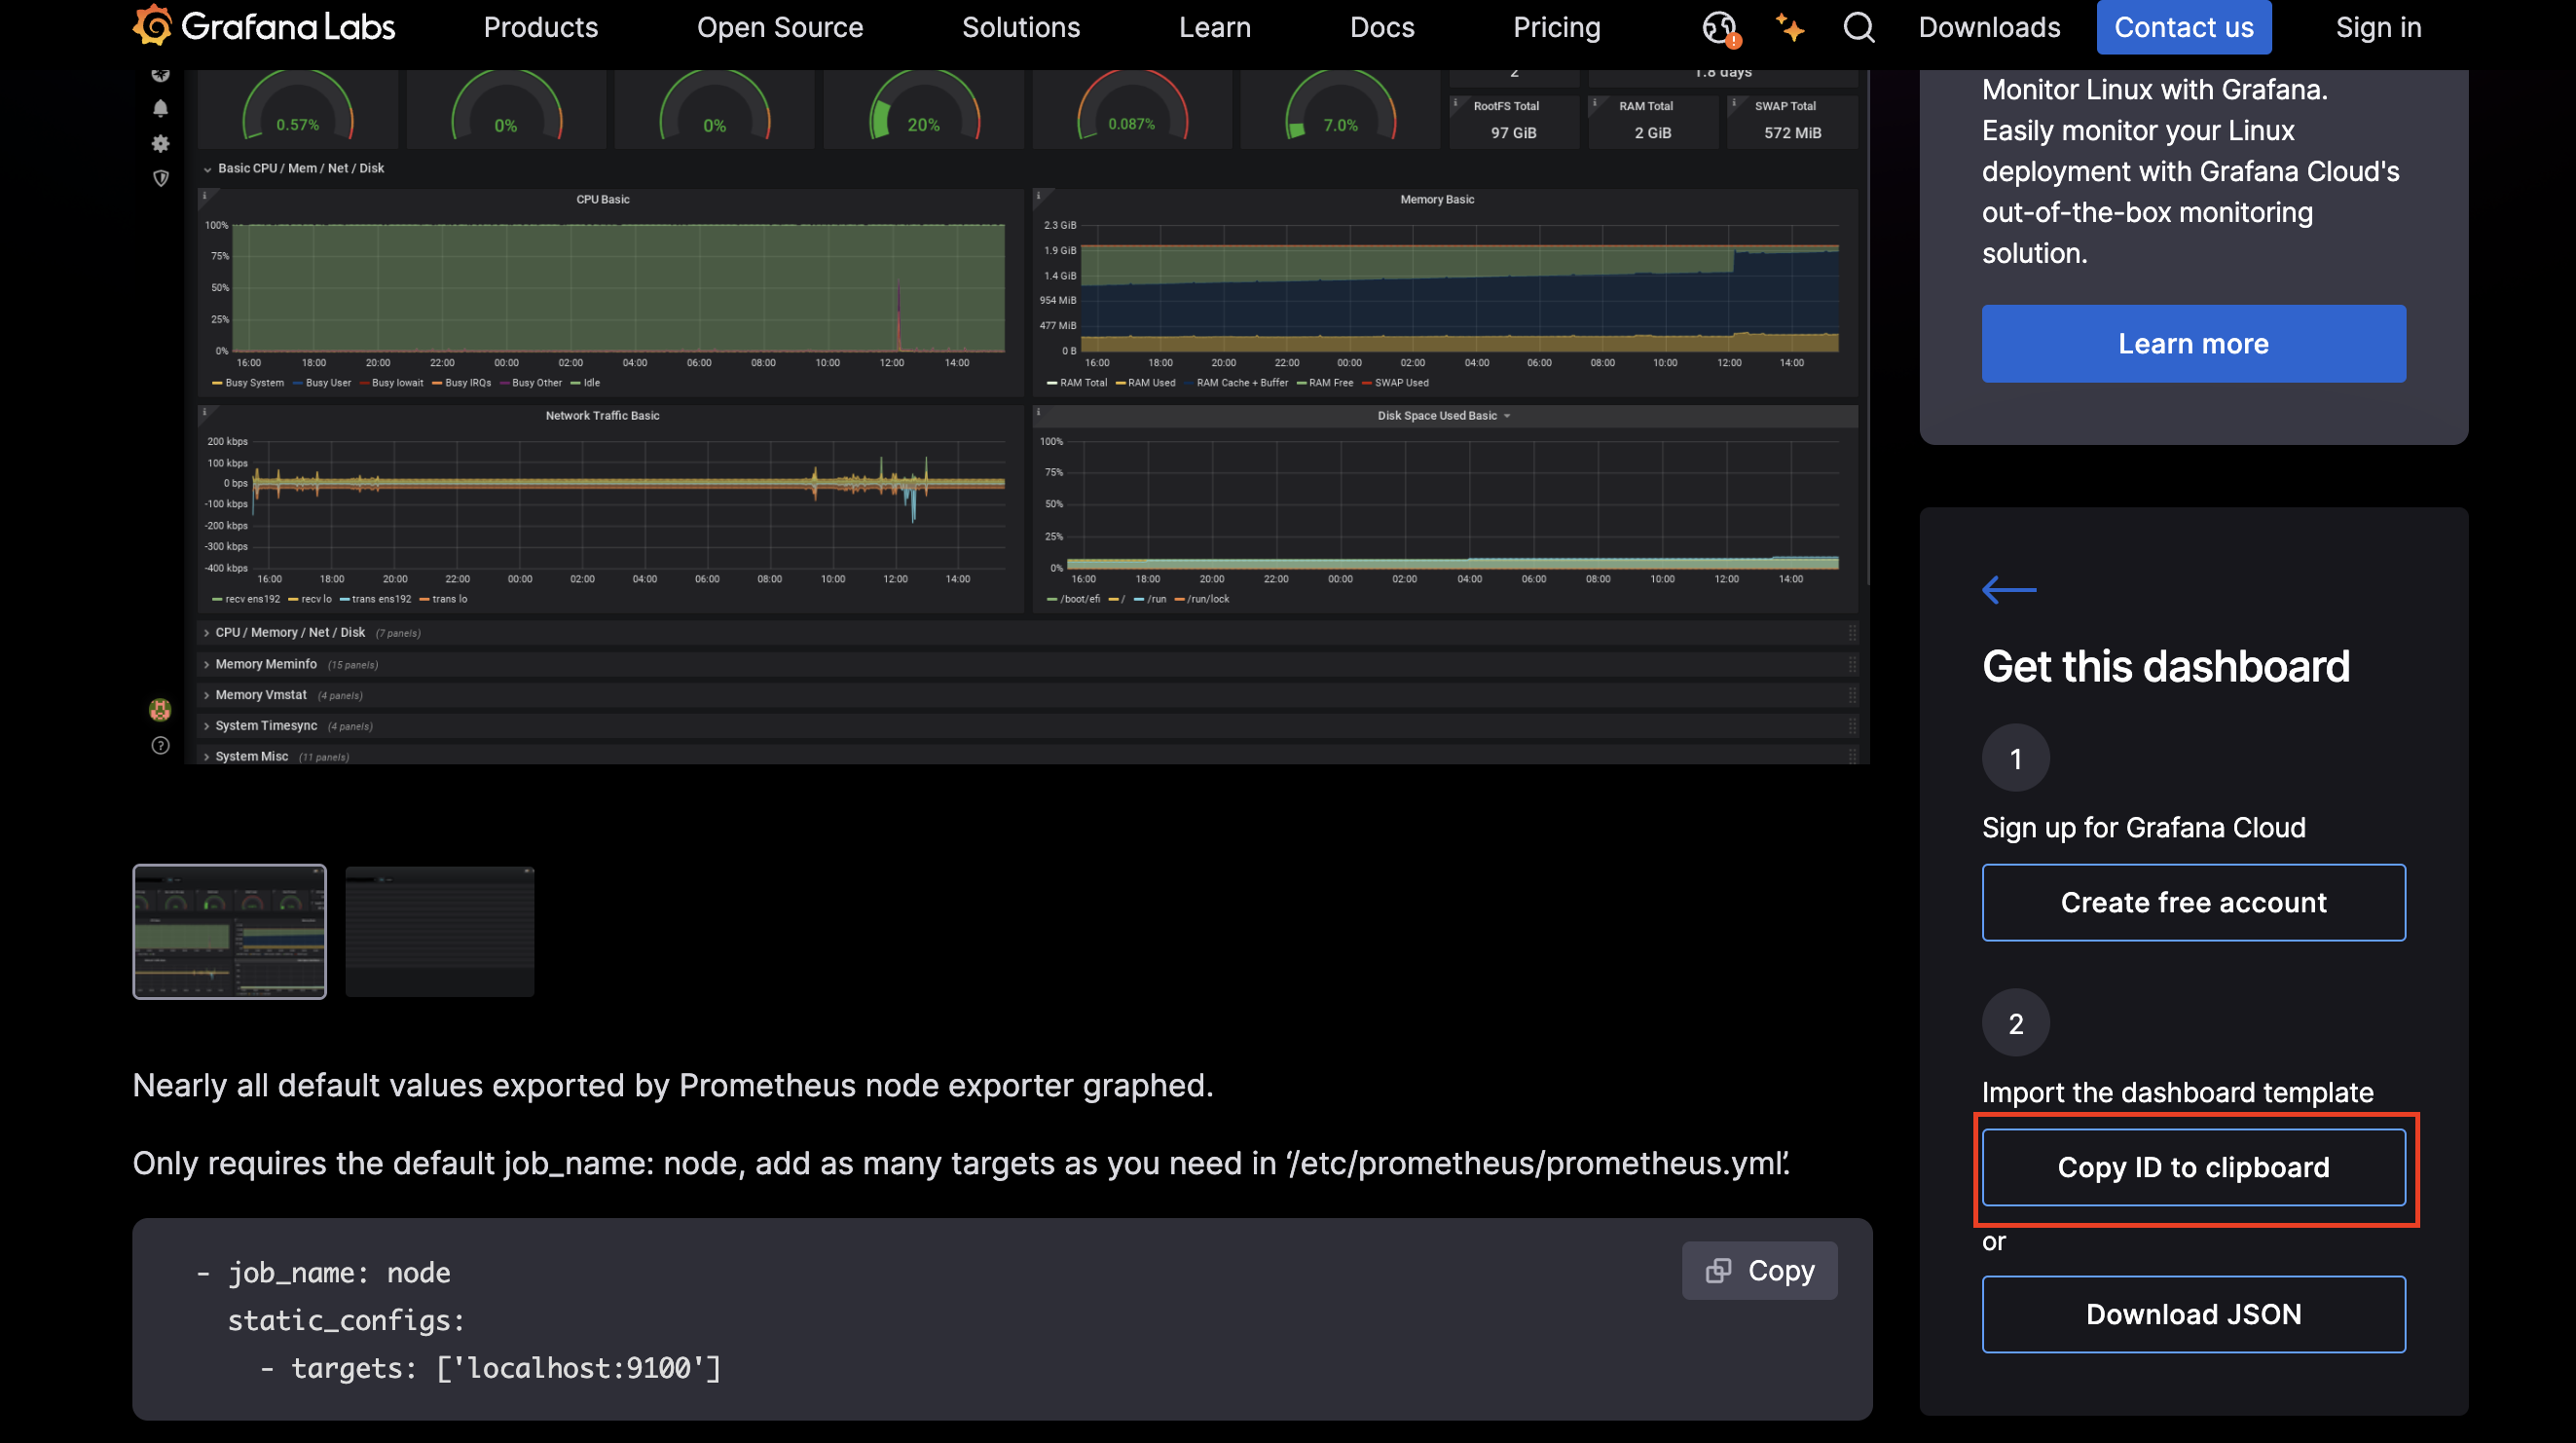
다른 대시보드와 마찬가지로 직접 구현할 수도 있으나 아래 사이트 들어가서 VM Exporter 관련 테마를 검색한 후 나에게 맞는 테마를 선택하였습니다.
- 대시보드 검색 : https://grafana.com/grafana/dashboards/
- 대시보드 선택 : https://grafana.com/grafana/dashboards/1860-node-exporter-full/
- 우측 하단에 Dashboard ID copied! 클릭
대시보드 구성
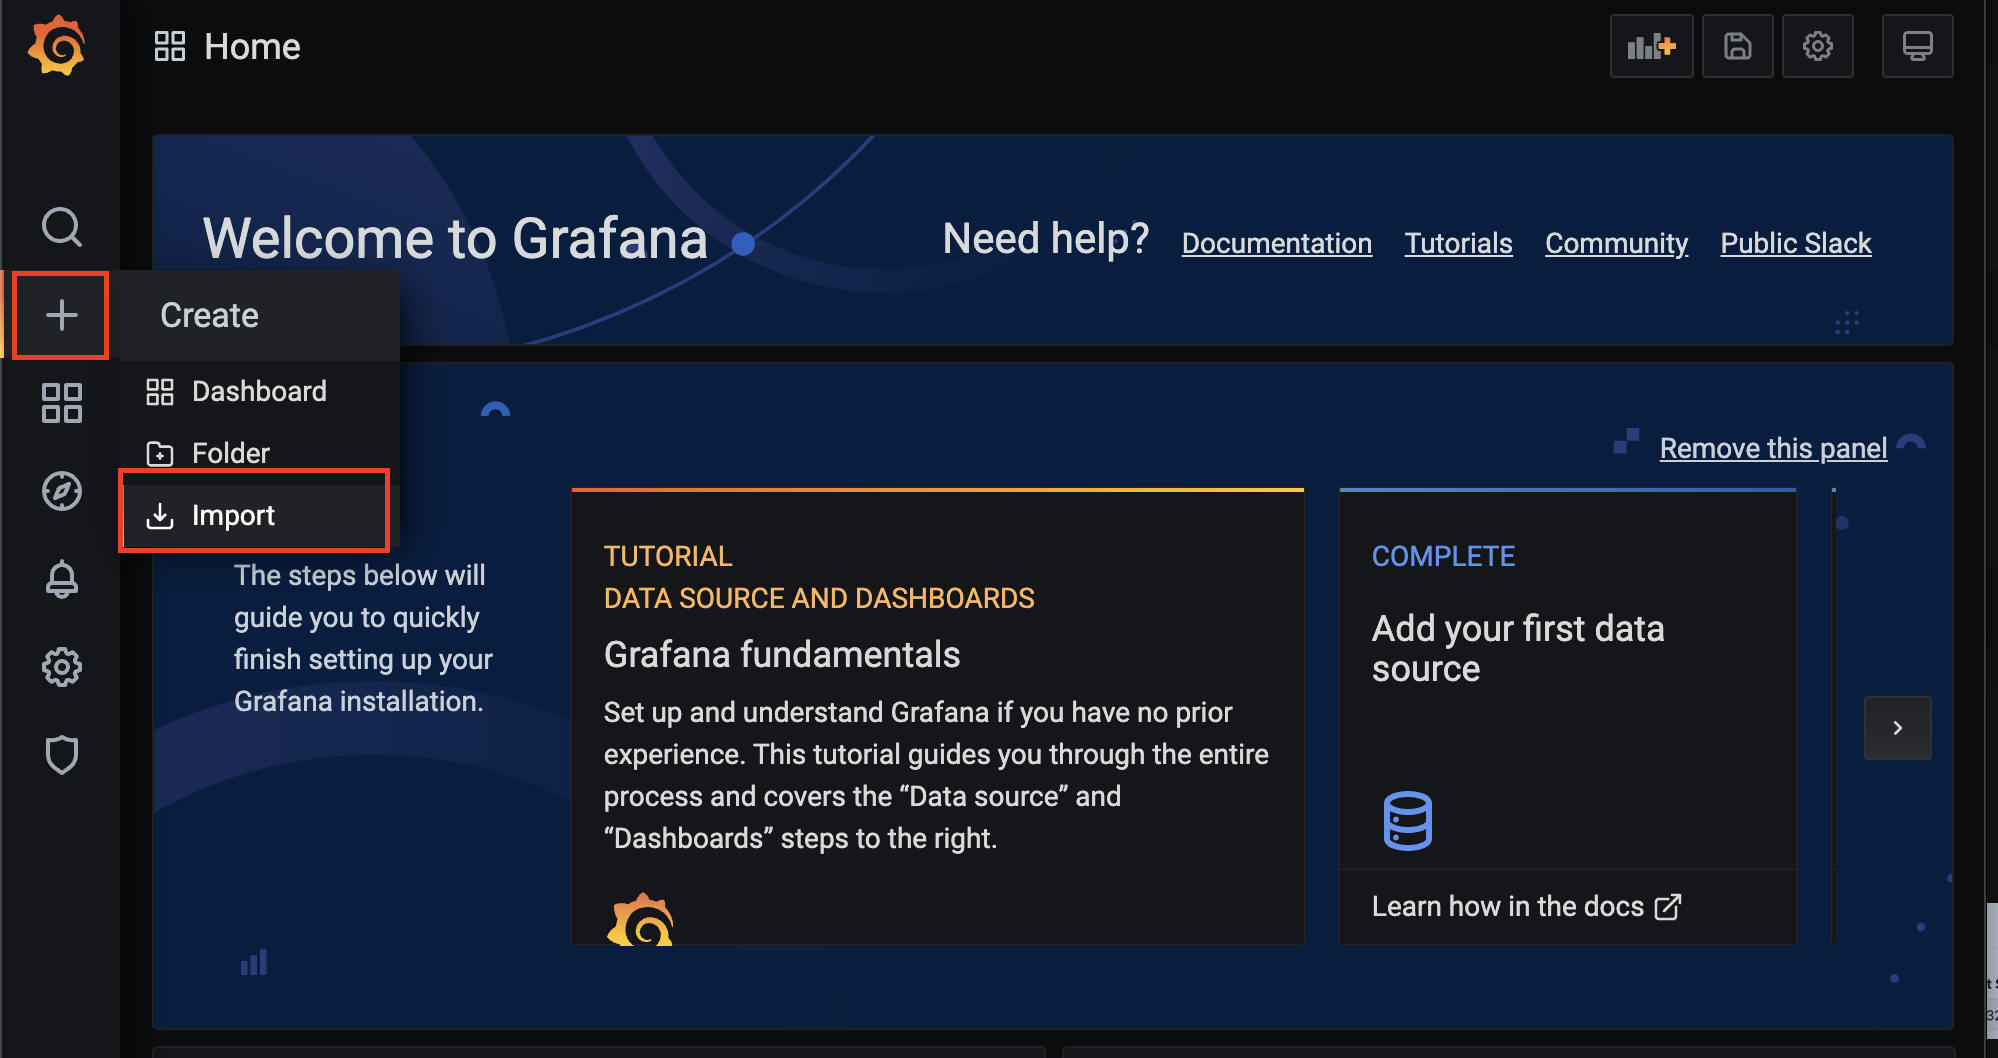
- 왼쪽 매뉴에 ‘Create’ > ‘import’ 클릭
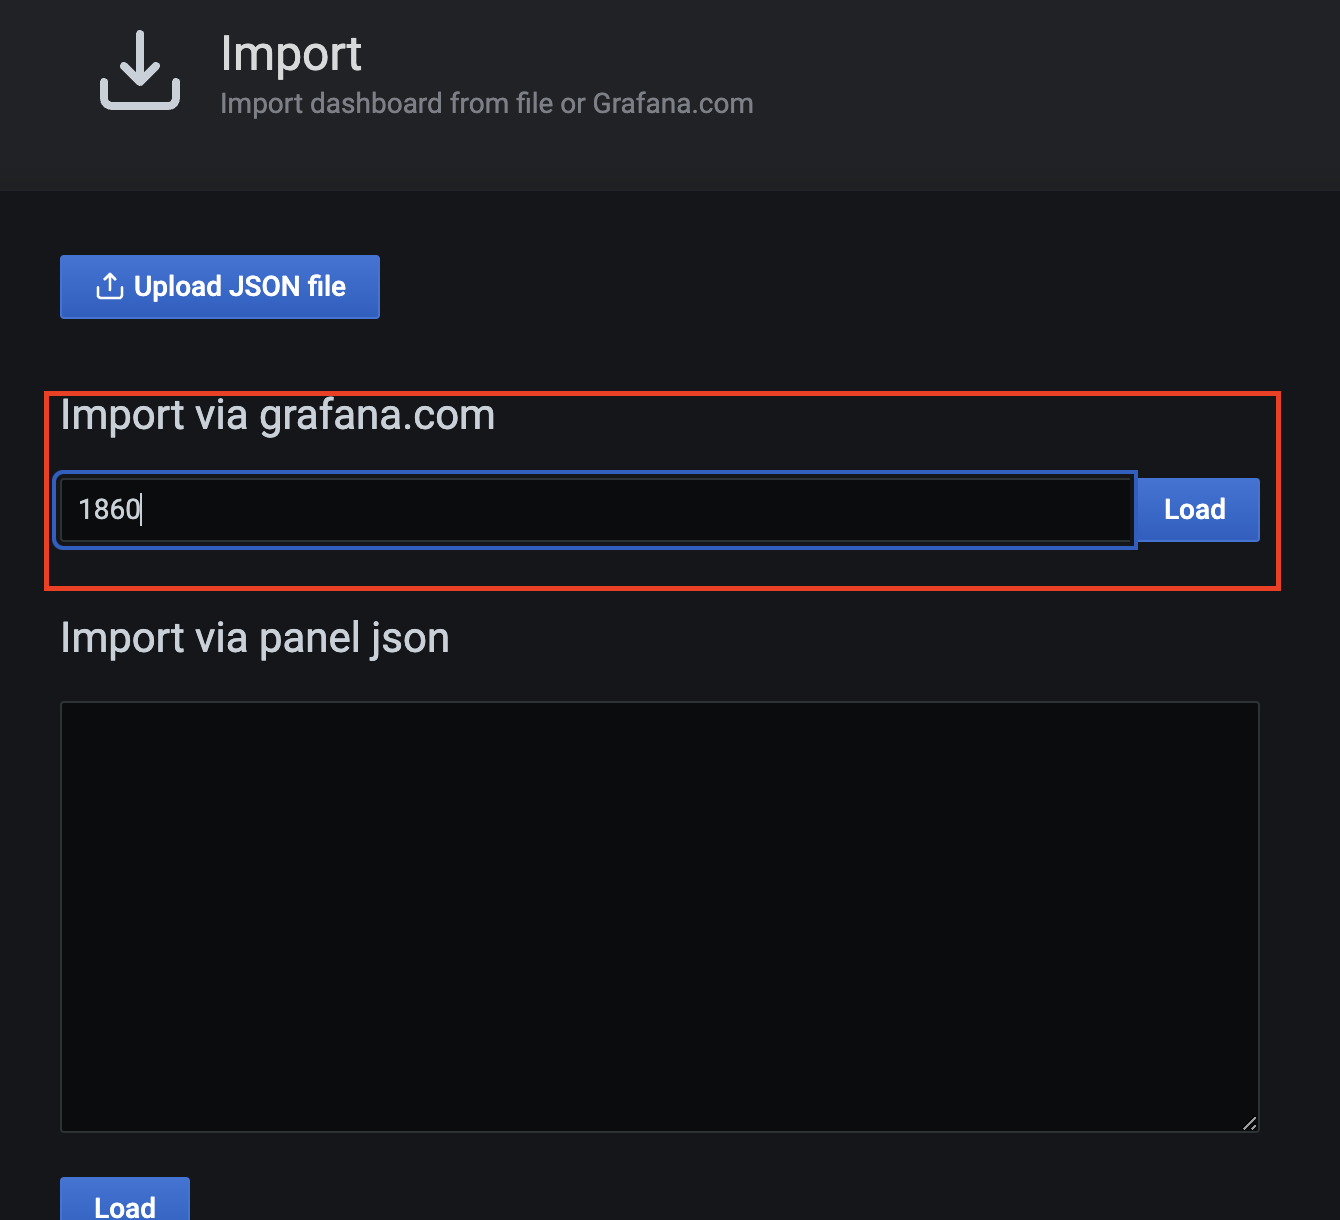
- 복사 했던 ID를 붙인 다음 Load 클릭
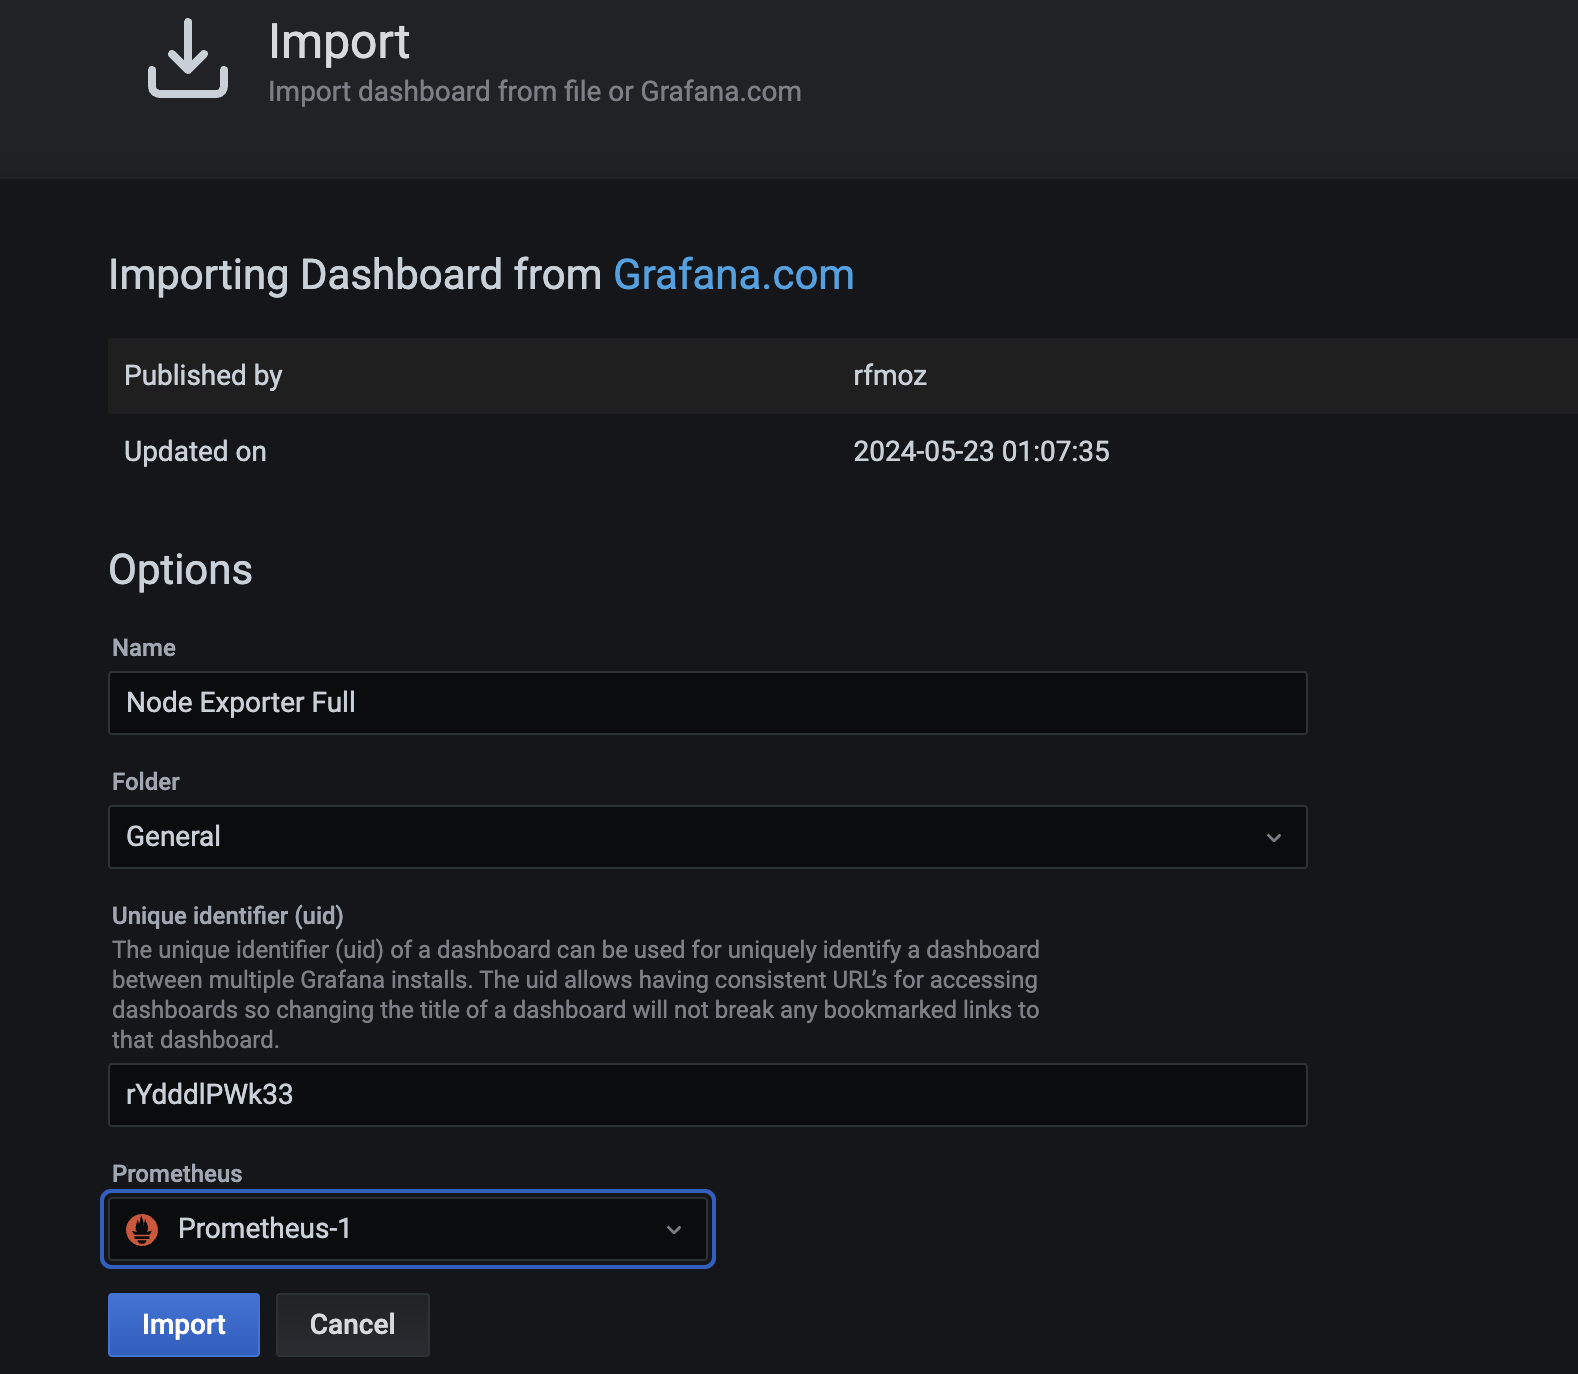
- Name, Folder, Prometheus 선택후 import 클릭
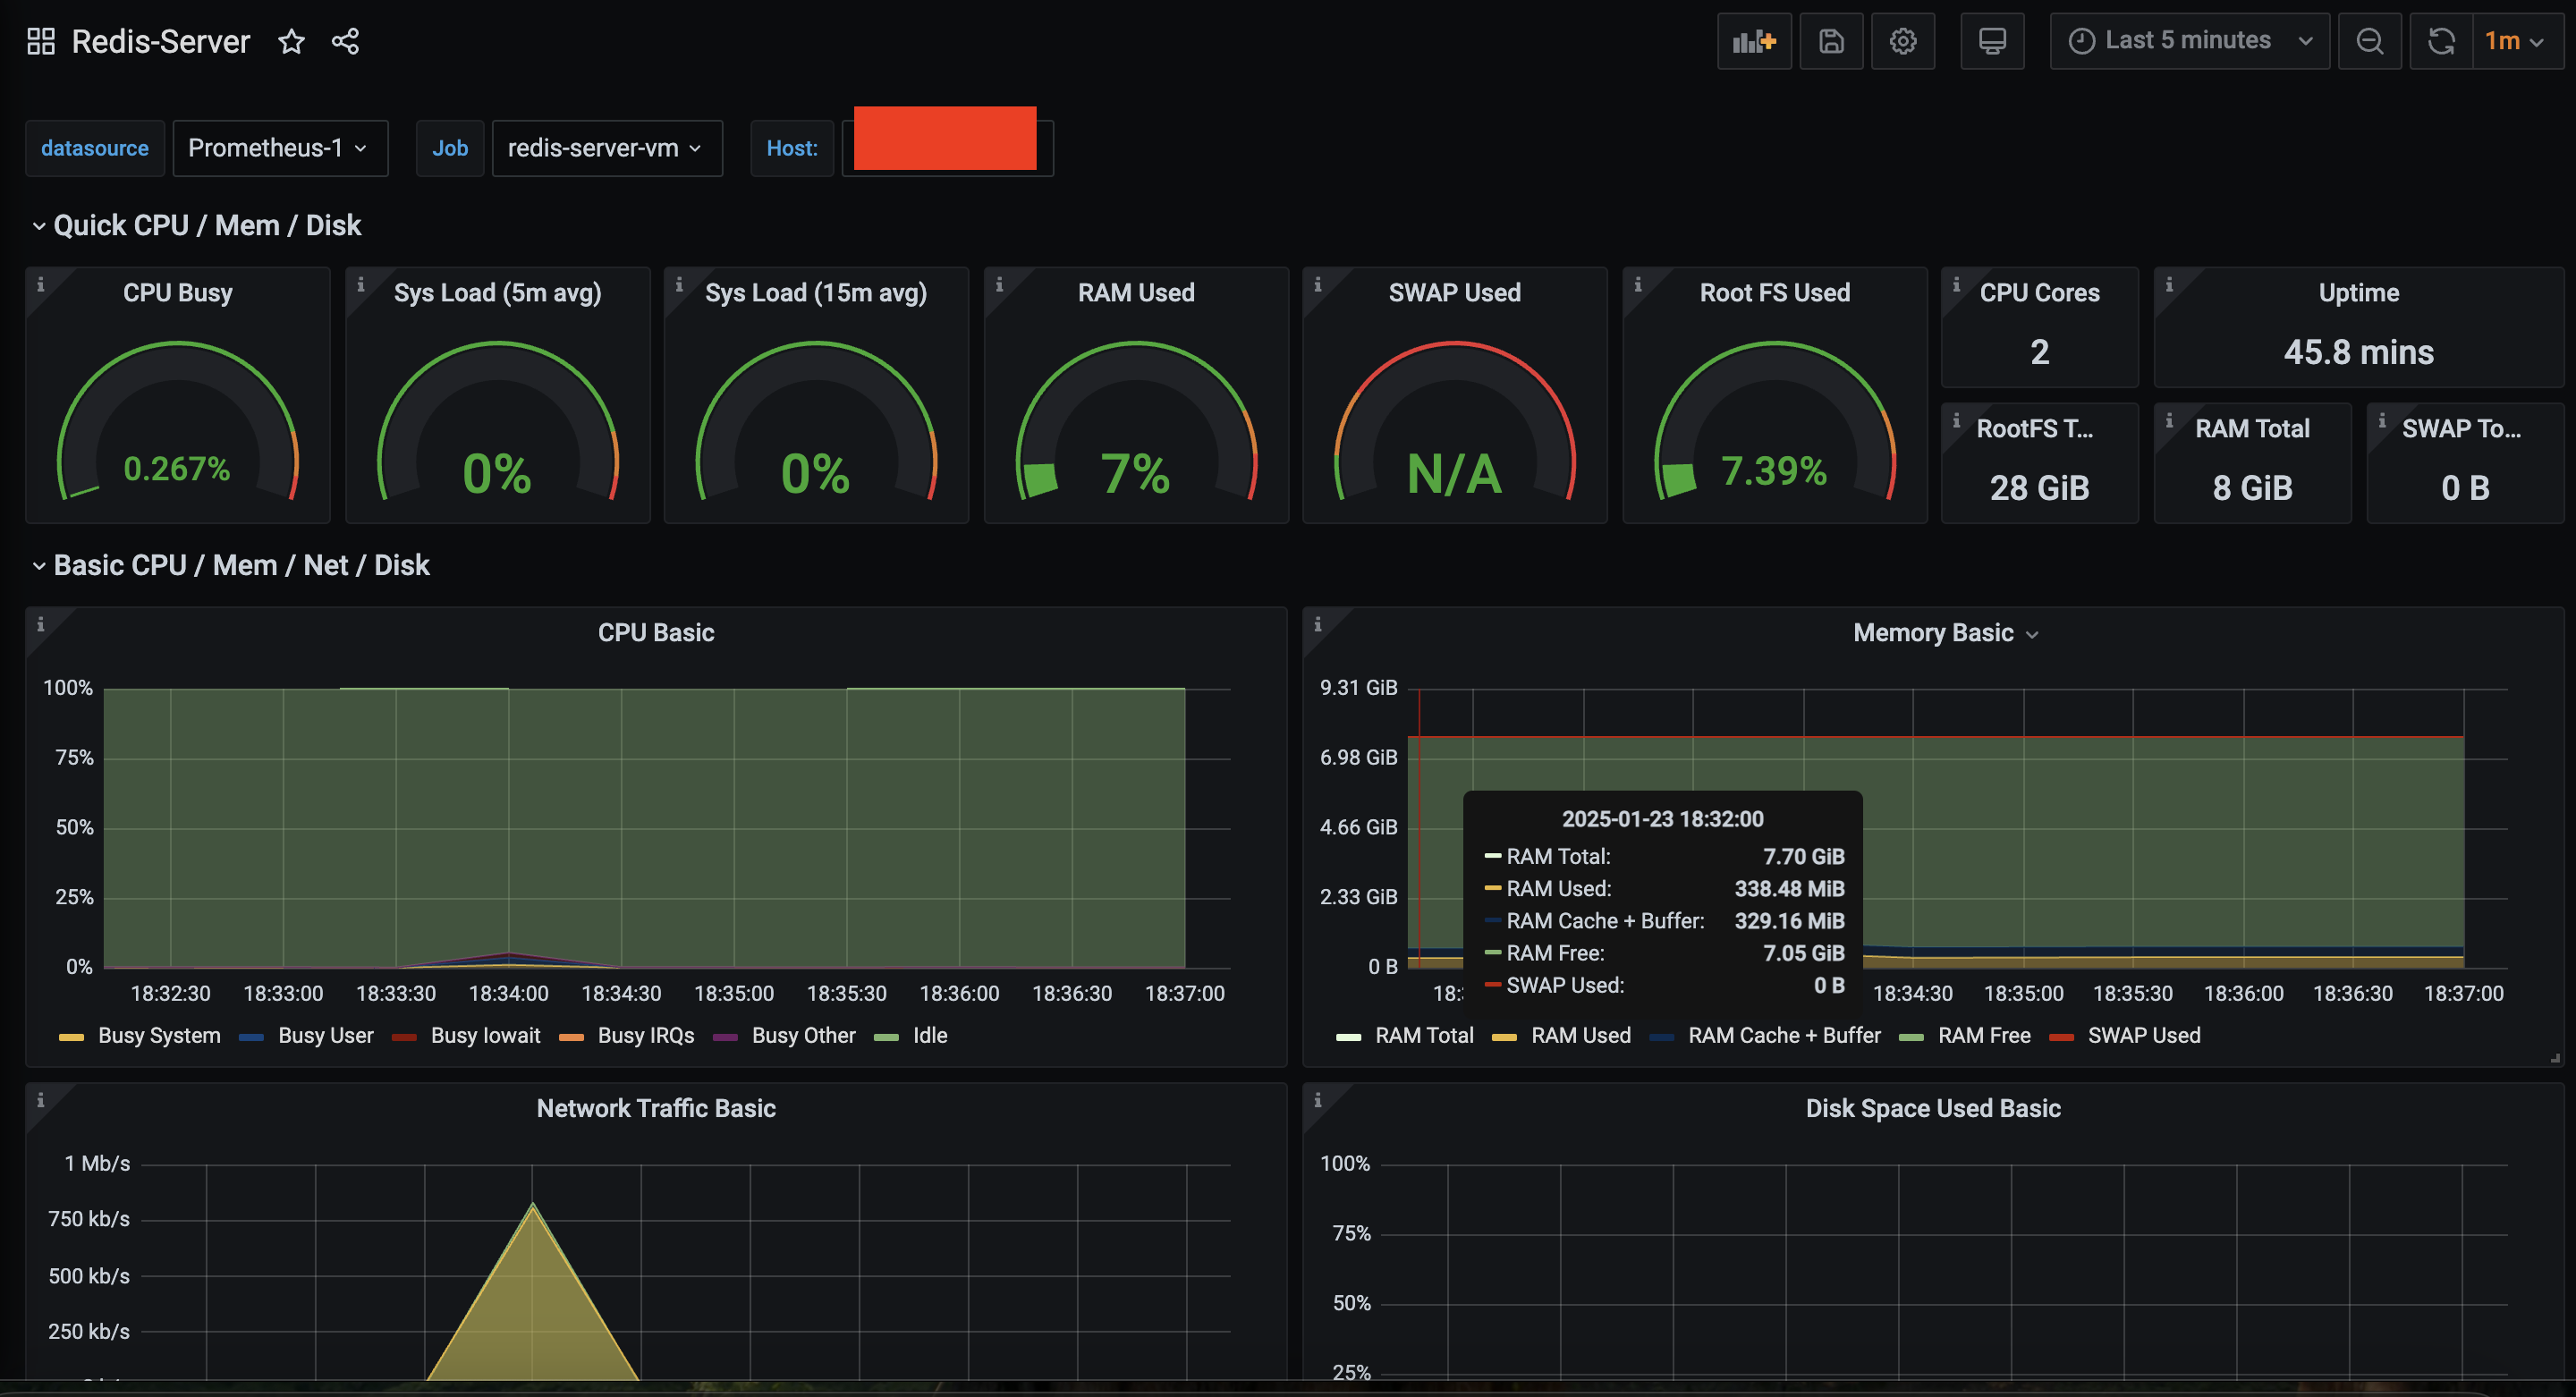
해당 과정을 진행하면 아래와 같이 대시보드가 생성 됩니다.
4. 마무리
Server Metrics 지표를 포함하여 모든 소프트웨어, VM에 Grafana Dashboard 연동은 끝났습니다.
다만 모니터링 시스템 구축이 완료될려면 아직 넘어야 할 산이 많습니다.
- 통합 로그 시스템 구축
- 소프트웨어, VM AlertManager 설정
- AlertManager - slack 연동
다음 포스팅 현재 구축해놓은 서버를 기준으로 통합 로그 시스템을 구축하는 내용을 작성할 예정입니다.
참조
- Node Exporter : https://github.com/prometheus/node_exporter
- 대시보드 검색 : https://grafana.com/grafana/dashboards/
- 대시보드 선택 : https://grafana.com/grafana/dashboards/1860-node-exporter-full/

DevOps Engineer