canvas
HTML의 <canvas>는 웹페이지에서 그래픽적인 것을 그릴 때 사용된다.
getContext 함수로 자바스크립트에서 canvas의 context를 가져와서 그 context에 그림을 그리게 되는 것이다.
chart
let myChartOne = document.getElementById('myCharOne').getContext('2d');

            let barChart = new Chart(myChartOne, {
                type : 'bar', //pie, line, doughnut, polarArea
                data : {
                    labels : [''],
                    datasets : [{
                        label : '',
                        data : []
                    }]
                }
            })
chartjs.html
<!DOCTYPE html>
<html>
<head>
<meta charset="UTF-8">
<title>chartJS</title>
<script src="https://cdnjs.cloudflare.com/ajax/libs/Chart.js/3.7.0/chart.min.js"></script>
<link href="https://cdn.jsdelivr.net/npm/bootstrap@5.1.3/dist/css/bootstrap.min.css" rel="stylesheet">
</head>
<body>
<div class="container">
<div class="row">
<div class="col-md-6">
<canvas id="myChartOne"></canvas>
</div>
<div class="col-md-6">
<canvas id="myChartTwo"></canvas>
</div>
<div class="col-md-6">
<canvas id="myChartThree"></canvas>
</div>
<div class="col-md-6">
<canvas id="myChartFour"></canvas>
</div>
</div>
</div>
<script>
let myChartOne = document.getElementById('myChartOne').getContext('2d');
let myChartTwo = document.getElementById('myChartTwo').getContext('2d');
let myChartThree = document.getElementById('myChartThree').getContext('2d');
let myChartFour = document.getElementById('myChartFour').getContext('2d');
let barChart = new Chart(myChartOne, {
type : 'bar', //pie, line, doughnut, polarArea
data : {
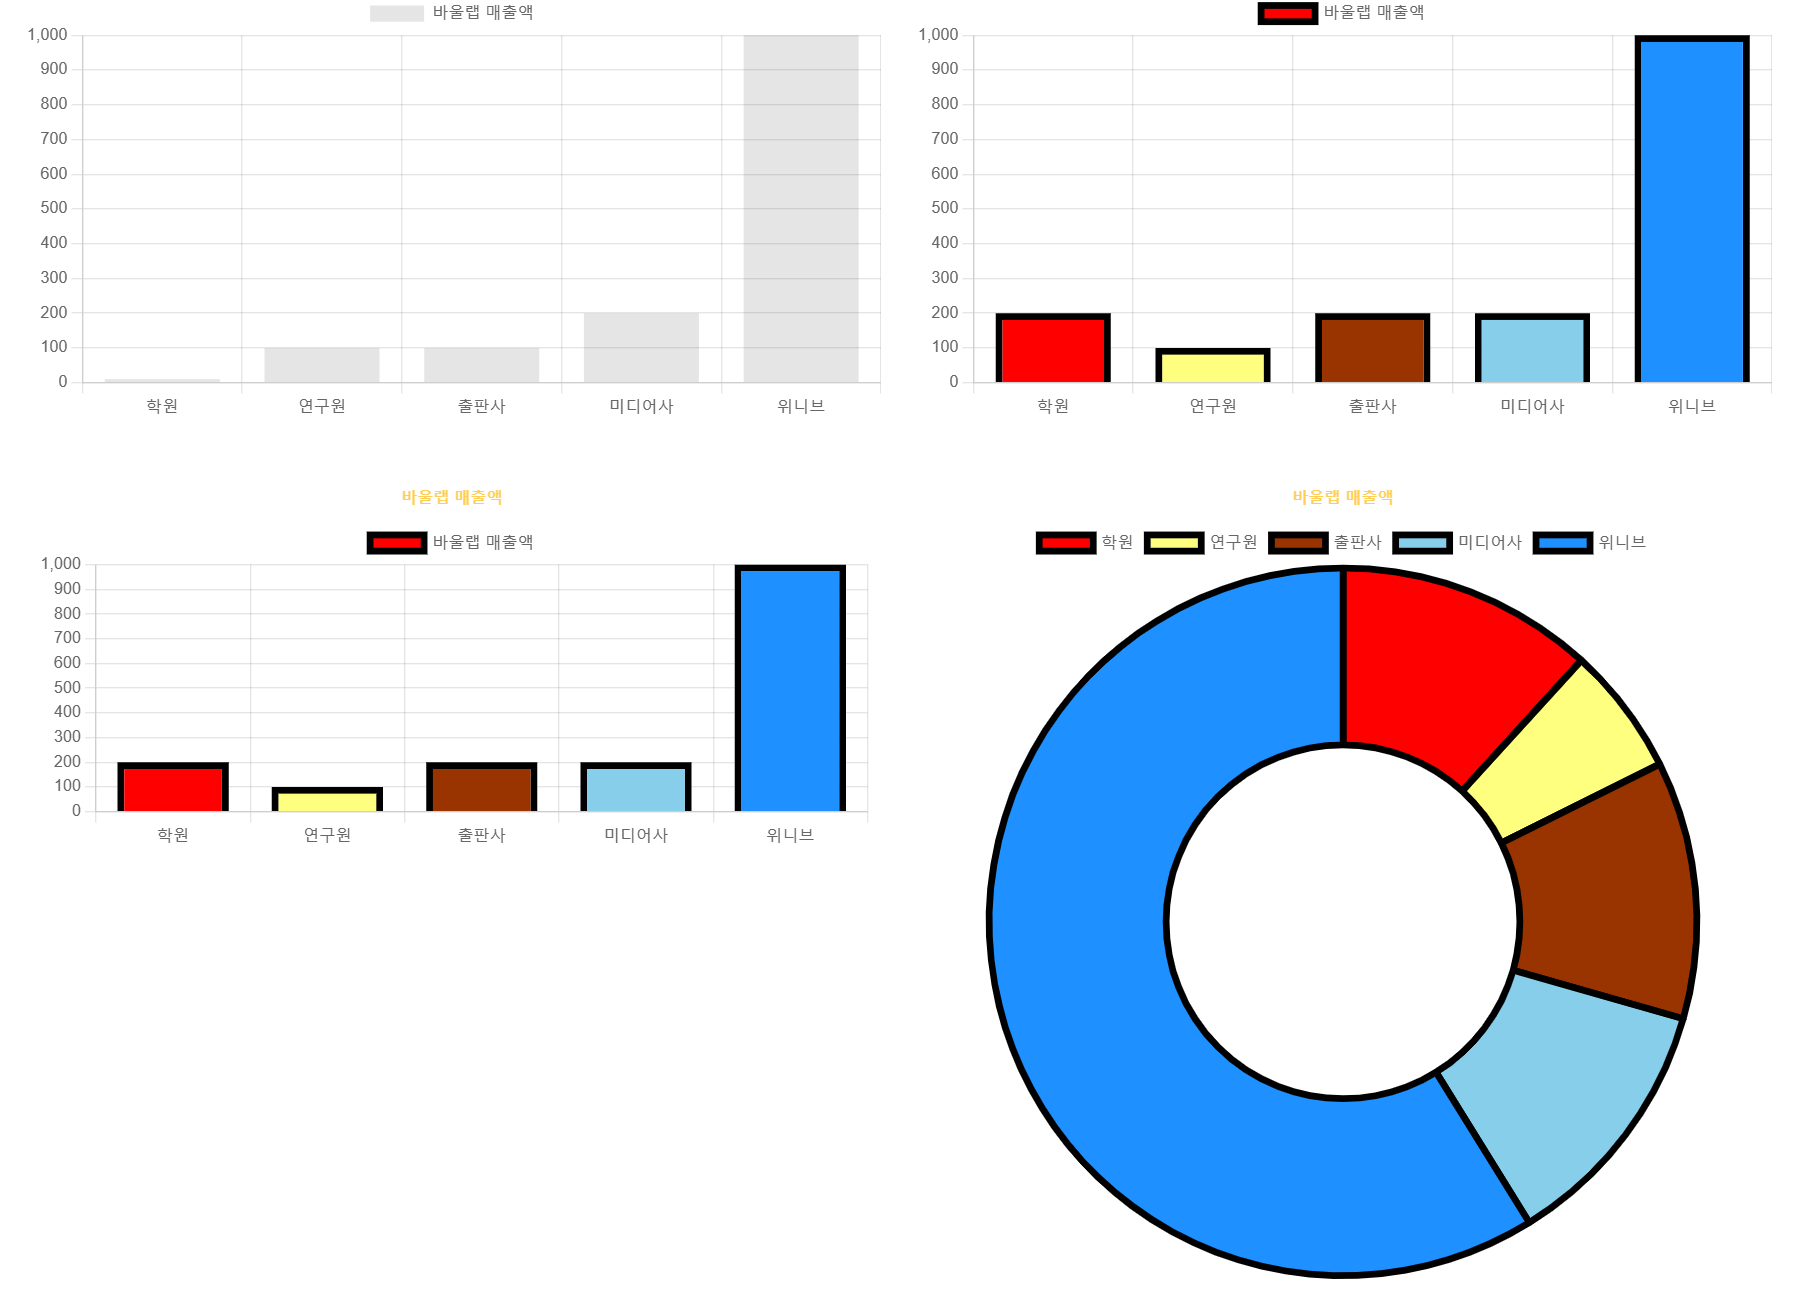
labels : ['학원', '연구원', '출판사', '미디어사', '위니브'],
datasets : [{
label : '바울랩 매출액',
data : [
10,
100,
100,
200,
1000
]
}]
}
});
let barChartTwo = new Chart(myChartTwo, {
type : 'bar', //pie, line, doughnut, polarArea
data : {
labels : ['학원', '연구원', '출판사', '미디어사', '위니브'],
datasets : [{
label : '바울랩 매출액',
data : [
200,
100,
200,
200,
1000
],
backgroundColor:[
'red',
'rgba(255, 255, 0, 0.5)',
'#993300',
'skyblue',
'dodgerblue'
],
borderWidth : 5,
borderColor : '#000',
hoverBorderWidth : 8,
}]
}
});
let barChartThree = new Chart(myChartThree, {
type : 'bar', //pie, line, doughnut, polarArea
data : {
labels : ['학원', '연구원', '출판사', '미디어사', '위니브'],
datasets : [{
label : '바울랩 매출액',
data : [
200,
100,
200,
200,
1000
],
backgroundColor:[
'red',
'rgba(255, 255, 0, 0.5)',
'#993300',
'skyblue',
'dodgerblue'
],
borderWidth : 5,
borderColor : '#000',
hoverBorderWidth : 8,
}]
},
options: {
plugins: {
title: {
display: true,
text: '바울랩 매출액',
color : '#ffce56'
},
legend : {
display : true,
position : 'top' // top, bottom, right, left
},
tooltip : {
enabled: false,
}
},
layout : {
padding : {
left : 10,
right : 10,
top : 40,
bottom : 0
}
}
}
});
let barChartFour = new Chart(myChartFour, {
type : 'doughnut', //pie, line, doughnut, polarArea
data : {
labels : ['학원', '연구원', '출판사', '미디어사', '위니브'],
datasets : [{
label : '바울랩 매출액',
data : [
200,
100,
200,
200,
1000
],
backgroundColor:[
'red',
'rgba(255, 255, 0, 0.5)',
'#993300',
'skyblue',
'dodgerblue'
],
borderWidth : 5,
borderColor : '#000',
hoverBorderWidth : 8,
}]
},
options: {
plugins: {
title: {
display: true,
text: '바울랩 매출액',
color : '#ffce56'
},
legend : {
display : true,
position : 'top' // top, bottom, right, left
},
tooltip : {
enabled: true,
}
},
layout : {
padding : {
left : 10,
right : 10,
top : 40,
bottom : 0
}
}
}
});
</script>
</body>
</html>화면

Front-end Engineer, Web Developer & UX/UI Design