Timeseries Anomaly Detection-(2) Datasets
DataSets
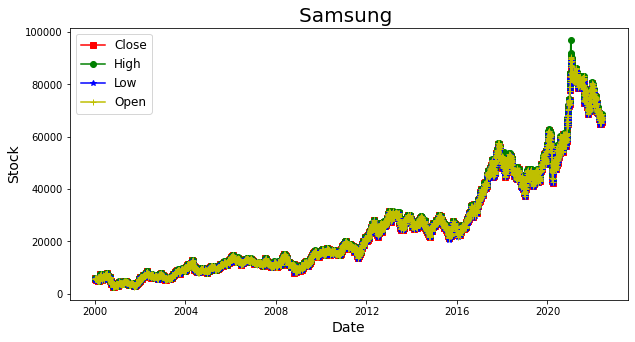
Dataset source : Yahoo Finance, Samsung Electronics. stock data(2000.01.04~2022.06.07)
1. Check data missing values
Check Samsung Electronics' stock data downloaded from Yahoo Finance for data missing, and remove any missing values.
import os
import pandas as pd
import requests

df = pd.read_csv('/content/drive/MyDrive/info-sec/samsung.csv')
# Change date data to Datetime format
df.loc[:,'Date'] = pd.to_datetime(df.Date)
# Check the integrity of the data
df.isna().sum()
print("삭제 전 데이터 길이(일자수):",len(df))
df = df.dropna(axis=0).reset_index(drop=True)
print("삭제 후 데이터 길이(일자수):",len(df))
df.isna().sum()
Result: Since the length of the data is the same before and after deletion, it is necessary to determine that there is no missing data set and perform Anomaly Detection.
삭제 전 데이터 길이(일자수): 5630
삭제 후 데이터 길이(일자수): 5630
2. Verify by graphing stock data
import matplotlib.pyplot as plt
from matplotlib.pylab import rcParams

plt.rcParams["figure.figsize"] = (10,5)
# Line Graph by matplotlib with wide-form DataFrame

plt.plot(df.Date, df.Close, marker='s', color='r')
plt.plot(df.Date, df.High, marker='o', color='g')
plt.plot(df.Date, df.Low, marker='*', color='b')
plt.plot(df.Date, df.Open, marker='+', color='y')

plt.title('Samsung ', fontsize=20)
plt.ylabel('Stock', fontsize=14)
plt.xlabel('Date', fontsize=14)
plt.legend(['Close','High','Low','Open'], fontsize=12, loc='best')
plt.show()- Result