The economics dataset represents various U.S. economic indicators on a monthly basis. A time series graph was created using this data. when diplaying the years on the x-axis through the code below, confidence interbals appeared.
sns.lineplot(data=economics, x='year', y='unemploy')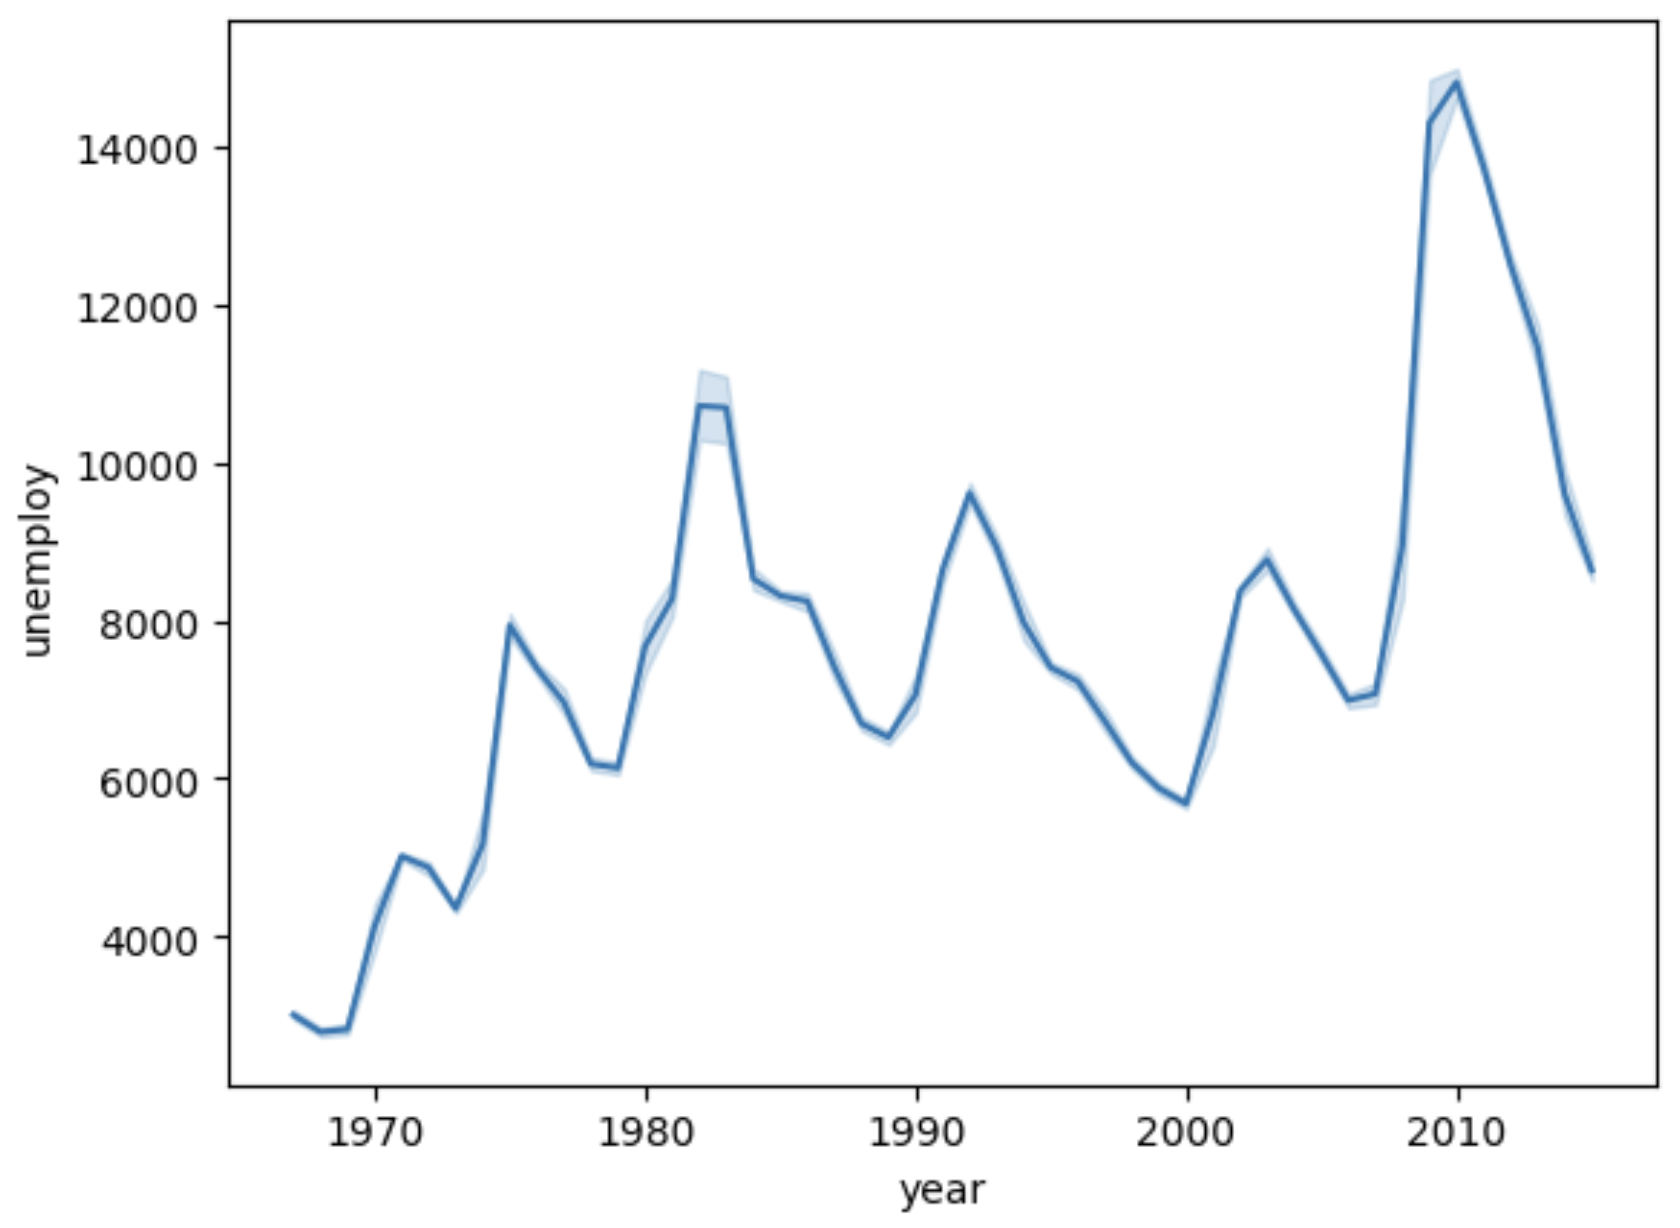
In seaborn's lineplot() function, the default confidence interval(CI) show the range within which the data is likely to lie with a certain level of confidence.
More specifically, a confidence interval represents the probability that the estimated mean, based on the given data, lies within that range. For example, if the confidence interval is 95%, it means there is a 95% chance that the true mean falls within this range.
In lineplot(), the confidence interval is typically drawn to visually express the uncertainty in the data, appearing as a shaded area around the line on the graph. It reflects the possibility that the actual values lie within this range, considering the data's variability or noise.
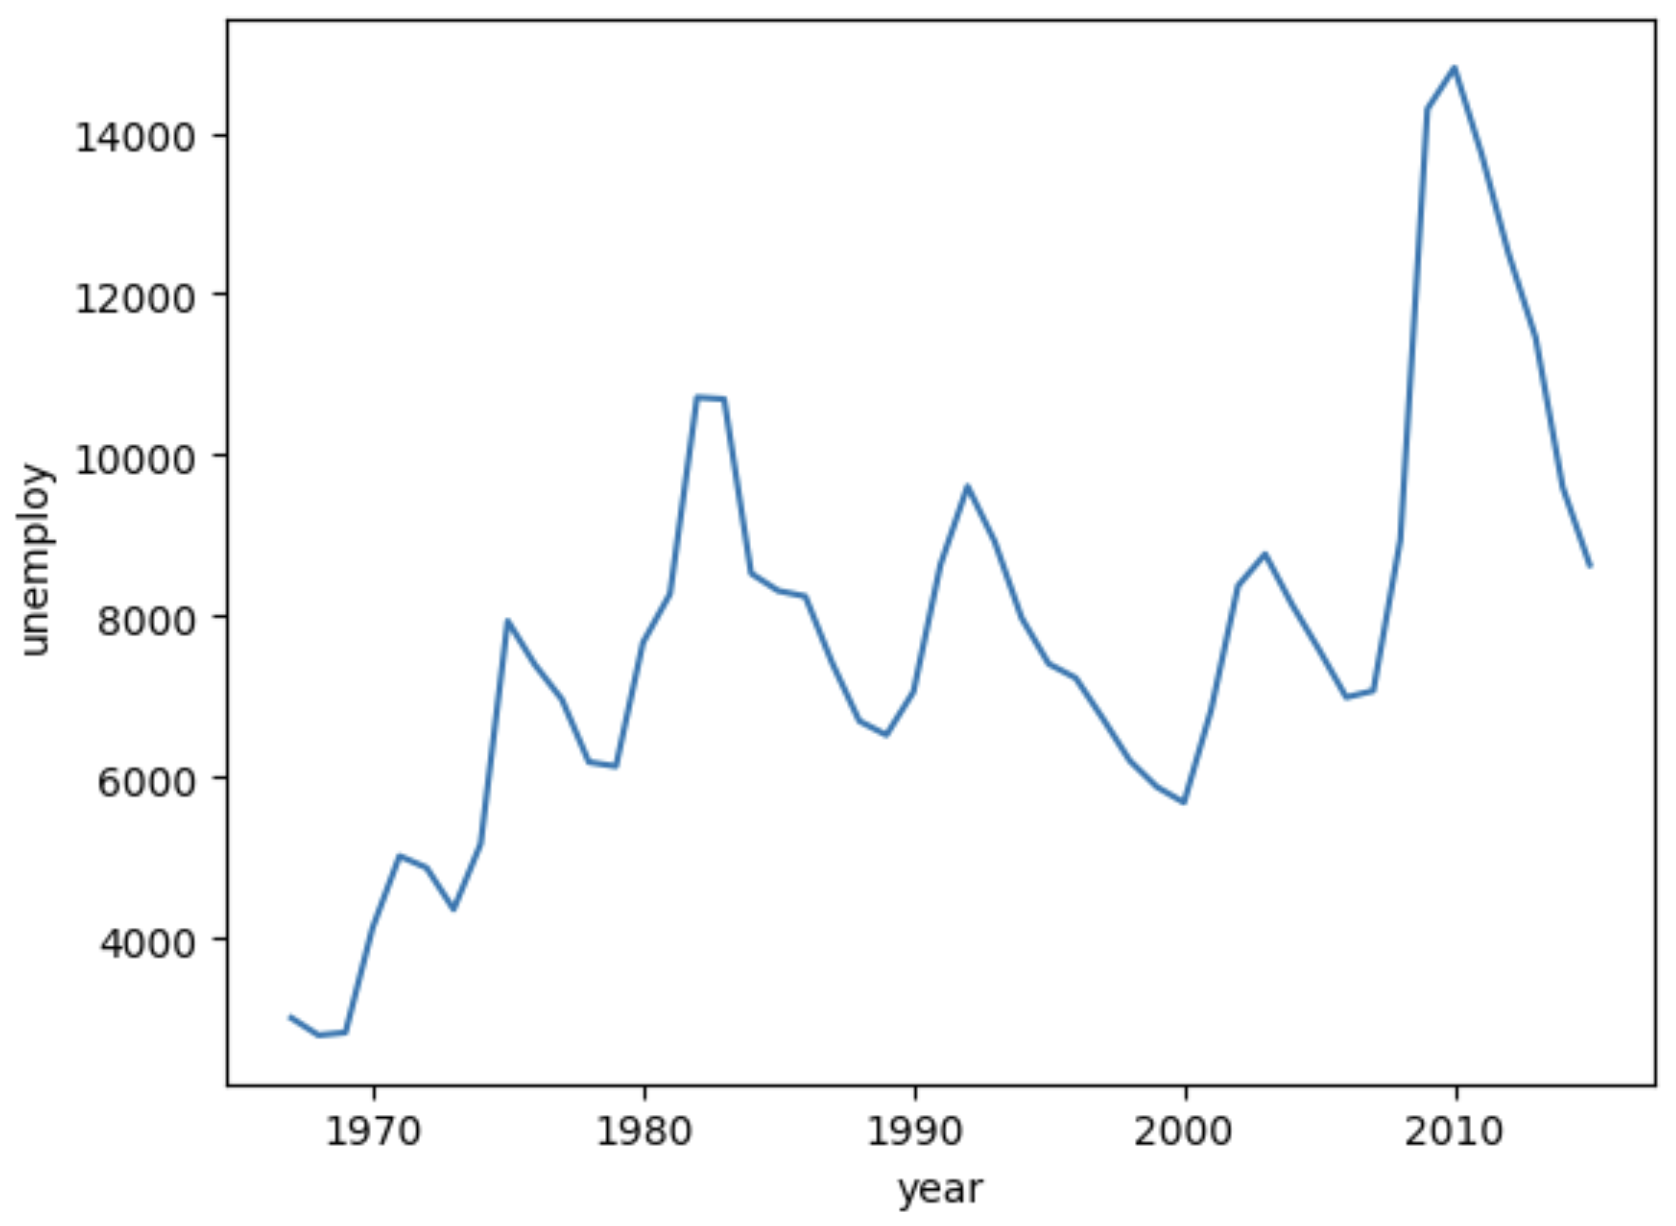
We can also remove the confidence interval by setting errorbar to None.
sns.lineplot(data=economics, x='year', y='unemploy',errorbar=None)