Motive
When I studied Pandas’s Data Correlations. I didn’t understand Data Correlations. Because I thought, shouldn't I just analyze it without having to worry about data correlation? So I decided to study why data correlation is important in data analysis.
What is Correlation Analysis?
Calculate the level at which a change in one variable causes another variable to change. (i.e., an attempt to find out to what extent two variables are related) There appears to be a strong correlation between two variables or indicators and one of them is If one variable is observed to behave in a particular way, it can be concluded that other variables are affected in a similar way.
Finding relationships between different events and patterns can uncover commonalities that are the root causes of events that on the surface seem unrelated and unexplainable.
What is Pearson's r formula?
A high correlation indicates a strong relationship between two indicators, while a low correlation indicates a weak relationship between the indicators. A positive correlation result (+1) indicates a strong correlation between two indicators and means that both indicators are increasing relative to each other, while a negative correlation result (-1) indicates a weak correlation between the indicators and means that one indicator increases. It means that other indicators are decreasing.
summary
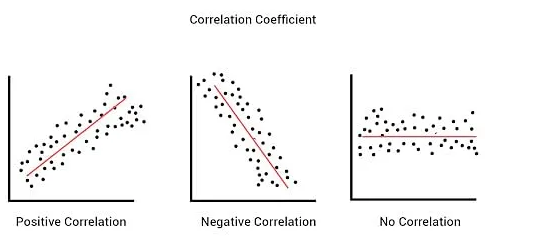
- +1: A perfect positive linear relationship. As one variable increases, the other variable also increases proportionally.
- -1: A perfect negative linear relationship. As one variable increases, the other variable decreases proportionally.
- 0: No linear relationship between the variables.
The correlation coefficient does not inherently indicate whether a result is "good" or "bad" but rather describes the relationship
- +1 or close to +1: Indicates that the variables move in the same direction. Whether this is good or bad depends on the context of the analysis.
- -1 or close to -1: Indicates that the variables move in opposite directions. Again, whether this is good or bad depends on the context.
- Close to 0: Indicates that there is no linear relationship between the variables.
Why Correlation Analysis is important?
Correlation analysis can reveal a meaningful relationship between two variables. If there appears to be a strong correlation between two variables or indicators, and one of them is observed to behave in a particular way, it can be concluded that the other is also affected in a similar way. This helps group related indicators together, reducing the need for individual data processing.
Using Numpy or Pandas for calculate the correlation between variables.
Numpy
Numpy doesn’t have a built-in fuction specifically for correlation, but I can use numpy.corrceof() to compute the correlation matrix.
import numpy as np

# Create sample data
x = np.array([1, 2, 3, 4, 5])
y = np.array([2, 4, 6, 8, 10])

# Calculate correlation matrix
correlation_matrix = np.corrcoef(x, y)

# Extract the correlation coefficient
correlation_coefficient = correlation_matrix[0, 1]

print("Correlation coefficient (NumPy):", correlation_coefficient) # 1.0
np.corrcoef(x, y)calculates the correlation matrix for the input arraysxandy.- The resulting matrix is 2x2, where the value at
[0, 1](or[1, 0]) is the correlation coefficient betweenxandy.
Pandas
Pandas has a built-in method DataFrame.corr() that makes calculating correlations straightforward.
import pandas as pd

# Create a DataFrame with sample data
data = {'x': [1, 2, 3, 4, 5],
        'y': [2, 4, 6, 8, 10]}
df = pd.DataFrame(data)

# Calculate the correlation matrix
correlation_matrix = df.corr()

# Extract the correlation coefficient
correlation_coefficient = correlation_matrix.loc['x', 'y']

print("Correlation coefficient (Pandas):", correlation_coefficient) # 1.0df.corr()calculates the correlation matrix for the DataFramedf.correlation_matrix.loc['x', 'y']retrieves the correlation coefficient between the columnsxandy.
I aksed the question to ChatGPT 3.5.
❓ Why are 'Data Correlations' important in Python's Pandas?
⚙ Data correlations are crucial in Python's Pandas (and data analysis in general) for several reasons. Correlation analysis helps to identify and quantify relationships between variables in a dataset. Understanding these relationships is essential for multiple aspects of data analysis, including feature selection, data preprocessing, and model building. Here are some key reasons why data correlations are important:
1. Identifying Relationships Between Variables
Correlation measures the strength and direction of a linear relationship between two variables. Understanding these relationships can help you make informed decisions about your data.
- Positive Correlation: As one variable increases, the other also increases (e.g., height and weight).
- Negative Correlation: As one variable increases, the other decreases (e.g., age and remaining years until retirement).
2. Feature Selection and Engineering
In machine learning, feature selection is the process of choosing the most relevant features for model building. Highly correlated features can provide similar information, leading to redundancy.
- Removing Redundancy: By identifying highly correlated features, you can remove redundant features to simplify the model and avoid multicollinearity, which can negatively impact model performance.
- Creating New Features: Understanding correlations can also help create new features that better capture the underlying patterns in the data.
3. Data Cleaning and Preprocessing
Correlation analysis can assist in identifying anomalies and outliers in your data.
- Detecting Outliers: Unusual correlations might indicate outliers or data entry errors that need to be addressed.
- Handling Missing Values: Knowing the correlations between variables can help in imputing missing values more accurately.
4. Hypothesis Testing and Insights
Correlation analysis can help in testing hypotheses and gaining insights into the data.
- Validating Assumptions: Before building predictive models, it is essential to validate assumptions about relationships between variables.
- Exploratory Data Analysis (EDA): Correlation analysis is a vital part of EDA, providing initial insights into how variables are related.
5. Building Predictive Models
Correlation analysis is essential in the context of building predictive models, especially linear models.
- Model Selection: Understanding correlations helps in selecting the right type of model (e.g., linear regression for linear relationships).
- Improving Model Accuracy: Knowing the relationships between variables can help in crafting better models that capture the underlying patterns more accurately.
6. Multicollinearity Detection
In regression analysis, multicollinearity occurs when independent variables are highly correlated, which can cause issues with estimating coefficients accurately.
- Detecting Multicollinearity: Correlation analysis helps identify multicollinearity, enabling you to take corrective measures, such as removing or combining correlated variables.
Reference
