
파이썬에서 3D 그래프 그리기
코드
import matplotlib.pyplot as plt

fig = plt.figure()

ax = fig.add_subplot(1, 1, 1, projection='3d')

ax.plot([0, 0, 0], [0, 2, 4], [0, 5, 0], '')
#ax.plot([x1, x2, x3], [y1, y2, y3], [z1, z2, z3], '')

plt.show()- 점A (x1, y1, z1)을 좌표 위에 찍을 때 ax.plot([x1], [y1], [z1])이 된다.
- 같은 원리로 점 2개를 찍으면 직선이, 3개를 찍으면 꺾은선 그래프를 그릴 수 있다.
- 점3개를 찍으면 아래와 같다.
ax.plot([x1, x2, x3], [y1, y2, y3], [z1, z2, z3], '색상, 선의형태등 속성 추가')결과

코드
import matplotlib.pyplot as plt

fig = plt.figure()

ax = fig.add_subplot(1, 1, 1, projection='3d')

ax.plot([0, 0, 0], [0, 2, 4], [0, 5, 0], '')
ax.plot([1, 1, 1], [0, 2, 4], [0, 5, 0], '')
ax.plot([-1, -1, -1], [0, 2, 4], [0, 5, 0], '')
#ax.plot([x1, x2, x3], [y1, y2, y3], [z1, z2, z3], '')

plt.show()- plot을 3개를 두면 그래프 3개를 그릴 수 있다.
- 각각 x좌표만 다른 같은 형태의 그래프다.
결과

크롤링하여 DB에 저장한 데이터로 그래프 그리기
코드
import matplotlib.pyplot as plt
from day14.stockdao import StockDao

sd = StockDao()
#DAO사용해서 DB에서 데이터 가져오기
samsung = sd.select("삼성전자")
sk = sd.select("SK")
lg = sd.select("LG")
# 가격을 담을 리스트 생성
samPriceList = []
lgPriceList = []
skPriceList = []
# 각 x좌표를 담을 리스트 생성
x1 = []
x2 = []
x3 = []
# 각 y좌표를 담을 리스트 생성
y1 = []
y2 = []
y3 = []
# samsung 데이터 꺼내오기
for idx, i in enumerate(samsung):
    firstPrice = samsung[0].get('price')
    price = i.get('price')
    gap = price - firstPrice
    percent = gap/firstPrice*100
    samPriceList.append(percent)
    x1.append(0)
    y1.append(idx)


for idx, i in enumerate(lg):
    firstPrice = lg[0].get('price')
    price = i.get('price')
    gap = price - firstPrice
    percent = gap/firstPrice*100
    lgPriceList.append(percent)
    x2.append(1)
    y2.append(idx)

for idx, i in enumerate(sk):
    firstPrice = sk[0].get('price')
    price = i.get('price')
    gap = price - firstPrice
    percent = gap/firstPrice*100
    skPriceList.append(percent)
    x3.append(2)
    y3.append(idx)

fig = plt.figure()

ax = fig.add_subplot(1,1,1, projection='3d')

ax.plot(x1, y1, samPriceList,'r')
ax.plot(x2, y2, lgPriceList,'g')
ax.plot(x3, y3, skPriceList,'b')

plt.show()- 각 데이터를 담은 리스트에서 금액만 하나씩 꺼내서 리스트에 담는다.
for idx, i in enumerate(samsung):
	# 그래프를 %로 나타내기 위해 비교할 첫 가격
    firstPrice = samsung[0].get('price')
	# samsung에 {'price':10000}의 형태로 저장된 dict타입 데이터에서 금액만 꺼내오기
    price = i.get('price')
	# 첫 금액과 꺼내온 금액과의 차액을 구함
    gap = price - firstPrice
	# 그 차이를 %로 나타냄
    percent = gap/firstPrice*100
	# 퍼센티지를 리스트에 추가하기 (z축을 구성)
    samPriceList.append(percent)
	# x좌표를 전부 0으로 하기 위해 데이터 갯수만큼 x1리스트에 0을 추가
    x1.append(0)
	# y좌표를 데이터 하나당 1칸 씩 이동시키기 위해 idx값을 y1에 추가
    y1.append(idx)

fig = plt.figure()

ax = fig.add_subplot(1,1,1, projection='3d')
plt.show()
결과

- 변동한 가격의 비율로 나타냈기 때문에 눈에 뚜렷하게 변화가 보인다.
- 가격의 비율이 아니라 가격 그 자체를 비교한다면 한 그래프 안에서 변화하는 폭이 미미하게 보인다
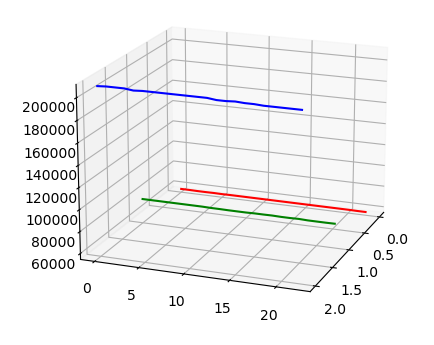
- 좌표의 상한, 하한 값을 정해줄 수가 있다.
ax.set_xlim3d(-1, 3)
ax.set_ylim3d(0, 30)
ax.set_zlim3d(50000, 200000)

김성겸